


Services on Demand
Article
 English (pdf)
 Article in xml format
 Article references
Indicators

Related links
-
 Cited by Google
 -
 Similars in Google
Share

 Permalink
South African Journal of Sports Medicine
On-line version ISSN 2078-516X
Print version ISSN 1015-5163
SA J. Sports Med. vol.30 n.1 Bloemfontein 2018
http://dx.doi.org/10.17159/2078-516x/2018/v30ila5720
REPORT
The Currie Cup Premiership Competition Injury Surveillance Report 2014 - 2017
Lindsay StarlingI; Clint ReadheadII; Wayne ViljoenIII; James BrownIV; Nicola SewryV; Mike LambertVI
IUniversity of Cape Town
IISA Rugby, Senior Manager: Medical, and University of Cape Town
IIISA Rugby, Senior Manager: Rugby Safety, and University of Cape Town
IVUniversity of Stellenbosch
VUniversity of Cape Town
VIUniversity of Cape Town
ABSTRACT
The content of the report is based on data collected by the SA Rugby Injury and Illness Surveillance and Prevention Project (SARIISPP) steering group.
SA Rugby and authors of the report would like to acknowledge the following doctors and thank them for their contributions to this project:
Dr Rob Collins, Dr Anri Van Tonder, Dr Alan Kourie, Dr Herman Rossouw, Dr Jason Suter, Dr Karen Schwabe, Dr Rudi de Wet, Dr Konrad von Hagen, Dr Louis Holtzhausen, Dr Org Strauss, Jacques Du Toit, Luzahn Louw, Margaret van den Heever, Lance Lemmetjies, Niel Murphy and Chris Hopwood.
Executive Summary
The Currie Cup 2017 Premiership Division Competition ('The Currie Cup') injury data were recorded throughout the tournament by the medical doctors of the respective teams. All seven teams were required to record every match injury that occurred in their team. Unfortunately, the ORC Griquas' did not capture complete data, thus had to be excluded from any analysis where Time-Loss injuries were concerned. The six teams involved in the 2017 tournament who captured complete data for this report, were the Vodacom Blue Bulls, DHL Western Province, Cell C Sharks, Toyota Free State Cheetahs, Steval Pumas, and Xerox Golden Lions. Only match injuries and match time exposure for each participating team were considered for this report.
The injury rate of Time-Loss injuries for The Currie Cup 2017 was 81 (67 to 95) injuries per 1000 player hours, which is almost identical to the rate of the meta-analysis, 81 (63 to 105) injuries per 1000 player hours[2], and equates to 1 injury per team per match. The average severity of Time-Loss injuries was 37 days lost, and median severity 13 days (IQR 7 to 38).
Compared to the international literature, in 2017, The Currie Cup injury rate for new Time-Loss injuries was similar, the average severity was greater and the overall rate of the recurrent injuries was significantly lower than the meta-analysis[2]. Of the 126 Time-loss injuries in 2017, 22 players (17% of the player pool of 6 teams counted, excluding ORC Griquas) contributed to 55 or 43% of all of the 2017 Tournament's injuries.
DHL Western Province had the lowest injury rate for the 2017 tournament and this was significantly lower than the tournament average. The Steval Pumas had the highest injury rate for the 2017 tournament. This was significantly higher than all other teams competing in the tournament and the tournament average. The Steval Pumas had a significant increase, and DHL Western Province had a significant decrease in injury rate in 2017 compared to their injury rate in previous years' tournaments.
During The Currie Cup 2017 tournament there were less injuries estimated to be of minimal severity, and more estimated to be moderate and severe in comparison to previous years. After comparing the actual severity of injuries against the estimations, the data revealed that doctors overestimated the less severe, and underestimated the 'severe' injuries. The average severity of Time-Loss injuries in the 2017 tournament was 37 days, which is higher than the 32 days reported in the England Professional Rugby Injury Surveillance Project, March 2017 report[4]. The median injury severity of all Time-Loss injuries was 13 days with 25% of injuries lasting for 7 days or less and 25% of injuries lasting for 38 days or more.
The Steval Pumas had the highest number of Time-Loss injuries but were second lowest on average severity. DHL Western Province had the lowest number of Time-Loss injuries, but were second highest on average severity.
There was one career ending injury sustained in The Currie Cup 2017. Due to the nature of this injury and the large inaccuracies in determining severity, this injury was included in all injury rate calculations, but was removed from all severity calculations. It must however be acknowledged that removing an injury of such a nature has a substantial knock-on effect on the injury severity calculations, and the interpretation of the involved data must be performed with this in mind.
Sprained ligament and muscle (rupture/strain/tear) injuries remained the first and second most common injury types for the fourth consecutive year. The head and shoulder were the first and second most common injury locations for the first time since the first Currie Cup Report in 2014. There has been a consistent increase in injuries to the shoulder over the past four years. Almost all injuries to the shoulder in 2017 occurred during the tackle, with majority of them occurring while performing the tackle. Concussions were the most frequently diagnosed injury according to the OSICS classification diagnosis for 2017, which remains consistent with 2016's report.
For the fourth consecutive year the tackle event accounted for the most Time-Loss injuries, with front-on tackling remaining the most common injury mechanism.
Mbombela Stadium, Nelspruit had the highest injury rate for The Currie Cup 2017 and this was significantly higher than the 2015, 2016 and 2017 tournament average injury rates. The injury rate for playing matches away was higher than playing matches at home.
SA Rugby and authors of the report would like to acknowledge the following doctors and thank them for their contributions to this project over the years: Dr Rob Collins, Dr Anri Van Tonder, Dr Alan Kourie, Dr Herman Rossouw, Dr Jason Suter, Dr Karen Schwabe, Dr Rudi de Wet, Dr Konrad von Hagen, Dr Louis Holtzhausen, Dr Org Strauss, Jacques Du Toit, Luzahn Louw, Margaret van den Heever, Lance Lemmetjies, Niel Murphy and Chris Hopwood.
Introduction
In 2014, the South African Rugby Union (SA Rugby) implemented a new standardised injury surveillance format for The Currie Cup Premiership Division Competition. This required the team doctor to electronically capture all relevant match injury data on an Application (App) on their cell-phone or tablet. The App provided doctors with the standardised BokSmart injury surveillance data capture format, which is based on the international consensus statement[1] for injury recording in rugby union.
Injury surveillance is the critical first step in the development of injury prevention strategies for a particular group. Injury surveillance captured in the correct format enables the comparison of injury rates between teams within the same tournament, tournament injuries over successive years, and with other rugby injury surveillance studies. Literature describing tournament injuries presents the injury numbers as a rate where the total number of injuries is divided by the total amount of time exposed to the risk of experiencing that particular injury. An injury rate is expressed as a number of events per 1000 player hours. This normalised version of the number facilitates comparison between The Currie Cup teams in 2017, previous tournaments and the international injury surveillance literature. Throughout this report the normalised injury rates have been provided to allow for comparison with other tournaments and the international literature, as discussed, but every effort has been made to present these rates on a 'per team' and 'per match' level for easier and more pragmatic interpretation.
Since 2016, The Currie Cup doctors were asked to record the physical return to play date of the injured players, thereby allowing for the actual severity of the injury to be calculated. For those cases, where the player had not returned to play by the start of the following year, doctors were asked to provide an estimated return to play date. The severity of these particular injuries was then calculated using the estimated date provided, and not the actual date. Calculating the actual severity of most injuries adds substantially to the report as it allows for one to determine the burden of the teams' injuries with greater accuracy. Injury burden is a combination of the injury rate and severity and is expressed as the number of days' absent from training and matches per 1000 player hours.
It is important to note that a multitude of factors contribute to players' injury risk and injury causing events. The medical, conditioning, coaching staff and the players themselves are equally responsible for ensuring that players are medically, mentally and physically fit to handle the demands of the competition. Additionally, each player has unique intrinsic and extrinsic factors that have the potential to increase their risk of injury, which are beyond the team staffs' control.
An inherent issue with any injury surveillance study is that the Teams' Medical doctors are exclusively responsible for entering their team's injury data. As no audit process is done on the collection of this data, doctors are trusted to declare all injury information. As such, a potential limitation of this study is that the doctor might not enter all injury information due to the additional administrative burden. However, this potential limitation is present in most injury surveillance studies.
In 2017, The Currie Cup semi-finals were between DHL Western Province vs Xerox Golden Lions and Cell C Sharks vs Vodacom Blue Bulls. The final was between DHL Western Province vs Cell C Sharks, with DHL Western Province ultimately winning the tournament.
Definitions
MEDICAL ATTENTION INJURY:
The injury definitions were based on the most recent Consensus Statement of 2007 for injury reporting in rugby union[1]. All injuries that were seen by the Team Medical Doctors were classified as Medical Attention injuries, which are defined by the statement as an "injury that results in a player receiving medical attention"[1].
TIME-LOSS INJURY:
Medical Attention injuries were further categorised as Time-Loss injuries, where appropriate, which are defined as "an injury that results in a player being unable to take a full part in future rugby training or match play" [1].
INJURY RATE:
For this report, an injury rate is the number of injuries expressed per 1000 player exposure hours. This normalised version of the number of injuries facilitates comparison between The Currie Cup Premiership teams in 2017, previous tournaments and to other international literature. Moreover, the injury rate is expressed as a mean with its 95% confidence intervals. A 95% confidence interval around a mean value indicates that there is a 95% chance (i.e. very high chance) that the true value falls within this range. Therefore, in this report, if the range of confidence interval values of two of The Currie Cup teams do not overlap, there is a very high chance (95%) that their injury rates are truly (or significantly) different from each other.
MEDIAN (INTERQUARTILE RANGE):
When values are rank-ordered from lowest to highest, the median is the value which separates the higher half of the values from the lower half of the values. Simply put, it is the middle value of a list of numbers. The interquartile range (IQR) describes the spread of the data. When rank-ordered data is divided into quartiles the first and the third quartile represents the value under which 25% and 75% of the data points fall respectively. As an example, a team may have a median injury severity of 32 days (IQR 7 to 40). This means that when the teams' injury severities are rank-ordered the mid-point or median of the injury severities is 32 days, with 25% of their injuries resulting in 7 or less days absent from training and matches and 25% of their injuries resulting in 40 days or more absent from training and matches.
NEW, SUBSEQUENT AND RECURRENT INJURIES:
In 2017, in The Currie Cup Premiership Division Competition, when a player sustained their first injury of the tournament, this was defined as a 'New Injury'. Any injury that the same player sustained after this initial injury was defined as a 'Subsequent Injury'.
Subsequent injuries were then further classified into one of four groups based on the OSICS classification diagnosis:
- Different site - Different type
- Different site - Same type
- Same site - Different type
- Same site - Same type
According to the Consensus Statement, any subsequent injury classified as 'Same site - Same type' was a 'Recurrent injury'.
INJURY SEVERITY:
The total severity of an injury is defined as "the number of days that have elapsed from the date of injury to the date of the player's return to full participation in team training and availability for match selection"[1]. Furthermore severity can be grouped into Slight (0-1 days lost), Minimal (2-3 days lost), Mild (4-7 days lost), Moderate (8-28 days lost), Severe (>28 days lost), Career ending and Non-fatal catastrophic [1].
The average severity represents the average number of days lost per injury when dividing the accumulated total number of days lost by the total number of injury events. For example, a team may have a total severity of 550 days absent, accumulated from 22 injuries. The average severity of the team's injuries would therefore be 550/22, which equals, on average 25 days absent per injury.
INJURY BURDEN:
Injury burden is a combination of injury rate and severity. It is the injury rate multiplied by the average severity (number of days lost due to injury) and is expressed as the number of days absent per 1000 player hours. For example, a team who has an injury rate of 75 injuries per 1000 player exposure hours, and an average severity of 38 days lost per injury will have an injury burden of 2850 days absent per 1000 player hours (75 x 38).
OPERATIONAL INJURY BURDEN:
The operational burden is the expected number of days lost per injury per team for every match played over the tournament or season. The measure is an extrapolation of injury rates and severities over a season, and includes the most severe injuries together with the least severe injuries in its estimation. For example, if a team has an operational injury burden of 2 days, it means that based on their injury rates and average severity, on average, 2 days absence can be expected from every match injury the team sustains.
META-ANALYSIS:
A meta-analysis is a study using statistical methods to combine multiple scientific studies with varying levels of evidence on the same topic to determine overall defining patterns and results from the combined data. As such, it represents the highest level of scientific evidence available. The findings in this report are compared to that of the most recent meta-analysis for rugby union injuries at a senior professional level [2].
Key Findings
Injured players
Over the course of The Currie Cup 2017, 124 players sustained a total of 181 Medical Attention injuries. This means that of 154 players exposed to playing rugby in the tournament (7 teams x 22 player match-day squad), 81% sustained an injury at some point.
Unfortunately, the data provided by the ORC Griquas was incomplete and thus any missing information has been excluded from the analysis. Any analysis pertaining to Medical Attention injuries includes ORC Griquas data, but analysis specific to Time-Loss injuries excludes the incomplete ORC Griquas data and is conducted on the other six teams competing in The Currie Cup 2017 tournament.
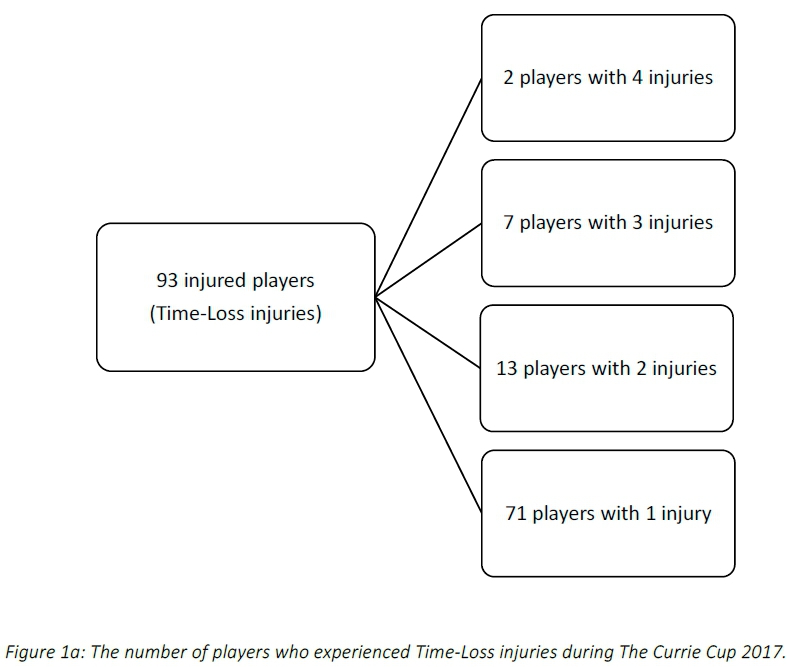
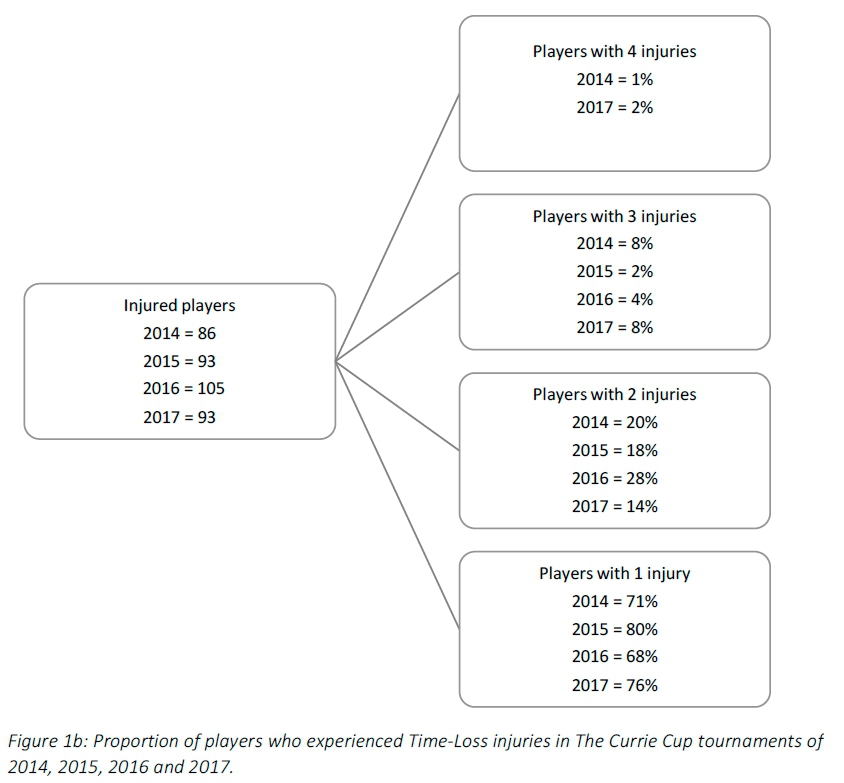
Across the 6 teams with complete data, there were 126 Time-Loss injuries and these were sustained by 93 players. This means that 70% of the exposed 132 players sustained a Time-Loss injury at some point during the tournament (Figure 1a). The proportion of players who experienced one Time-Loss injury has increased from 2016 to 2017, while the proportion of players who experienced more than one injury has decreased from 2016 to 2017 (Figure 1b). Further analyses will focus on absolute injury numbers, regardless of the number of players who sustained them.
Overall injury rate
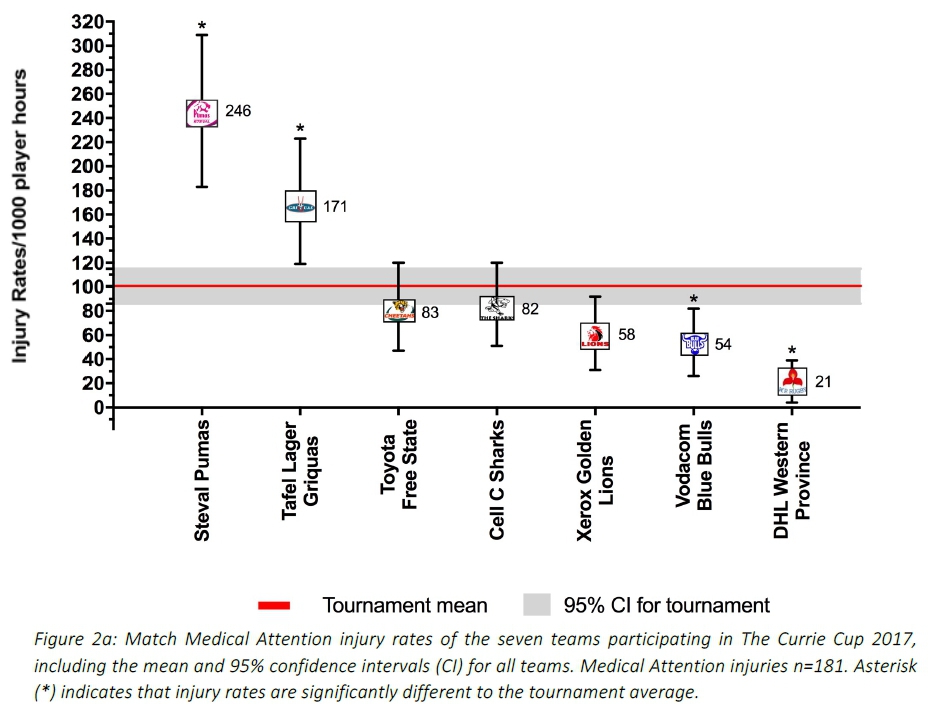
Overall, the match injury rate for all Medical Attention injuries in 2017 for The Currie Cup was 101 (86 to 115) per 1000 player exposure hours. This equates to 2 Medical Attention injuries per team per match.
When comparing teams' overall injury rates, the Vodacom Blue Bulls and DHL Western Province had rates that were significantly lower than the tournament average. The Steval Pumas and Tafel Lager Griquas had injury rates which were significantly greater than the injury rates of the other five competing teams and the tournament average (Figure 2a).
Only the number of Time-Loss injuries, those which resulted in the player missing more than one training session/match, will be considered for further analyses, based on the fact that these injuries are more comparable between different teams, tournaments and international literature [1].
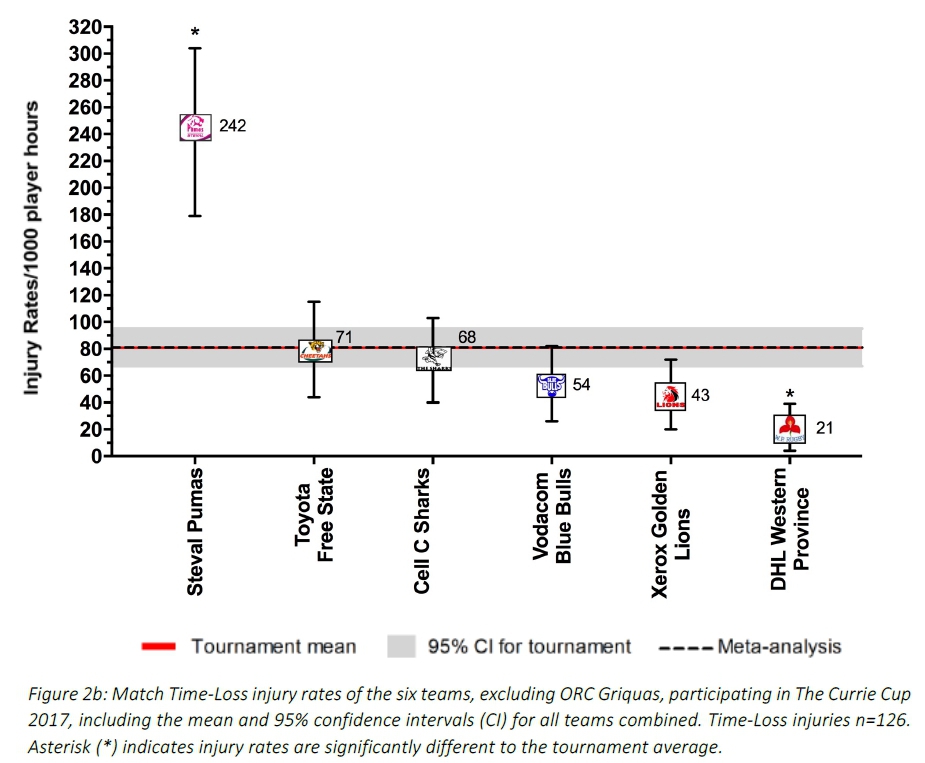
When only considering Time-Loss injuries for The Currie Cup 2017, the match injury rate for all teams was 81 (67 to 95) injuries per 1000 player hours. This is almost identical to the rate of the meta-analysis (81 injuries per 1000 player hours, 63 to 105)[2]. An injury rate of 81 injuries per 1000 player hours equates to 1 injury per team per match.
Despite playing the most matches, DHL Western Province had the lowest injury rate. The Cell C Sharks, who also competed in the final, had the fourth lowest injury rate for the tournament. The Steval Pumas had the highest injury rate for Time-Loss injuries, and this was significantly greater than the injury rate of all other competing teams, the tournament and meta-analysis injury rates [2]. The Toyota Free State Cheetahs and Cell C Sharks had an injury rate similar to that of the tournament average and meta-analysis (Figure 2b).
The average severity of match injuries for The Currie Cup 2017 was 37 days, which is higher than the average severity for match injuries of 32 days reported in the England Professional Rugby Injury Surveillance Project, March 2017 report [4]. The median severity of all Time-Loss injuries was 13 days (IQR 7 to 38). This means that the half-way mark of the injury severities was 13 days, with 25 of all Time-Loss injuries lasting for 7 days or less and 25 lasting for longer than 38 days.
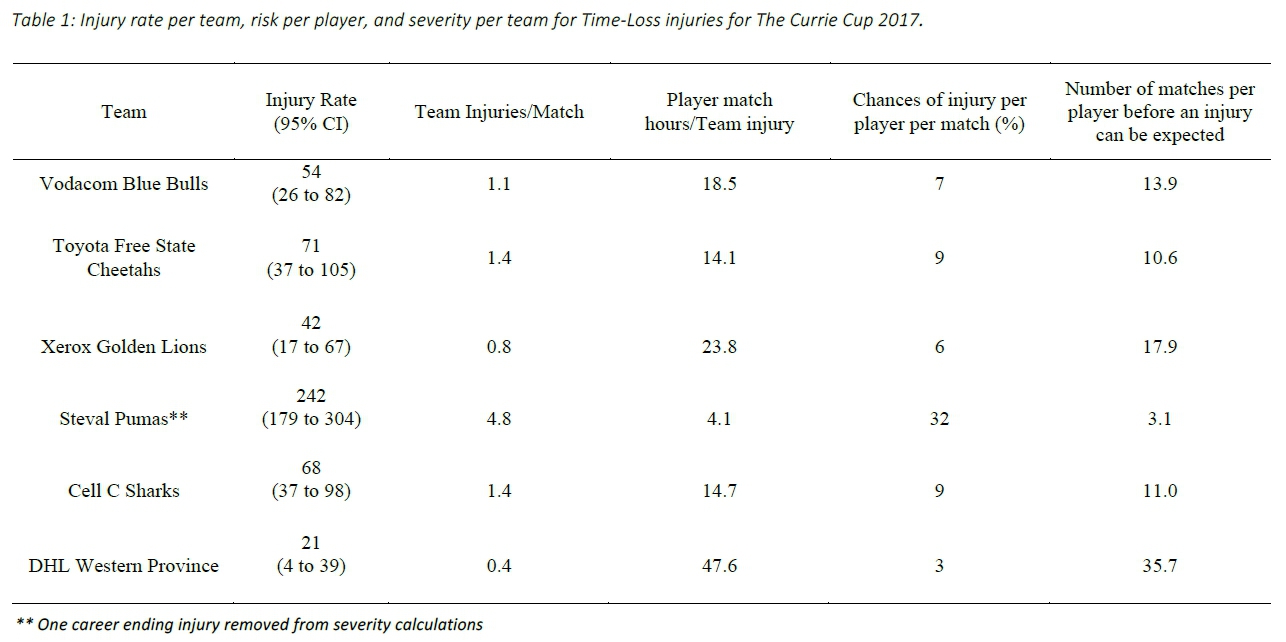
Table 1 displays the injury rates of Time-Loss injuries of each team (depicted in Figure 2b), as a number of incidents per match and per player. The Vodacom Blue Bulls have been used as a worked example to explain the table. The Vodacom Blue Bulls had an injury rate of 54 injuries per 1000 player hours, which equates to 1.1 injuries per match. Another way to describe this is, for every 18.5 player match hours the Vodacom Blue Bulls sustained one match injury. At the start of each match if all players had an equal chance of injury, each player in the Vodacom Blue Bulls team would have a 7% chance of injury for each match played. With a 7% chance of injury at each match, a player in the Vodacom Blue Bulls team can expect to be injured once in every 13.9 matches played (Table 1). The information in this table will be unfolded in the subsequent graphs.
When comparing the teams Time-Loss injuries for The Currie Cup 2014, 2015, 2016 and 2017 tournaments (Figure 2c), the Toyota Free State Cheetahs and Cell C Sharks injury rate has remained fairly consistent from 2015 - 2017. DHL Western Province experienced a significant decrease in injury rate in 2017, while the Steval Pumas experienced a significant increase in injury rate from 2016 to 2017.
It is interesting to note that the mean and 95% CI for all teams for all three years, 82 (74 to 89) per 1000 player hours is very similar to that of the meta-analysis[2], 81 ( 63 to 105) per 1000 player hours.
Average Time-Loss Injury rates per Month of the Tournament
In 2017 the structure of The Currie Cup tournament changed such that it took place over a four month period (July - October), this is different to the three month structure in previous years. Nevertheless, the same trend was seen in 2017 as in 2016 with the injury rate decreasing over the course of the tournament. The injury rates in July, August and September of 2017 was significantly higher than the tournament average of all years combined (Figure 3).
New, Subsequent and Recurrent Injuries
Overall, the injury rate for New Time-Loss injuries for The Currie Cup 2017 was 78 (64 to 92) per 1000 player hours, which is similar to that of the meta-analysis[2] with a rate of 78 (74 to 83) per 1000 player hours. The average severity for New Injuries for The Currie Cup 2017 was 36 (26 to 46) days, which is significantly higher than the average severity reported in the meta-analysis[2] of 20 (15 to 24) days.
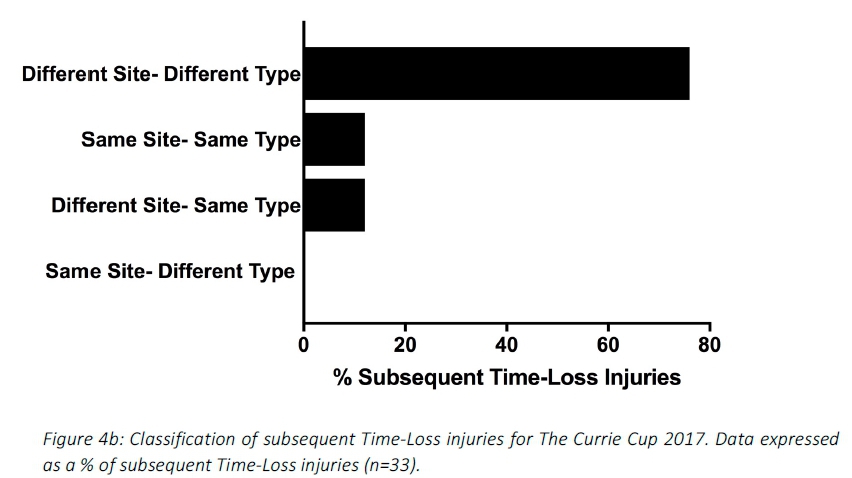
There were 22 players who sustained more than one injury in The Currie Cup 2017. The majority (88%) of the subsequent Time-Loss injuries were at a different site and of a different type to the first injury (Figure 4a & 4b). Keep in mind that of the 126 injuries in 2017, 22 players (17% of the player pool of 6 teams counted, excluding ORC Griquas) contributed to 55 or 43% of all of the 2017 Tournament's injuries.
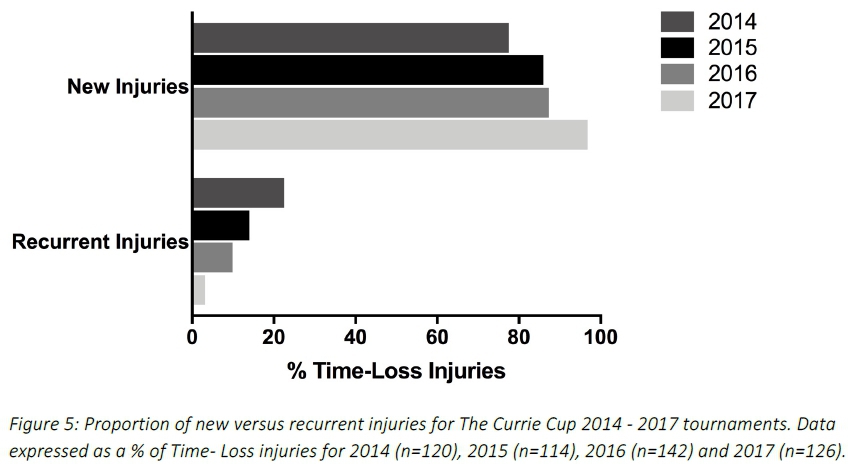
A recurrent injury was any subsequent injury classified as 'same site-same type'. There were only four recurrent injuries in The Currie Cup 2017. The overall injury rate for recurrent Time-Loss injuries was 3 (1 to 5) per 1000 player hours, which is significantly lower than the meta-analysis rate of 11 (10 to 12) injuries per 1000 player hours[2]. The severity of the four recurrent injuries in 2017 was 4, 14, 40 and 152 days lost respectively.
When comparing the new and recurrent injuries across The Currie Cup 2014, 2015, 2016 and 2017 tournaments, there was a decrease in the proportion of recurrent injuries over the four years (Figure 5). This finding must be interpreted with caution as in 2014 and 2015 the classification of a recurrent injury was made by the doctor, thus the definition of a recurrent injury was open to interpretation by the doctor. In 2016 and 2017 however, an injury was classified as a recurrent injury based on the OSICS classification diagnosis.
Injury Severity
For each year, at the time of injury the Team Medical doctors were asked to estimate the severity of the injury based on their clinical assessment of the injured player. A 'Minimal' injury refers to 2-3 days (and includes 'Slight' injuries of 0-1 days - see subsequent paragraph), 'Mild' is 4-7 days, 'Moderate' is 8-28 days and 'Severe' is >28 days off rugby training and/or match play.
The doctors estimated some Time-Loss injuries as having Slight severity. However, according to the consensus statement definition most Slight injuries are by definition 'Medical Attention'. Therefore, the Slight injuries that met the Time-loss definition, were recorded as 'Time-Loss' by the team doctors and were then added into the higher severity category of Minimal for the purpose of this analysis [1].
Figure 6 compares the estimated injury severity of The Currie Cup 2014, 2015, 2016 and 2017 tournaments. There were no significant differences in the estimated injury severity between the four years (Figure 6).
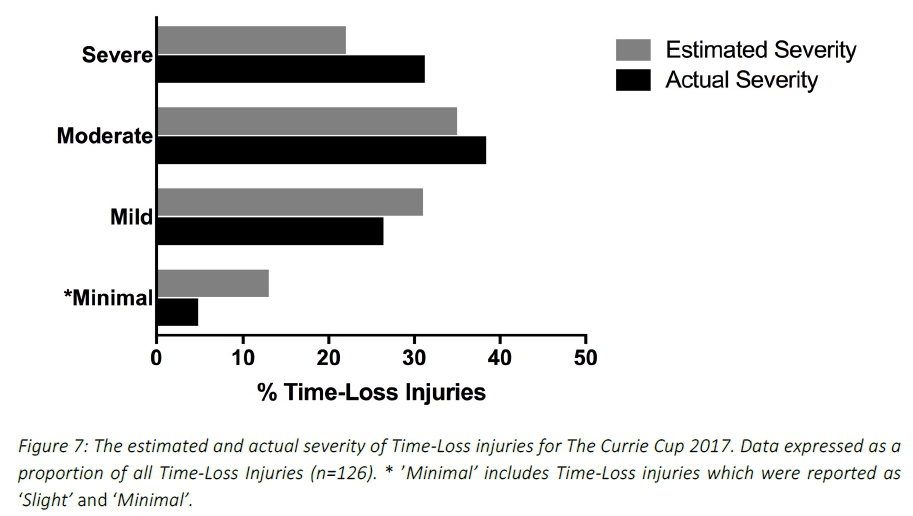
Since The Currie Cup 2016, doctors were asked to record the physical return to play date of the player following the injury, which allowed for the actual injury severity to be calculated. Figure 7 compares the estimated severity recorded by the doctor at the time of injury and the actual injury severity determined once the injured player had returned from injury. In The Currie Cup 2017, doctors over-estimated the number of 'Minimal', 'Mild' and under-estimated the number of 'Moderate' and 'Severe' injuries. Doctors estimated 22% of all Time-Loss injuries to be 'Severe', however when calculating severity from the real time data, the findings revealed that 31% of all Time-Loss injuries were actually 'Severe'.
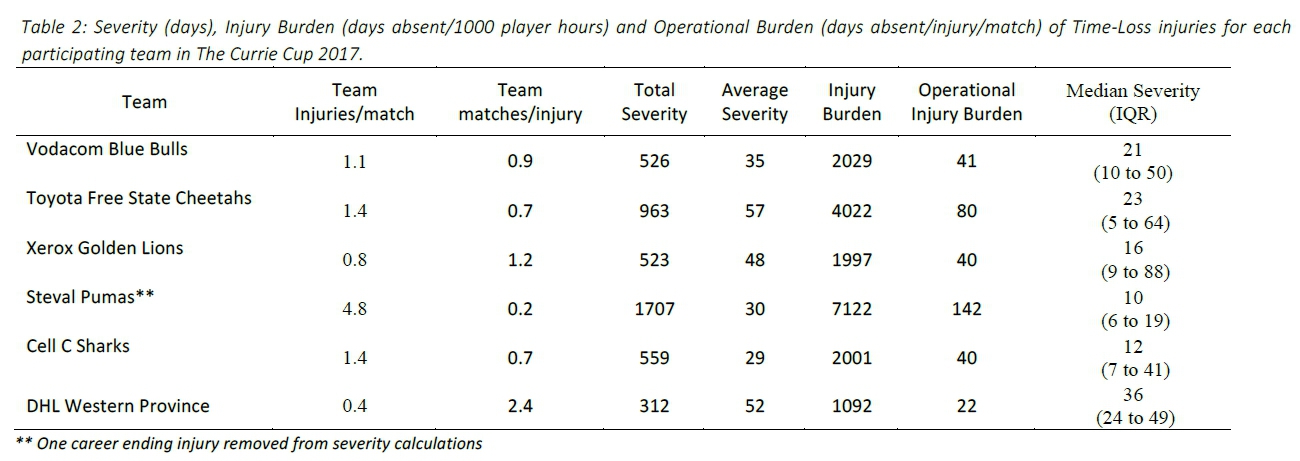
Table 2 describes the actual severity of each teams' Time-Loss injuries for The Currie Cup 2017. The Vodacom Blue Bulls have again been used as a worked example to explain the table. The Vodacom Blue Bulls sustained 1.1 injuries per match, meaning that for every 0.9 matches played they sustained one injury. In total, the Vodacom Blue Bulls lost 526 training and match days due to injury. This equates to an average of 35 training and match days lost for every injury sustained. The burden of the team's injuries equates to 2019 days lost per 1000 player hours. Translating this to an operational burden per match, it shows that the Vodacom Blue Bulls lost 41 days per injury per match over the season. The median injury severity for the Vodacom Blue Bulls was 21 days (IQR 10 to 50). This means that when severities of the Vodacom Blue Bulls Time-Loss injuries were rank-ordered the midpoint of the severities was 21 days off from rugby, with 25% of their injuries lasting equal to or less than 10 days off and 25 of their injuries lasting equal to or longer than 50 days off (Table 2).
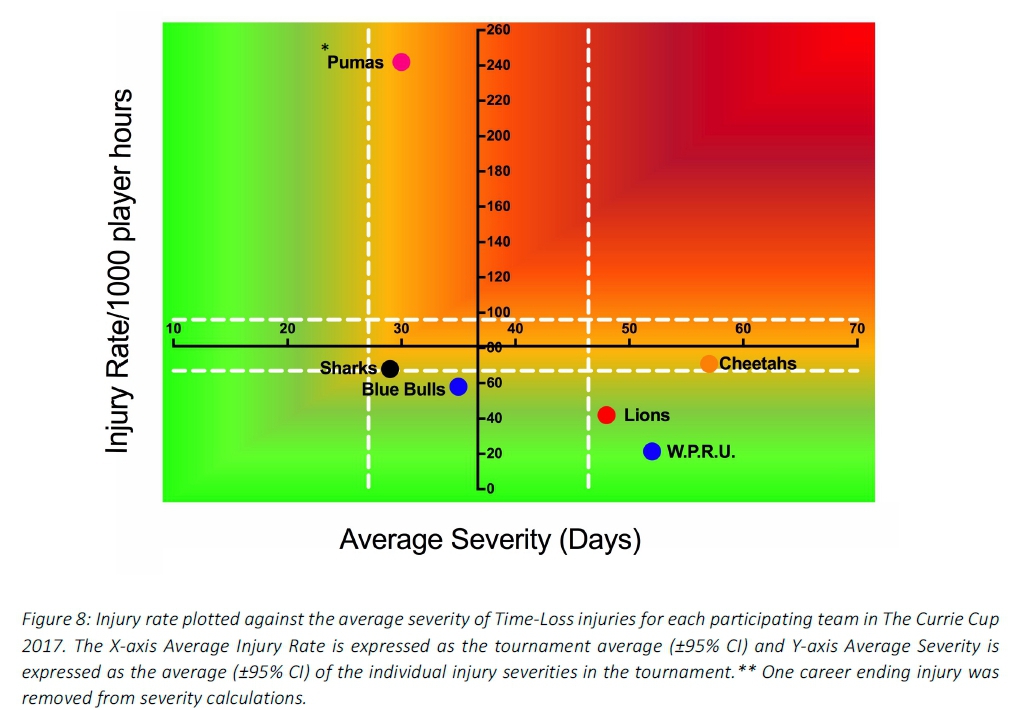
The Steval Pumas had the highest rate of Time-Loss injuries, but these were of low severity. Conversely the Xerox Golden Lions and DHL Western Province had a low injury rate, but their injuries were of high severity (Figure 8). Teams who fall in the green zone, will generally not be impacted as much by their injury burden, regardless of whether their injury rate or average severity is relatively high. As soon as the combination of rate and severity moves into the orange and/or red zone, the impact on team performance and player availability becomes more problematic.
Injury Type
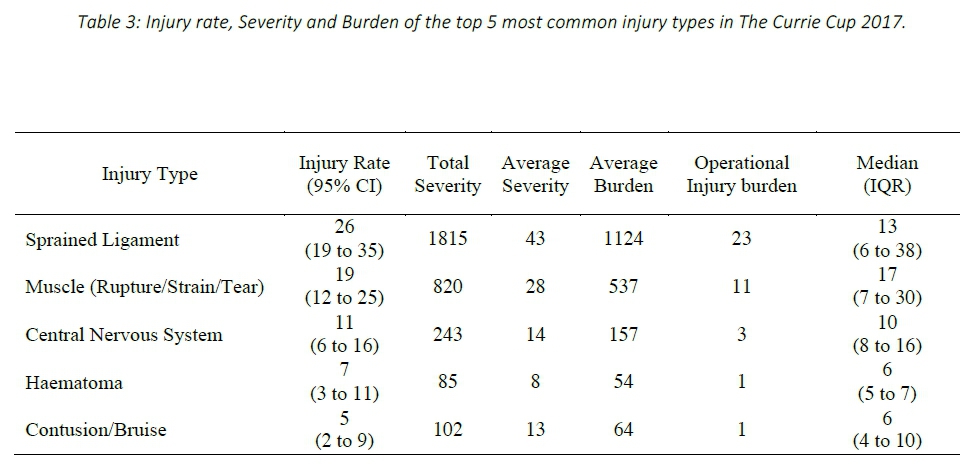
Sprained ligaments (33%, n=42) were the most common Time-Loss injuries recorded in The Currie Cup 2017, with muscle injuries (rupture/strain/tear) comprising the second highest proportion (23%, n=29). Sprained ligaments had an injury burden of 1124 days absent/1000 player hours, which equates to an operational injury burden of 23 days lost per sprained ligament injury per match over the season. The median severity for sprained ligament injuries was 13 days with 25% of sprained ligament injuries resulting in 6 or less days absent from training and matches, and 25% of injuries resulting in 38 or more days absent from training and matches (Table 3).
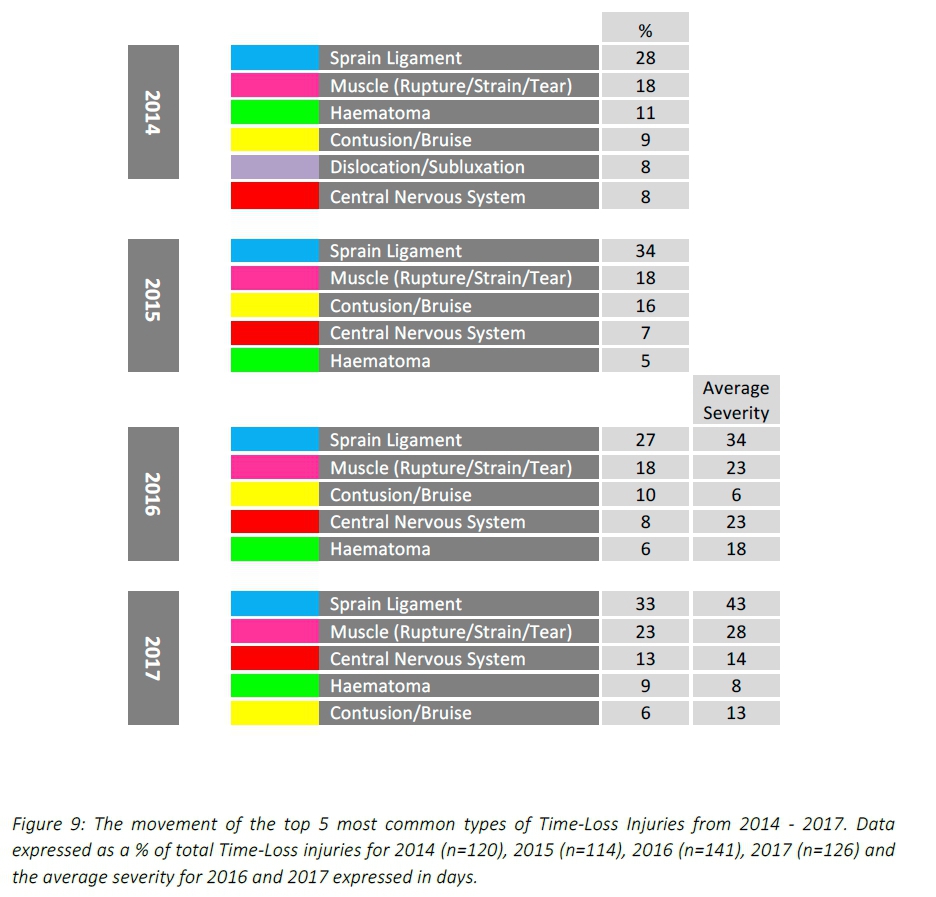
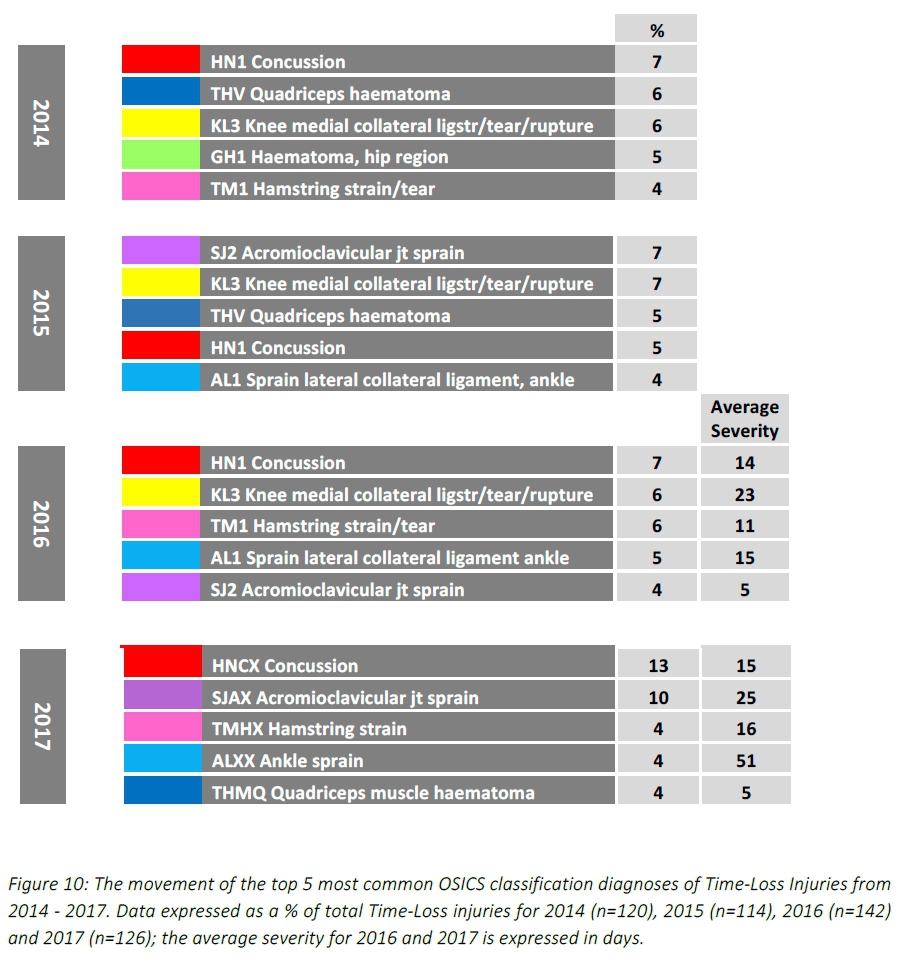
When looking at the top five most common injury types over the three years, sprained ligaments and muscle injuries remained the first and second most common injury types in all four years (Figure 9). Ligament sprains most frequently occurred to the ankle in 2014 and 2016, while in 2015 and 2017 the knee was subject to the most ligament sprains. In 2014, 2015, 2016 and 2017 muscle injuries occurred most frequently to the posterior thigh.
For further comparison, The Currie Cup 2017 Time-Loss injury types were grouped in a similar way to the international meta-analysis[2]. With these groupings, aligned to the meta-analysis, the two most common Time-Loss injury types in The Currie Cup 2017 were muscle/tendon injuries and joint (non-bone)/ligament injuries.
The injury rate of 11 (6 to 16) per 1000 player hours for the central nervous system during The Currie Cup 2017, was similar to the rate of "central/peripheral" system injuries of the meta-analysis, 8 (4 to 15) per 1000 player hours[2].
The injury rate for muscle/tendon injuries (comprised of muscle rupture/strain/tear, tendon injury/rupture and tendinopathy) was 20 (13 to 27) per 1000 player hours. This was lower than the same type of injury grouping in the meta-analysis, which had a rate of 40 (21 to 76) per 1000 player hours, albeit not significant[2]. The average severity for muscle/tendon injuries of 27 (14 to 41) days, in The Currie Cup 2017 was higher than the average severity of 15 (5 to 24) days reported in the meta-analysis[2], but this was not significantly different.
In contrast, joint (non-bone)/ligament injuries (comprised of dislocation/subluxation and sprain/ligament) were comparable: 27 (19 to 35) per 1000 player hours in the present study, compared to the 24 (18 to 65) per 1000 player hours in the meta-analysis[2]. The average severity of joint/ligament injuries in The Currie Cup 2017 was 43 (22 to 64) days, which is again higher, but not significantly different, to the average severity for the same types of injuries reported at 29 (19 to 39) days in the meta-analysis[2].
It appears that while the injury rates of these grouped injury types for The Currie Cup 2017 were similar to the injury rates reported in the meta-analysis, the average severity of The Currie Cup injuries was higher, although again, this was not significantly different.
Injury Diagnosis
The most frequent OSICS classification diagnosis in The Currie Cup 2017 was HNCX Concussion. Concussions were also the most frequently diagnosed injury in the 2014 and 2016 tournaments (Figure 10).
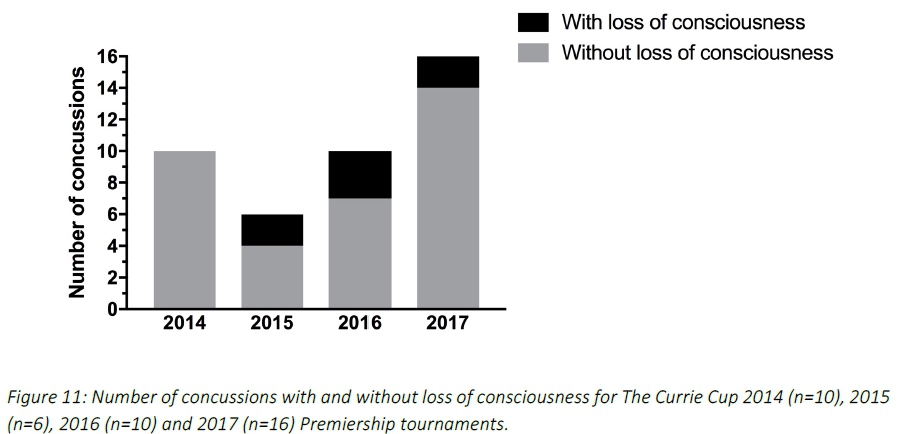
Concussions
Concussions made up 13% (n=16) of all Time-Loss injuries for The Currie Cup 2017. Of these 16 concussions, only 2 were recorded with a loss of consciousness. The average severity of concussions reported in the 2017 tournament was 15 days (Range 4 - 44 days), which is slightly lower than the average severity of 18 days reported for concussion in the England Professional Rugby Injury Surveillance Project, March 2017 report[4]. When looking at the ranking of concussions in comparison to other injury diagnoses, concussion was the most frequently diagnosed injury in 2014, 2016 and 2017 tournaments (Figure 11).
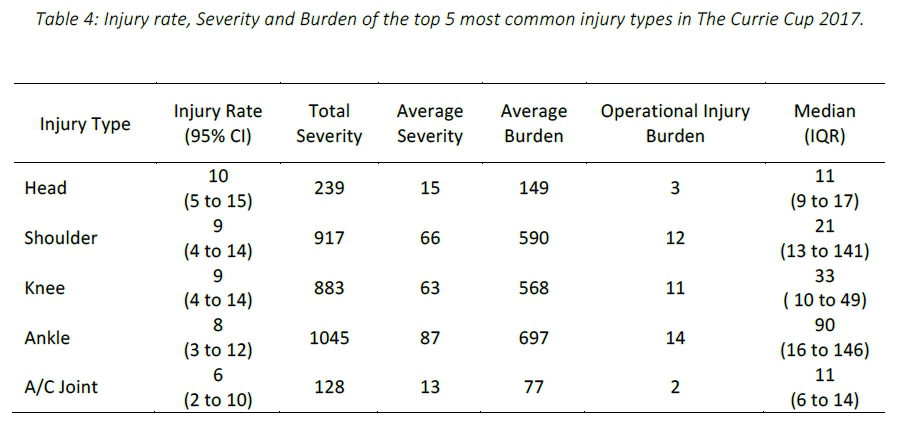
Region of Injury
The most frequently injured body location of all Time-Loss injuries during The Currie Cup 2017 was the Head (13%, n=16), followed by the Shoulder (11%, n=14) and Knee (11%, n=14). The average burden of head injuries in 2017 was 149 days absent per 1000 player hours. This translates to an operational burden of 3 days lost per head injury per match over the entire season. The median severity of head injuries in 2017 was 11 days absent, with 25% of head injuries resulting in 9 or less days lost from training and matches and 25% of all head injuries resulting in 17 or more days lost from training and matches (Table 4).
When looking at the movement of the top five most common body locations of Time-Loss injuries for The Currie Cup 2014, 2015, 2016 and 2017 tournaments this is the first year that neither the knee or ankle have been the first or second most commonly injured body locations (Figure 12). It is worth noting that there has been a gradual increase in the proportion of injuries to the shoulder over the past three years, with injuries to the shoulder making up 6% of all Time-Loss injuries in 2014 and increasing to be the second most commonly injured body location in 2017 (11%). It is also worth keeping in mind that shoulder injuries have a relatively high average severity of 71 days lost per injury, which has increased from the average severity of 59 days in 2016.
When looking into injuries to the shoulder in more detail, 13 of the 14 injuries occurred during the tackle. Of these 13 injuries, 10 occurred to the tackler (i.e. performing the tackle), with 4 of the 10 occurring when tackling front-on.
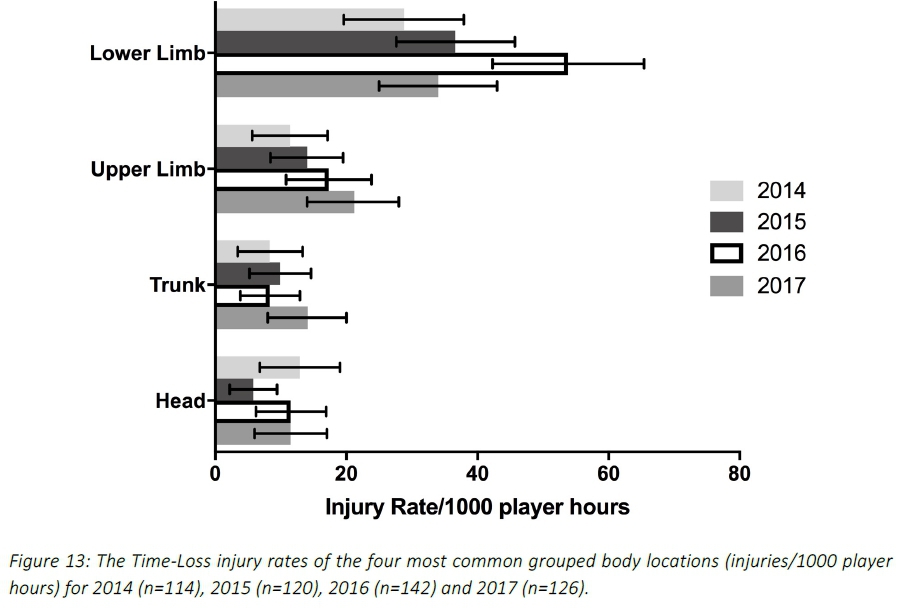
When anatomical body locations were grouped for comparison with the meta-analysis[2], the lower limb (knee to ankle) had the highest injury rate for The Currie Cup 2017. In 2017, the injury rate to the lower limb of 34 (25 to 43) per 1000 player hours was lower, but not significantly different from the meta-analysis[2] at 47 (28-46) per 1000 player hours. The injury rate to the lower limb has decreased from 2016 to 2017. The lower limb also had the highest average severity of 49 days, followed by the upper limb at 41 days lost. (Figure 13).
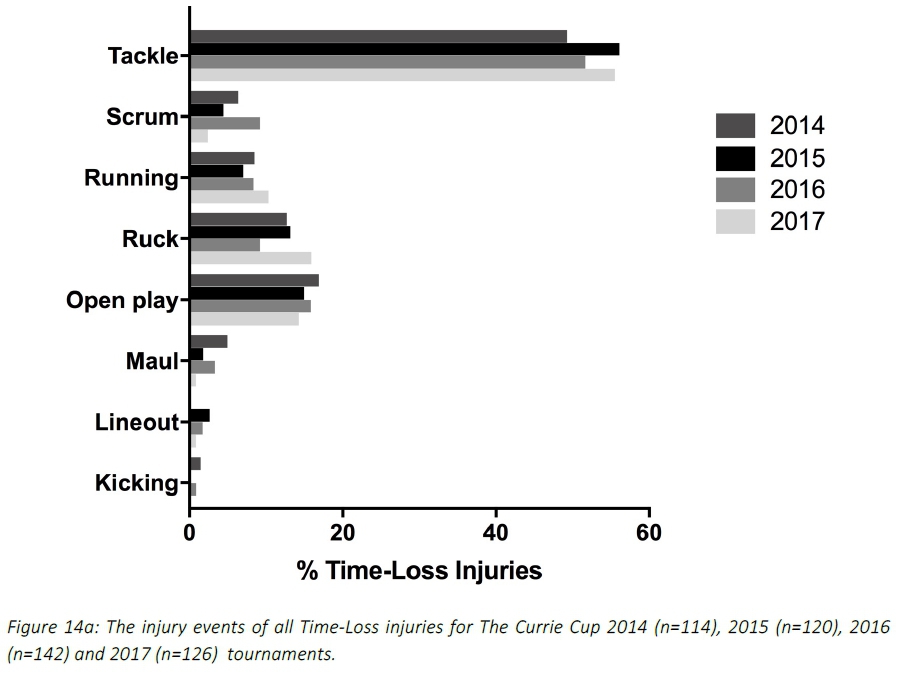
Injury Event
In The Currie Cup 2017, tackling (i.e. performing the tackle) accounted for the highest proportion (29%, n=36) of injury events. Tackling in the 2017 tournament had an injury rate of 23 (16 to 31) injuries per 1000 player hours. This is comparable to the meta-analysis[2] injury rates of 19 (12 to 29). Being tackled (i.e. to the ball carrier) had an injury rate of 22 (14 to 29) per 1000 player hours, which is also comparable to the injury rate for ball carries in the meta-analysis 29 (19 to 46) per 1000 player hours. In 2016 the trend was opposite of that found in 2017 and to the meta-analysis where in 2016 being tackled (i.e. to the ball carrier accounted for more injuries than performing the tackle (i.e. tackling).
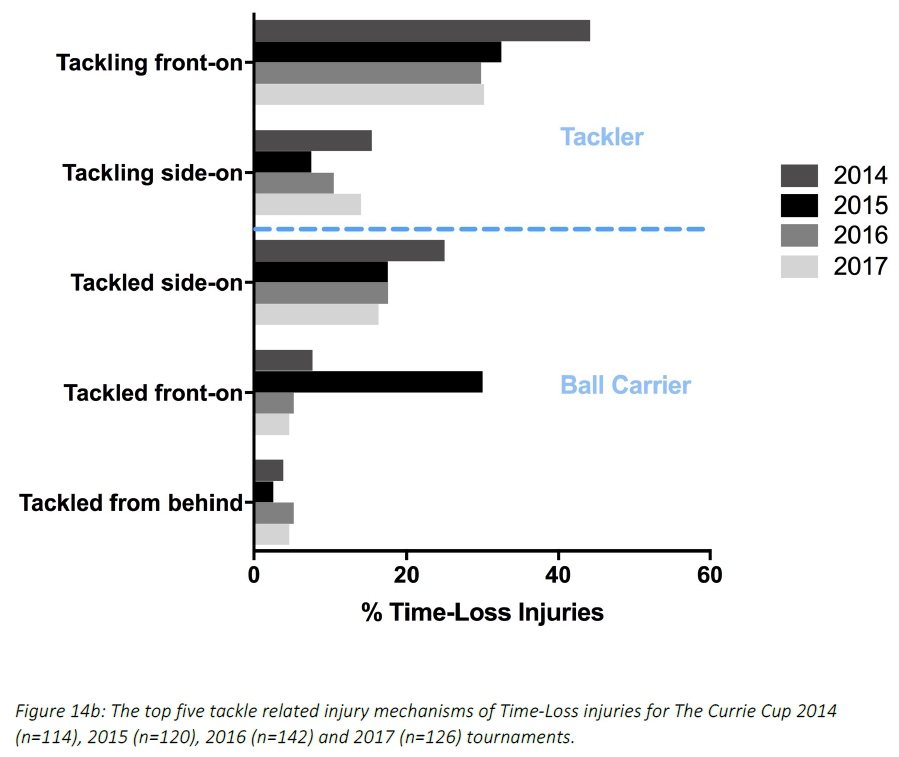
In The Currie Cup 2014, 2015, 2016 and 2017 tournaments, the tackle phase accounted for the highest proportion of all injury events (Figure 14a). When exploring this further and assessing the mechanism of tackle related injuries, tackling front-on accounted for the highest proportion of tackling related injuries in 2014 (44%, n=23), 2015 (33%, n=13), 2016 (30%, n=17) and 2017 (30%, n=13) (Figure 14b).
Position of Injured Players
In The Currie Cup 2017, forwards had a Time-Loss injury rate of 87 (67 to 107) per 1000 player hours, while for the backs it was 74 (54 to 93) per 1000 player hours. When comparing these rates with the meta-analysis[2], the 2017 rate for forwards was comparable with the meta-analysis, while the rate for the backs was almost significantly lower than the 99 (92 to 106) per 1000 player hours reported in the meta-analysis.
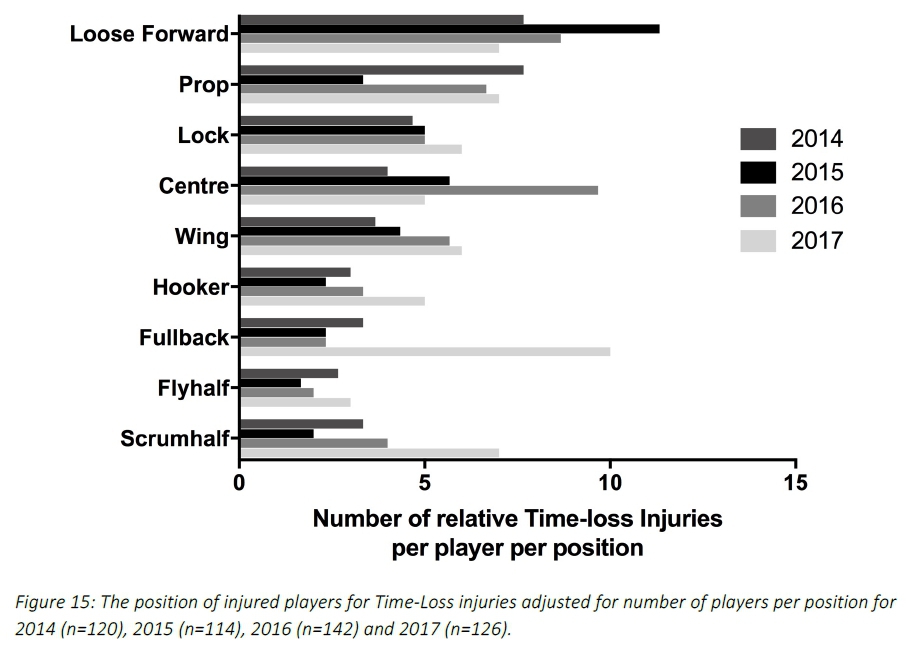
When divided into specific positional groupings within forwards and backs, the number of injuries were normalised relative to the number of players on the field per position per team (e.g. 2 Props = total injuries divided by 2; 3 Loose Forwards = total injuries divided by 3). As such, the loose forwards had the highest relative number of recorded injuries per position in 2014 and 2015, the centre in 2016 and the fullback in 2017 (Figure 15). However, with the relatively low numbers, it is difficult to draw any firm conclusions.
Protective Gear and Injury
The majority (54%) of all players who sustained a Time-Loss injury in The Currie Cup 2017 were wearing a mouth guard. Of the 16 concussions, nine of them occurred with the player wearing a mouth guard. In 2014 and 2015 most of the injured players were not wearing any form of protective gear (2014 = 49%, 2015 = 52%), while in 2016 the majority of the injured players were wearing strapping (47%) (Figure 16). At The Currie Cup 2017 30% of players who sustained an injury were wearing strapping and 30% of these injuries occurred to the body location which was strapped. An alternate way to look at this is that 70% of players who were strapped encountered an injury to a non-strapped site.
In The Currie Cup 2017, 42% of ankle injuries occurred to ankles which were strapped and 21% of shoulder injuries occurred to strapped shoulders.
Venue
Matches were played at seven stadia during the tournament. For The Currie Cup 2017, Loftus Versfeld Stadium, Pretoria had the lowest injury rate. Mbombela Stadium, Nelspruit had the highest injury rate. In 2017 the injury rate at Mbombela Stadium, Mpumalanga was significantly higher and Loftus Versfeld Stadium, Pretoria and Griqua Park, Kimberly were significantly lower than the combined average injury rate.
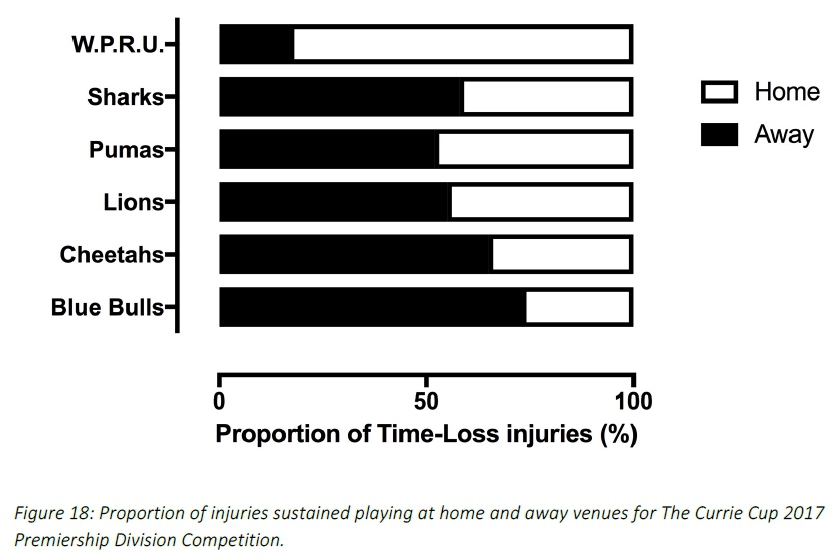
Across all teams, playing at home (36 [26 to 45] per 1000 player hours) had a lower, although not significant, injury rate than playing away (45 [34 to 55] per 1000 player hours) in The Currie Cup 2017 tournament. Only DHL Western Province sustained more injuries when playing at home (83%), all other teams sustained more injuries when playing away (Figure 18).
Summary
The injury rate of Time-Loss injuries for The Currie Cup 2017 was 81 (67 to 95) injuries per 1000 player hours, which is almost identical to the rate of the meta-analysis, 81 (63 to 105) injuries per 1000 player hours[2], and equates to 1 injury per team per match. The average severity of Time-Loss injuries was 37 days lost, and the median severity was 13 days (IQR 7 to 38). The mean and 95% CI Time-Loss injury rates for all teams combined for the 2014, 2015, 2016 and 2017 tournaments [82 (74 to 89) per 1000 player hours] is very similar to that of the meta-analysis [81 (63 to 105) per 1000 player hours].
Most of the data in The Currie Cup 2017 Premiership Division Competition were similar to the data shown in the meta-analysis by Williams et al.[2] illustrating a similarity with international trends. The injury rate of recurrent Time-Loss injuries in The Currie Cup 2017 Premiership Division Competition was significantly lower than that of the meta-analysis. An interesting point to reflect upon is the following. Of the 126 Time-loss injuries in 2017, 22 players (17% of the player pool of 6 teams counted, excluding ORC Griquas) contributed to 55 or 43% of all of the 2017 Tournament's injuries. The potential impact of this finding needs further interrogation and introspection within the Unions to ascertain why certain players are more prone to injury and/or re-injury than others.
Despite having the highest Time-Loss injury rate the Steval Pumas has the second lowest average injury severity. The Steval Pumas median severity was 10 days with 25% of their injuries lasting 6 days or less and only 25% of their injuries lasting longer than 19 days. This means that they had a high number of injuries but that the severity of their injuries was low resulting in them not losing many training and match days for each injury. In contrast, DHL Western Province had the lowest Time-Loss injury rate, but the second highest average injury severity. They had a median injury severity of 36 days with 25% of their injuries lasting less than 24 days and 25% of their injuries lasting longer than 49 days. This means that even though DHL Western Province had a low number of injuries, a large number of training and match days were lost due to those injuries. It is important to note that the return to play date of an injured player will, to an extent, be influenced by the rehabilitation approach taken by the team. Teams who take a more conservative approach to the rehabilitation of injuries will reflect an increased total injury severity.
When comparing tournament years, only the Steval Pumas experienced a significant increase in injury rates in 2017 compared to 2015 and 2016. DHL Western Province experienced a decrease in injury rates from 2016 and a decrease, which is significant in comparison to their previous injury rates. These results highlight the importance of collecting severity data, and not simply injury rates on their own, as although teams may have a low injury rate, injuries of a high severity still represent a burden to the team resulting in a large number of training and match days lost to injury.
There was one career ending injury in The Currie Cup 2017 Premiership Division Competition. Due to the nature of this injury and the large inaccuracies in determining severity, this injury was removed from further severity analysis. It must however, be acknowledged, that removing an injury of such a nature has a substantial knock-on effect on the injury severity calculations, and the interpretation of the involved data must be performed with this in mind.
A study from the English Premiership rugby competition showed that Time-Loss injuries hamper team performance [3]. Teams with better injury profiles (lower injury burdens) performed better in the tournament, over a seven-year period. It is interesting to note in 2017 DHL Western Province, who finished top of the log had the lowest injury rate. This is the fourth consecutive year that this trend has been seen (including unpublished 2014, 2015 and 2016 Currie Cup reports).
Arguably, the most interesting finding in The Currie Cup 2017 report was the consistent increase in the proportion of injuries to the shoulder over the four years, with the shoulder being the second most commonly injured body location in 2017. Almost all of the injuries to the shoulder occurred when performing the tackle (i.e. to the tackler). Given that shoulder injuries have a high severity, it is important to attempt to reduce the incidence of these injuries. It is recommended that teams who sustained shoulder injuries revisit the video footage of these injuries to identify if alterations to the tackle technique could have prevented these injuries, or potentially could in future.
An inherit limitation in this type of study is that the data collection process is entirely dependent on the doctor declaring all medical injuries. The aim of these reports is to describe the injury profile of The Currie Cup Premiership Division competition and subsequently develop strategies to reduce the number of injuries in the tournament. This can only be maximally beneficial if complete and accurate data is collected by all teams involved in the tournament.
References
1. Fuller, C., et al., Concensus statement on injury definitions and data collection procedures for studies of injuries in rugby union, British Journal of Sports Medicine. 2007. p. 328-331. [ Links ]
2. Williams, S., et al., A meta-analysis of injuries in senior men's professional Rugby Union. Sports Medicine, 2013. 43(10): p. 1043-55. [ Links ]
3. Williams, S., et al., Time loss injuries compromise team success in Elite Rugby Union: a 7-year prospective study. British Journal of Sports Medicine. Online first 9 November 2015. [ Links ]
4. Cross M. England Professional Rugby Injury Surveillance Project: 2016/7. Rugby Football Union (RFU).Mar2018:1-44 [ Links ]

