


Services on Demand
Article
 English (pdf)
 Article in xml format
 Article references
Indicators

Related links
-
 Cited by Google
 -
 Similars in Google
Share

 Permalink
South African Journal of Sports Medicine
On-line version ISSN 2078-516X
Print version ISSN 1015-5163
SA J. Sports Med. vol.30 n.1 Bloemfontein 2018
http://dx.doi.org/10.17159/2078-516x/2018/v30i1a5066
ORIGINAL RESEARCH
The association between being overweight/obese and blood pressure in rural South African women living in the Tshino Nesengani (Mukondeleli) village
P J-L GradidgeI; M PhaswanaI; E CohenII
IPhD; Centre for Exercise Science and Sports Medicine, Faculty of Health Sciences, University of the Witwatersrand, Johannesburg, South Africa
IIBSc (Hons); Centre for Exercise Science and Sports Medicine, Faculty of Health Sciences, University of the Witwatersrand, Johannesburg, South Africa
IIIPhD; MRC/Wits Developmental Pathways for Health Research Unit, Department of Paediatrics, Faculty of Health Sciences, University of the Witwatersrand, Johannesburg, South Africa
ABSTRACT
BACKGROUND: The purpose of this cross-sectional study was to investigate whether bio-behavioural factors are associated with blood pressure and body composition in rural black South African women.
METHODS: Data were collected on 200 African women living in the Tshino Nesengani (Mukondeleli) village, Limpopo Province, using simple anthropometry, blood pressure, and self-reported questionnaires for sleep, physical activity, and sugar-sweetened beverage (SSB) consumption.
RESULTS: Six patterns of SSB consumption were determined by principal component analysis. Regression analysis showed that longer sleep duration patterns (>nine hours/night) was associated with lower systolic and diastolic blood pressure; whilst the principal components (beer, wine, and sweetened tea) were associated with a higher body mass index.
CONCLUSION: These findings highlight novel bio-behavioural contributors of blood pressure and body anthropometry in rural African women.
Keywords: African, BMI, waist circumference, sugar-sweetened beverages
The prevalence of both abdominal and whole body obesity is expected to increase dramatically in developing countries, such as South Africa, with recent data demonstrating that black South African women have the highest prevalence of obesity within sub-Saharan Africa.[1] South African women living in urban settings certainly have higher rates of obesity compared with men and rural women;[2] however, the prevalence of excess adiposity in women living in both settings is higher than the global averages.[1] A consequence is that the risk of associated cardiometabolic diseases, such as type 2 diabetes and hypertension, is high in African women.[3] The obesity crisis in South Africa is made more complex by the dynamic rural-urban shift, which may include an extension of the urbanisation concept into the rural setting as observed in other countries experiencing nutritional transition.[4] This phenomenon may explain the high prevalence of excess adiposity in both settings as learned obesogenic practices such as sedentariness and unhealthy eating may be adopted by rural communities.
Research indicates that the global consumption of sugar-sweetened beverages (SSB) has increased and is associated with weight gain, elevated blood pressure (BP) and other cardiometabolic diseases risk factors.[5] Despite black South African females having the highest prevalence of obesity in the sub-Saharan region, the results of the South African Demographic and Health Survey show that other population groups have higher tobacco and alcohol consumption patterns.[6] This suggests that there may be other environmental factors driving the high prevalence of obesity and cardiometabolic diseases in African women.
These other environmental factors have received far less attention than diet or physical activity. They include smoking and sleep behaviour. Smoking is well known as an independent risk factor for several cardiovascular diseases, while sleep duration has a negative association with BMI,[7] although the mechanisms underlying this effect are largely unknown. The aim of this study was therefore to determine whether other environmental factors (e.g. physical activity, sedentary behaviour, consumption of SSBs, smoking, smokeless tobacco consumption or 'snuff', and sleep duration) correlate independently or with the measurements of fat and BP in a cohort of rural African women.
Methods
Sample
This was a cross-sectional study of a convenience sample of rural black South African women living in the Tshino Nesengani (Mukondeleli) village, Limpopo Province, South Africa. Potential participants who were pregnant, aged <18 years, non-Black, and living outside of the village were excluded from the study. Ethical approval was granted by the Human Research Ethics Committee (Medical), University of the Witwatersrand (ethics certificate number: M170377), and all participants gave written consent. The questionnaires were administered to the participants and the details communicated in the participants' home language when necessary to ensure correct completion of the questionnaires.
Physical activity
The Global Physical Activity Questionnaire (GPAQ) was used to determine self-reported total moderate-vigorous physical activity (MVPA) and the estimated sitting time. The GPAQ is reliable and has been validated for use in Africa.[8] Active in the GPAQ was defined as taking part in: moderate physical activity for a total of 150 minutes per week (>five days per week); or vigorous physical activity for 60 minutes per week (>three days per week); or 600 metabolic minutes per week (>five days MVPA).[8] In addition, walking for travel purposes, as a domain of light physical activity, was determined using the GPAQ.
Beverage intake
The beverage intake questionnaire (BEVQ-15) is a 15-item, seven day recall on SSB used to measure the quantities and amounts of habitual beverage consumption.9 The BEVQ-15 includes 15 categorised beverage items to estimate total kilocalories (kcal) of consumed beverages: water, regular soft drinks, 100% fruit juice, juice drinks (other than fruit juice), full cream milk, low-fat milk, skim (fat-free) milk, sweetened tea, coffee or tea with milk and sugar, black coffee or tea without sugar, light beer, regular beer, mixed alcoholic drinks, wine (red or white), meal replacement drinks and energy drinks. The total of SSB calorie consumption is calculated from the estimated energy consumption for each item. Participants were asked to recall the amount and frequency of each item.
Sleep patterns
The Pittsburgh Sleep Questionnaire Index (PSQI) was used to determine the overall quality of sleep.[10] The PSQI is a self-reported questionnaire consisting of seven components of sleep that evaluate sleeping duration, sleep disturbance, sleep latency, habitual sleep efficiency, daytime dysfunction, use of sleeping medicine, and sleeping quality. The total score ranging from 0-21 is summed from these items. A total score >five indicates poor sleep quality for the global PSQI index, and a score of ≤five indicates good sleep quality.
Socioeconomic status and education
Household asset ownership was used as a proxy measure of socioeconomic status (SES).[11] The questionnaire included eleven household items, ranked in order of value from lowest to highest: (1) radio, (2) computer/laptop, (3) refrigerator, (4) washing machine, (5) television (TV), (6) telephone/landline, (7) cell phone/mobile, (8) internet, (9), electricity, (10) digital satellite TV, and motor vehicle. The score of these commodities was summed to give a total SES index ranging from 0 to 66. Tertiles of SES score were created for further analysis: low (SES score: <29), moderate (SES score: 29-36), and high SES (SES score ≥36) categories. The levels of education were captured as follows: 0 for no schooling, 1 for primary school, 2 for incomplete high school, and 3 for completion of high school. Participants were also queried on their employment status.
Anthropometry
All measurements were performed with participants in light clothing and without shoes. Body weight was measured using an electronic digital weighing scale to the nearest 0.1 kg (Seca, USA). Height was measured to the nearest 0.1 cm using a stadiometer (Seca, USA). Body mass index (BMI) was calculated as weight (kg)/height (m2). Waist and hip circumferences were measured using a spring tape to the nearest cm. Waist circumference was measured between the lowest ribs and the iliac crest, and hip circumference was measured at the greatest protuberance just below the gluteal line.
Blood pressure
Resting BP was measured using a digital BP monitor (Omron M6 version HEM-7001-E, Omron, Kyoto, Japan). Participants were seated for a minimum of five minutes before the first BP measurement was done. Two subsequent measurements were taken with rest periods in between. The average of these latter two readings was used to determine mean resting BP.
Statistical analysis
Descriptive statistics were presented as mean ± standard deviation, median (interquartile range), or percent in tables. A principal component analysis (PCA) was performed with all BEVQ-15 items except water and diet soft drinks (due to zero and low caloric values) to determine patterns of SSB consumption. The following steps were followed: (1) the covariance matrix was applied, (2) the variance loadings were rotated using the varimax with the Kaiser normalisation orthogonal method. These authors could perform a PCA on the covariance matrix of SSB variables because the Bartlett's test of sphericity was good (p<0.0001) and Kaiser-Meyer-Olkin measure was acceptable (0.524). Six principal components (PC) on SSB matrix consumption were initially retained based on eigenvalues >1 and the scree plot observation. PC1 (hot tea/coffee with added sugar and energy drinks) explained 15.8% of the variance, while PC2 (beer and iced tea) and PC3 (low-fat milk and spirits) explained 12.1% and 10.9% of the variance respectively. The associated eigenvalues were 2.05, 1.58 and 1.41, respectively. The first four components also had the greatest factor loading with correlations >0.30 in the same direction, resulting in PC5 and PC6 being removed from an additional analysis.
Bivariate models were created to determine the association of plausible lifestyle behaviours variables with BMI and waist circumference. Those variables with p<0.20 were included in the initial backward stepwise multivariable linear regressions models. Thus the independent variables for the BMI model included age, employment status, hypertension, short sleep (<six hours/night), long duration sleep (>nine hours/night), SES, and PC2. The waist circumference model included age, employment status, highest level of education, SES, PC2, and BMI. The systolic and diastolic models included age, BMI, employment status, SES, and long sleep (>nine hours/day). The reference groups for the categorical variables were non-hypertensive, night-time sleep duration seven-eight hours per night, unemployed, and incomplete high school and primary school. Multicollinearity in these regression models was checked using variance inflation factor and is reported in the regression table. Only the β values with p<0.05 were displayed in the regression results table. All statistical analysis was conducted using Stata ver. 14.2 (StataCorp, Texas, USA).
Results
Participant characteristics
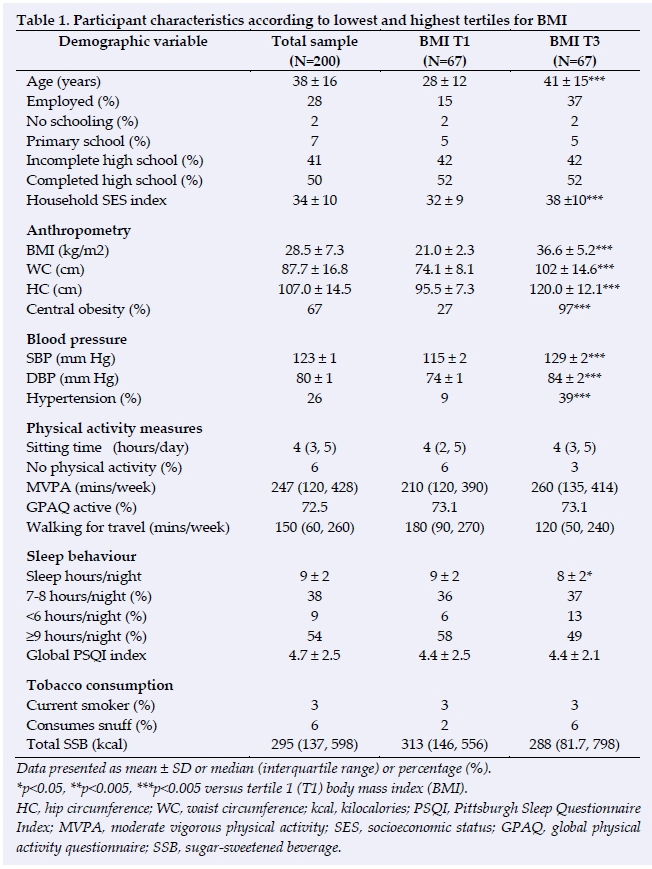
A total of 200 adult women volunteered to participate in this study. Table 1 displays that women in the highest tertile of BMI (BMI-T3) were approximately 13 years older than women in the lowest tertile of BMI (BMI-T1) and had a 2.5-fold higher prevalence of employed women and a mean SES score that was significantly higher (p<0.0001). The mean BMI and waist circumference of the study's population were 28.5 ± 7.3 kg.m2 and 87.7 ± 16.8 cm respectively, and the presence of overall obesity (40%) and central obesity (67%) were high. The systolic and diastolic BP values of the BMI-T3 group were significantly higher than the BMI-T1 group (p<0.0001), and the presence of hypertension in the sample was 26%. The physical activity profile of the women in BMI-T1 was similar to those in BMI-T3; however, women in the former group walked significantly more (p<0.05). Sleep duration was approximately one hour lower in women in BMI-T3, while the proportion of women in BMI-T1 with short duration sleep (<six hours/ night) was 7% lower than women in BMI-T3. The overall presence of smoking and snuff consumption was low in the study population, while SSB consumption was similar between BMI groups.
Correlates of BMI and waist circumference (WC)
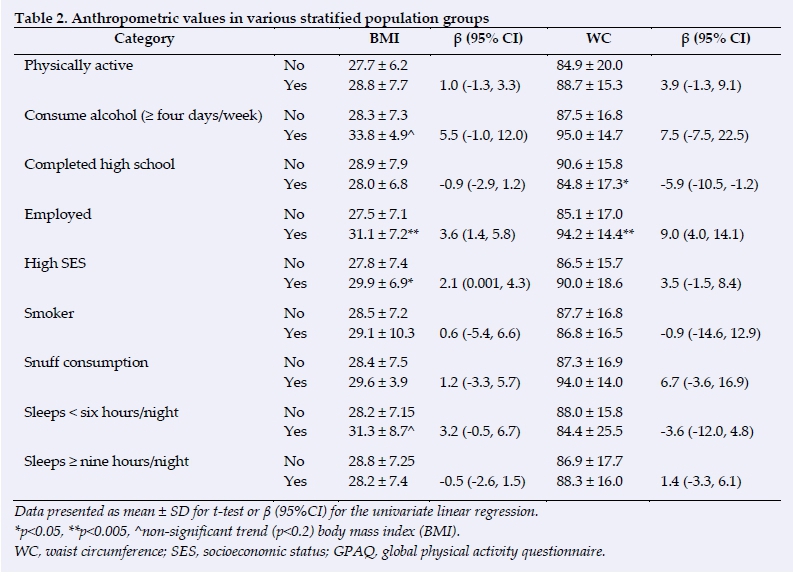
Table 2 shows that being physically active did not have an association with BMI or WC, while consuming a high frequency of alcohol (>four days/week) was associated with higher BMI, but not WC. Completion of high school was associated with a significantly lower WC, but not BMI. Subjects who were employed had higher BMI and WC values compared with those who were unemployed. High SES was positively associated with BMI, and not WC, while neither smoking status nor consumption of snuff was associated with BMI or WC. Those subjects with short sleep duration (< six hours/night) sho wed a trend for higher BMI, while this association was not observed for WC. Longer duration sleep (>nine hours/night) displayed no effect on BMI and WC. Further, PC2 was positively correlated with BMI (r=0.1, p=0.048) and had a trend for a positive correlation with WC (r=0.1, p=0.08). The other derived principal components were not correlated with anthropometry.
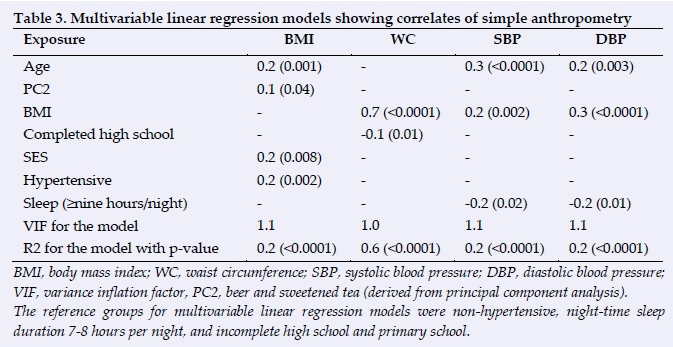
The results of the multivariable linear regression analysis for the detection of anthropometry correlates are displayed in Table 3. Age, PC2, hypertensive status, and high SES were significantly correlated with BMI, accounting for 17.5% of the variance. BMI and completion of high school were positively and negatively respectively correlated with WC, accounting for 59% of the variance.
Correlates of blood pressure (BP)
In univariate analysis, hours of night-time sleep was positively associated with systolic and diastolic BP in the highest quartiles for age (age: ≥ 47 years old), β: -0.4, p=0.01 and β: -0.5, p<0.0001, respectively. Systolic BP is 9% lower in women who sleep for longer durations per night than those who slept for normal durations (seven-eight hours/night). In contrast those who sleep for longer durations have a 5.6% lower diastolic BP compared to those with normal sleep time. The findings of the multivariable linear regression models indicate that women with longer sleep have better systolic and diastolic BP, while age and BMI increase linearly with BP (Table 3).
Discussion
The prevalence of obesity in this cohort of rural-dwelling African women was high, and as previously shown in other studies of black South African women, most of the study's population were sufficiently physically active according to the GPAQ-measurement of self-reported physical activity.[11,12] The findings show a relationship between pattern of SSB consumption and BMI, and in view of the recent implementation of the 'sugar tax', further investigation is needed to determine the impact of this regulation on longterm changes in public health. The prevalence of hypertension was significantly higher in those with elevated BMI, with longer sleep duration associated with better BP profile in the study cohort.
Longer night-time sleep was associated with lower systolic and diastolic BP in this study, which is contrary to an earlier study of urban African women showing an inverse relationship.[7] The findings of this study support preliminary findings of other studies suggesting protection against hypertension with extended sleep duration.[13] However, some studies have shown a U-shaped relationship between sleep duration and BP, indicating higher levels of BP with shorter and longer duration sleep, even if these results are not supported by international obesity guidelines recommendations.[14] The mechanistic pathways involved in the relationship between the duration of sleep and changes in BP are complex. For example, changes in sleep patterns can influence increases in metabolic biomarkers resulting in the higher risk of cardiovascular disea se, suggesting that other contributors may be involved.[15]
This study did not find a relationship between measures of fat and sleep duration, supporting the findings of Peltzer and Pengpid,[15] while Pretorius et al.[7] observed an inverse association only in those female subjects older than 40 years, suggesting a possible mediating effect of age in the relationship between longer sleep and lower BMI in African women. The sleep patterns of African women also tend to differ in rural and urban settings respectively,[7,15] with these literature showing that sleep quality is better in the urban setting, possibly due to better access to amenities such as electricity and being employed in less energy demanding work. Finally, with PC2, a significant positive association was noted with BMI, while no significant associations were noted for the other principal components. The observed positive relationship between PC2 "beer and sweetened tea" and BMI is consistent with global trends in SSB consumption.[5] The consumption of SSBs has deleterious implications on cardiovascular health,[5] indicating the urgent need for intervention in populations most susceptible to weight gain as a consequence of habitual consumption.
The limitations of this study included the use of self-reported instruments and the cross-sectional study design; however, the findings of this study are important in understanding the factors associated with anthropometry in rural-dwelling African women.
Conclusion
This study also confirms the high prevalence of obesity and the associated elevated BP in African women living in a rural South African village. The influence of extended sleep on lowering BP is a novel finding in this population, suggesting protection against hypertension with longer night-time sleep.
Conflict of interest: No conflicts of interest.
Acknowledgments: The authors acknowledge the participants and chief of the Tshino Nesengani (Mukondeleli) village, Limpopo Province, South Africa. One of the authors is supported by the South African DST/NRF Centre of Excellence in Human development. Another author is supported in part by the South African NRF through grant number 113366. Any opinion, finding and conclusion or recommendation expressed in this material is that of the author(s) and the NRF does not accept any liability in this regard.
References
1. NCD Risk Factor Collaboration (NCD-RisC) - Africa Working Group. Trends in obesity and diabetes across Africa from 1980 to 2014: an analysis of pooled population-based studies. Int J Epidemiol 2017;46(5):1421-1432. [doi: 10.1093/ije/dyx078] [ Links ]
2. Okop KJ, Levitt N, Puoane T. Factors associated with excessive body fat in men and women: cross-sectional data from black South Africans living in a rural community and an urban township. PLoS One2015;10(10): e0140153. [doi: 10.1371/journal.pone.0140153] [ Links ]
3. Goedecke JH, Mtintsilana A, Dlamini SN, et al. Type 2 diabetes mellitus in African women. Diabetes Res Clin Pract 2017;123:87-96. [doi: 10.1016/j.diabres.2016.11.017] [ Links ]
4. Ezeh A, Oyebode O, Satterthwaite D, et al. The history, geography, and sociology of slums and the health problems of people who live in slums. Lancet 2017;389(10068):547-558. [doi: 10.1016/S0140-6736(16)31650-6] [ Links ]
5. Malik VS, Popkin BM, Bray GA, et al. Sugar-sweetened beverages and risk of metabolic syndrome and type 2 diabetes: a meta-analysis. Diabetes Care 2010;33(11):2477-2483. [doi: 10.2337/dc10-1079] [ Links ]
6. National Department of Health, Statistics South Africa, South African Medical Research Council, et al. South Africa Demographic and Health Survey 2016: Key Indictors Report. Pretoria: Stats SA; 2017. http://www.statssa.gov.za/publications/Report%2003-00-09/Report%2003-00-092016.pdf [ Links ]
7. Pretorius S, Stewart S, Carrington MJ, et al. Is there an association between sleeping patterns and other environmental factors with obesity and blood pressure in an urban African population? PLoS One. 2015;10(10):e0131081. [doi: 10.1371/journal.pone.0131081] [ Links ]
8. Bull FC, Maslin TS, Armstrong T. Global physical activity questionnaire (GPAQ): nine country reliability and validity study. J Phys Act Health 2009;6(6):790-804. [PMID:20101923] [ Links ]
9. Hedrick VE, Savla J, Comber DL, et al. Development of a brief questionnaire to assess habitual beverage intake (BEVQ-15): sugar-sweetened beverages and total beverage energy intake. J Acad Nutr Diet 2012;112(6):840-849. [doi: 10.1016/j.jand.2012.01.023] [ Links ]
10. Buysse DJ, Reynolds CF 3rd, Monk TH, et al. The Pittsburgh Sleep Quality Index: a new instrument for psychiatric practice and research. Psychiatry Res 1989;28(2):193-213. [PMID:2748771] [ Links ]
11. Gradidge PJ, Norris SA, Micklesfield LK, et al. The role of lifestyle and psycho-social factors in predicting changes in body composition in black South African women. PLoS One 2015;10(7):e013291. [doi: 10.1371/journal.pone.0132914] [ Links ]
12. Micklesfield LK, Munthali RJ, Prioreschi A, et al. Understanding the relationship between socio-economic status, physical activity and sedentary behaviour, and adiposity in young adult South African women using structural equation modelling. Int J Environ Res Public Health 2017;14(10):pii: E1271. [doi: 10.3390/ijerph14101271] [ Links ]
13. Spaeth AM. Additional sleep duration associates with improved blood sugar regulation. Sleep 2015;38(5):663-664. [doi: 10.5665/sleep.4648] [ Links ]
14. Fang J, Wheaton AG, Keenan NL, et al. Association of sleep duration and hypertension among US adults varies by age and sex. Am J Hypertens 2012;25(3):335-341. [doi: 10.1038/ajh.2011.201] [ Links ]
15. Peltzer K, Pengpid S. Sleep duration, sleep quality, body mass index, and waist circumference among young adults from 24 low- and middle-income and two high-income countries. Int J Environ Res Public Health 2017;14(6): pii:E566. [doi:10.3390/ijerph14060566] [ Links ]
 Correspondence:
P J-L Gradidge
philippe.gradidge@wits.ac.za

