


Services on Demand
Article
 English (pdf)
 Article in xml format
 Article references
Indicators

Related links
-
 Cited by Google
 -
 Similars in Google
Share

 Permalink
South African Journal of Sports Medicine
On-line version ISSN 2078-516X
Print version ISSN 1015-5163
SA J. Sports Med. vol.28 n.2 Bloemfontein 2016
http://dx.doi.org/10.17159/2078-516x/2016/v28i2a163
ORIGINAL RESEARCH
Physiological responses of batsmen during a simulated One Day International century
L PoteI; CJ ChristieII
IMSc; Department of Human Kinetics and Ergonomics, Rhodes University, Grahamstown, South Africa
IIPhD; Department of Human Kinetics and Ergonomics, Rhodes University, Grahamstown, South Africa
ABSTRACT
BACKGROUND: There is a limited amount of literature on the physiological cost of batting. Of the studies that have been completed, most have used protocols that are of short duration and high intensity, and it has been questioned whether this represents actual game play. Furthermore, it is difficult to study sports such as cricket due to the intermittent nature of the game.
OBJECTIVE: To determine the physiological responses of batsmen during a simulated One Day International century.
METHODS: Seventeen male batsmen from the Rhodes University Cricket Club performed a simulated batting work bout known as the BATEX© protocol. The protocol consisted of six, five overs stages, each lasting 21 minutes. Three of the stages (stages one, three and five) were low-intensity stages and the other three (stages two, four and six) were high-intensity stages. During the work bout selected physiological responses were recorded.
RESULTS: Heart rate (124±15-159±14 beats.min-1), oxygen uptake (29.3±6.1-43.4±6.3 ml.kg-1.min-1), energy expenditure (48.1±9.2-109.2±10.5 kJ.min-1) and core temperature (37.7±0.3-38.7±0.4 oC) responses all increased significantly (p<0.05) between stage one and stage six. The respiratory exchange ratio decreased significantly (p<0.05) between stages one and six (0.90±0.19-0.89±0.37).
CONCLUSIONS: Batting is more physically demanding than originally thought, and as a result training programmes should concentrate on simulating real match play situations to improve performance and reduce the risk of injury.
Keywords: cricket, energy expenditure, heart
The game of cricket has changed substantially over the last century, with the first form of the game, five day test matches, evolving into One Day Internationals (ODI, 50 over games) and Twenty20 cricket (20 over games).[1] More specifically, in ODIs, more runs are scored per innings and by individual batsmen. Furthermore, a batsman scoring a century runs 40 singles, eight twos, three threes and hits an average of seven fours and two sixes after spending approximately 136 minutes at the crease.[2,3] Thus it is evident that both the physical and psychological load placed on the players is increasing. However, these demands have not received much attention, most likely because the game is intermittent in nature and therefore difficult to study.[2,4]
The first study that quantified the physical cost associated with cricket was during the 1953 Ashes series.[5] This study concluded that the average cricketer expended approximately 650 kJ.h-1, and that cricket was a physically undemanding sport. However, this study focused specifically on test matches, and the demands of the game have changed substantially since 1953. It was 38 years later when it was reported that during an ODI game, batsmen had sweat rates, heart rates and rectal temperatures of up to 6 L.h-1, 120 beats.min-1 and 38.5 oC respectively.[6] This led to the conclusion that cricket was more physically demanding than previously thought, a statement that was further validated by Noakes and Durandt[3] in 2000.
Since then other studies have been conducted in these authors' laboratory. King,[7] in 2002, reported a mean heart rate response of 138 beats.min-1 and a peak response of 168 beats.min-1, as well as sweat rates of 0.93 L.h-1. Christie et al.,[4] in 2008, showed a mean heart rate of 145 beats.min-1, oxygen uptake of 26.7 ml.kg-1.min-1, a respiratory exchange ratio of 1.05 and an energy cost of 2536 kJ.h-1. Other measures recorded during this study included breathing frequency (31.2 breaths.min-1), tidal volume (2.2 L) and minute ventilation (65.1 L.min-1). The last study conducted in these authors' laboratory showed responses between 140-168 beats.min-1, 24.928.1 ml.kg-1.min-1 and 9.7-11.6 for heart rate, oxygen uptake and energy expenditure respectively.[8] These studies used short duration (seven overs), high-intensity (maximal sprints) protocols, and it has been questioned whether this is representative of actual match play. Of note, however, is that these responses were quite accurate when comparisons are made to real game play where heart rate responses between 139-154 beats.min-1 during ODI matches and 149-167 beats.min-1 during T20 matches have been reported.[9,10] This is further validated by the mean heart rate (164±12 beats.min-1) recorded by Vickery et al.,[11] during a simulated, eight over, match situation
According to these authors, the only long duration, laboratory-based protocol has been performed by Houghton et al.,[12] where a simulated century batting work bout, known as the BATEX© protocol, was used. The protocol consisted of six, five over stages (21 min each) that represented certain phases of play. The study showed a mean heart rate, tympanic temperature and sweat rate of 130 beats.min-1, 35.9 oC and 0.9 L.h-1. However, although this investigation used a long duration protocol, the main aim was not the physiological cost of batting and so the responses measured were limited and crude. Therefore the main aim of this present study was to examine more detailed physiological responses of players batting for extended periods of play using the BATEX© protocol, previously validated by Houghton et al.[12]
Methods
This repeated measures study design utilised one condition and tested responses over time. Ethical approval was granted by the Department of Human Kinetics and Ergonomics Ethical Standards Committee for Research involving human participants (Rhodes University, Grahamstown, South Africa) and all participants provided written informed consent.
The sample consisted of 17 male cricket batsmen (mean ± S.D. for age, stature, mass, body mass index and body fat percentage were 22.5±2.3 years; 181.6±5.6 cm; 81.7±9.9 kg; 24.9 ±2.8 kg.(m2)-1 and 12.9±2.4% respectively) playing for the Rhodes University Cricket Club.
Two testing sessions were required. The first testing session was used to collect basic anthropometric and demographic data and to familiarise the players with the equipment and the simulated century protocol (BATEX© protocol as described by Houghton et al.[12]). The BATEX© protocol was used as this is the only century protocol that has been validated. Equipment included a portable online metabolic system, the k4b2 (Cosmed®, Rome), a Polar® heart rate monitor (Kempele, Finland) and a CoreTemp® (HQInc., United States of America) monitoring system. These were used to measure oxygen consumption (VO2), respiratory exchange ratio (RER), heart rate (HR) and core temperature responses over the duration of the protocol. Before each testing session, the k4b2 was calibrated using a Hans Rudolph 5530 3-L syringe for volumetric calibration, a gas mixture (16.10% Oxygen, 4.90% Carbon Dioxide and 79.00% Nitrogen) for the sensors as well as a room air calibration.
Briefly, the protocol consisted of six, five over stages (21 min each) and each stage matched a specific phase of play, where batsmen were encouraged to bat with the mindset typical of that phase. For example, stages one, three and five were low-intensity stages, where players ran at a self-selected cruise pace whereas stages two, four and six were high-intensity stages, where players were required to sprint the runs between the wickets (17.68 m, the length of a cricket pitch). Furthermore, there was a 35 s break between balls and a 75 s break to simulate the bowler walking back to their mark and the change in over. During familiarisation, players were also instructed not to consume alcohol or partake in any physical activity 24 hours prior to testing and to bring cricket kit (pads, gloves, thigh pads and box) to the testing session. At the end of the first session each player was given a core body temperature pill to swallow two hours before the second session, to allow it to enter the digestive tract prior to the experimental session.
The second testing session (5-7 days after familiarisation) was completed at the High Performance Centre, Kingswood College in Grahamstown, South Africa. On arrival at the centre, players performed a cricket-specific, dynamic warm-up (as described by Houghton et al.[12]) to minimise the risk of injury, after which they padded up in cricket kit and were fitted with the equipment to perform the BATEX© century protocol. Balls were delivered (at 105 km.h-1) using a bowling machine (Brell express bowling machine, Flicx, South Africa), on the batsman's front foot, on the offside. The BATEX© audio track notified the researcher when to release the next ball. The audio track was also used to notify the batsmen of how many shuttle runs (17.68 m, the length of a cricket pitch) to complete in the upcoming over. At the halfway point of the protocol, players were given an Energade sports energy drink (645 kJ; 39 g CHO) to consume.
After the experimental session was completed, the equipment was removed from the players and they were required to partake in a cool-down session (approximately ten minutes), which included a jog and more cricket-specific stretches.
Statistical analysis
All statistical analyses were performed using STATISTICA 10 software. Descriptive measures of physiological, performance and perceptual data included mean values and standard deviations. The level of significance was set at p<0.05. Effect size characterised the magnitude of difference between the various stages. The criteria for interpreting effect sizes were: <0.2 trivial, 0.2-0.6 small, 0.6-1.2 moderate, 1.2-2.0 large and >2.0 very large.[13] A one-way analysis of variance was used to compare differences between stages at different intensity levels over time. Tukey's post hoc analyses identified specific areas of differences.
Results
Significant differences were observed for all measures between stage one and stage 6 (Table 1).
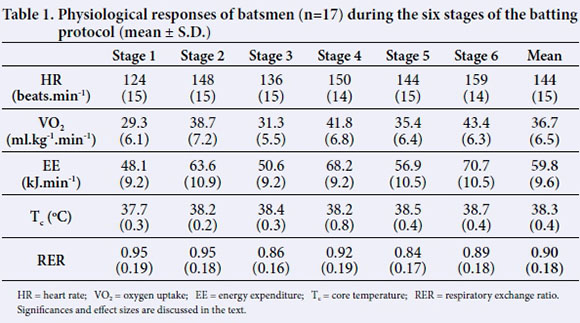
Heart rate responses increased significantly (p<0.05) from stage one to stage six (124 ± 15 to 159±14 beats.min-1) with a mean heart rate of 144 (±15) beats.min-1. A large effect size (ES) was observed between stages one and two (ES=1.60) and a moderate effect size between stages one and five (ES=0.55).
Mean VO2 was 36.7 (±6.5) ml.kg-1.min-1, with the low intensity stages, expectedly, eliciting lower responses compared to the high intensity stages. Large effect sizes were also observed between the different intensity stages (Stage one-two ES=1.45, Stage three-four ES=1.62, Stage five-six ES=1.24 respectively).
RER decreased significantly (p<0.05) from 0.90±0.19 until the drinks break (0.92±0.19). After the drinks break, responses increased significantly (p<0.05) (stage four) and then decreased to the lowest mean response (0.84±0.17) during stage five. At the end of stage six RER was 0.89±0.37.
Energy expenditure responses increased significantly (p<0.05) from stage one to stage 6 (48.1 ± 9.2 to 70.7 ± 10.5 kJ.min-1). A mean energy expenditure of 59.8 ± 9.6 kJ.min-1 was recorded. Large magnitude changes were observed between all stages (ES = 1.58, 1.32, 1.79, 1.41) except between stages four and five where a moderate change was observed (ES = 1.15).
Significant increases (p<0.05) in core temperature was observed between stage one and stage six (37.7 ± 0.3 to 38.7 ± 0.4 oC). The only large effect size was observed between stages one and two (ES = 1.40). Mean core temperature was 38.3 ± 0.4 oC.
Discussion
The main finding of this study was that batting for extended periods, such as during the BATEX© protocol, significantly influences the fatigue profile experienced by a batsmen, which is exacerbated by batting in the heat. This was a result of both the intensity and duration of the work bout.
Responses in this study were similar to those recorded by both King[7] and Christie et al.[4] who found mean heart rate responses of 145 and 138 beats.min-1 respectively. Both studies used short duration, high-intensity work bouts where batsmen ran a double shuttle every second delivery. This suggests that batsmen regulate intensity of effort dependent on duration so that cardiovascular load remains stable. However, this must be seen within the context of the study designs which did not take into consideration aspects of game, player and competition dynamics to name a few factors which may impact heart rate responses. Pote and Christie[8] found higher heart rate responses in their study (140-168 beats.min-1) this was to be expected as, although the protocol was short in duration, players were required to sprint every ball, rather than every second ball. In contrast, a longer duration protocol used by Houghton et al.[12] reported lower heart rate responses than seen in this study. This can be explained by the calibre of the player. Houghton et al.[12] used professional players, while the players in this study were non-professional batsmen, although player ages for both studies were similar. Of note, however, is that the responses in this study are comparable to data obtained during real match play even though the players were not exposed to actual game dynamics, such as scoreboard pressure and importance of the match (exhibition vs. World Cup match).[9,10] This was not the case though when compared to Gore et al.[6], who also looked at real match play data (mean of 144±15 beats.min-1); however, this was to be expected as the game of cricket has changed to a large extent since 1993.
An interesting finding was the effect of both duration and intensity on heart rate responses. Previous batting studies have shown that duration had no impact on cardiovascular responses.[14] This was not the case in this study as there was a significant (p<0.05) increase in heart rate between stages one and six (124-159 beats.min-1) as well as a significant (p<0.05) increase between stages two and six (148-159 beats.min-1), thus showing the effect of duration on changing physiological responses.
Mean oxygen consumption (36.7±6.5 ml.kg.min-1) was considerably higher than shown in previous cricketing studies (Christie et al.[4]: 26.7 ml.kg.min-1; Pote and Christie[8]: 26.9 ml.kg. min-1). This could be because those studies used shorter protocols and because in this study, VO2 rose significantly (p<0.05) between stages one and two (29.3-38.7 ml.kg.min-1) and then remained high throughout the rest of the protocol. This indicates that players may not have recovered sufficiently in the low-intensity stages before starting the high-intensity stages. The duration of the protocol and the intensity of the different stages also affected VO2 responses as shown by the large effect sizes (ES=1.45, 1.62 and 1.24, between stages one and two, three and four and five and six respectively).
Mean RER during the protocol (0.90±0.18) was lower than the only other study to report on this response during batting (Christie et al.[4]: 1.05), as more carbon dioxide was produced due to the high intensity of the shorter protocol, therefore resulting in an increased RER. At the start of the protocol, players were utilising mainly carbohydrates as an energy source, but as the protocol approached the drinks break there was a shift in substrate utilisation, due to the increase in exercise duration, indicating reduced reliance on carbohydrates.[15] The slight rise in RER after the drinks break could be attributed to the ingestion of an Energade sports energy drink (645 kJ; 39 g CHO), which could have resulted in higher carbohydrate utilisation from the ingested glucose. RER then decreased for the remainder of the protocol indicating a greater reliance on fats as an energy source, which was to be expected. Important to acknowledge, however, is that RER during intense exercise may not be a reliable indicator of substrate use, although it could be argued that in this study, over time, intensity of effort was moderate.
The mean energy cost (59.8±9.6 kJ.min-1) observed in this study was substantially higher than that proposed by Fletcher[5] in 1955. However, this must be seen within the context of the changing nature of the game, specifically with respect to higher batting scores and individual runs scored per innings. When compared to other cricketing studies (Christie et al.[4]: 42.3 kJ.min-1; Pote and Christie[8]: 46.4 kJ.min-1), the responses shown in this study are higher. This was to be expected as batsmen batted for a longer time, ran a higher number of runs and performed the protocol at different intensities. This emphasises the importance of measuring the impact that prolonged batting has on players. An understanding of these factors will influence the design of training programmes which has important performance implications for these players. Batsmen were also required to 'touch and turn' at the non-strikers end when running a single as if looking for another run. This may have affected the energy cost recorded, as research has shown that the deceleration, turning at the crease and reacceleration have an impact on energy cost.[8] Furthermore, because other physiological responses were not affected by this occurrence, it means that this extra energy cost may be the result of changes in the player's muscle force, producing capabilities required when turning for another run.[8]
Mean core temperature (38.3±0.4 oC) was higher than in previous cricket studies, but the previous studies used tympanic, skin, rectal and forehead temperature. It has also been suggested that the ingestible pill is more accurate than these measuring techniques.[6,7,12,16] When temperatures were compared to the only other long duration study of Houghton et al.,[12] who reported a 0.3 oC rise in temperature over the 30 over protocol, this present study showed a rise of 1.1 oC in the same time period. This may be due to the different testing conditions (laboratory- vs. field-based testing) or the difference in measuring techniques (tympanic vs. ingestible pill, the latter of which is more accurate). The rise in core temperature was probably due to the active muscles requiring additional blood, thus compromising blood flow to the skin and therefore limiting heat transfer to the environment.[17] Other factors that may have affected core temperature include glycogen depletion, hypohydration, and the accumulation of potassium in the interstitium of the muscle[18]. However, the fact that core temperature did not reach critical levels suggests that players are able to regulate intensity of effort to prevent excessive rises in core temperature. Future studies should consider measuring sprint time changes in order to establish whether batsmen are slowing down over time; something which would impact core temperature changes.
Limitations
This study must be seen within the context of its limitations. The primary limitation is the fact that this was a laboratory-based, simulation protocol and was therefore not able to take into account all aspects of a cricket game, such as varying environmental conditions. Furthermore, the impact that the crowd has on a batsmen during a normal ODI could not be replicated, although verbal encouragement was given to batsmen when necessary.
Conclusion
The current study is the only investigation, to date, to observe a multitude of physiological responses during extended periods of batting. Results show that batting is substantially more physiologically taxing than originally thought. This highlights the importance of the need for training programmes that simulate real match situations, specifically for batsmen who are required to bat for long periods of time. The type of training done by players needs to closely mimic the demands that players are faced with in real match play. Furthermore, a standardised battery of tests needs to be developed that can be used for not only testing the physical fitness characteristics of batsmen but also for improving training status. Consideration could then be given to the concept of specificity and current demands placed on top-order batsmen.
Acknowledgments: This work is based on research supported by the National Research Foundation of South Africa. Any opinion, findings, conclusions or recommendations expressed in this material are those of the authors and therefore the NRF does not accept any liability in this regard.
References
1. Patel DR, Stier B, Luckstead, EF. Major international sport profiles. Pediatr Clin North Am 2002;49(4):769-792. [DOI: 10.1016/S0031-3955(02)00018-4] [PMID: 12296532] [ Links ]
2. Duffield R, Drinkwater EJ. Time-motion analysis of Test and One-Day international cricket centuries, J Sports Sci 2008;26(5):457-464. [DOI: 10.1080/02640410701644026] [PMID:18274943] [ Links ]
3. Noakes TD, Durandt JJ. Physiological requirements of cricket. J Sports Sci 2000; 18:919-929. [DOI: 10.1080/026404100446739] [PMID: 11138982] [ Links ]
4. Christie CJ, Todd AI, King GA. Selected physiological responses during batting in a simulated cricket work bout: a pilot study. J Sci Med Sport, 2008; 11(6):581-584. [DOI: 10.1016/j.jsams.2007.08.001] [PMID:17875403] [ Links ]
5. Fletcher J. Calories and cricket. Lancet, 1955;1:1165-1166. [DOI: 10.1016/S0140-6736(55)90662-0] [ Links ]
6. Gore CJ, Bourdon PC, Woodford SM, et al. Involuntary dehydration during cricket. Int J Sports Med 1993;14(7):387-395. [DOI: 10.1055/s-2007-1021197] [PMID: 8244605] [ Links ]
7. King GA. Physiological, perceptual and performance responses during cricket activity. 2002. Unpublished MSc Thesis, Department of Human Kinetics and Ergonomics, Rhodes University, Grahamstown, South Africa. [ Links ]
8. Pote L, Christie CJ. Physiological and perceptual demands of high intensity sprinting between the wickets in cricket. Int J Sports Sci Coach 2014;9(6):1375-1382. [DOI: 10.1260/1747-9541.9.6.1375] [ Links ]
9. Nicholson G, Cook C, O'Hara J. Heart rate of first-class cricket batsmen during competitive 50-over and 20-over match play. J Sports Sci 2009;27(suppl 2):S100. [ Links ]
10. Petersen CJ, Pyne D, Dawson B et al. Movement patterns in cricket vary by both position and game format. J Sports Sci 2010;28(1):45-52. [DOI: 10.1080/02640410903348665] [PMID: 20013461] [ Links ]
11. Vickery W, Dascombe B, Duffield R, et al. Battlezone: An examination of the physiological responses, movement demands and reproducibility of small sided cricket games. J Sports Sci 2013;31(1):77-86. [DOI: 10.1080/02640414.2012.720706] [PMID: 22963389] [ Links ]
12. Houghton L, Dawson B, Rubenson J, et al. Movement patterns and physical strain during a novel, simulated cricket batting innings (BATEX). J Sports Sci 2011;29(8): 801-809. [DOI: 10.1080/02640414.2011.560174] [PMID: 21506040] [ Links ]
13. Hopkins WG. How to interpret changes in an athletic performance test. Sportscience, 2004;8:1-7. [ Links ]
14. Sheppard B, Christie CJ. Musculoskeletal and perceived effects during high and low volume sprints between the wickets during batting in cricket. 2012; Unpublished MSc Thesis, Department of Human Kinetics and Ergonomics, Rhodes University, Grahamstown, South Africa. [ Links ]
15. Brooks GA, Mercier J. Balance of carbohydrate and lipid utilization during exercise: the "crossover" concept. J Appl Physiol (1985)1994;76(6):2253-2261. [PMID: 7928844] [ Links ]
16. Lim CL, Byrne C, Lee JKW. Human thermoregulation and measurement of body temperature in exercise and clinical settings. Ann Acad Med Singapore 2008;37(4): 347-353. [PMID:18461221] [ Links ]
17. Charkoudian N. Skin blood flow in adult human thermoregulation: how it works, when it does not and why. Mayo Clin Proc 2008;78:603-612. [DOI: 10.4065/78.5.603] [PMID:12744548] [ Links ]
18. Duffield R, Coutts AJ, Quinn J. Core temperature responses and match running performance during intermittent-sprint exercise competition in warm conditions. JStrength Cond Res 1999; 23(4): 1238-1244. [DOI: 10.1519/ JSC.0b013e318194e0b1] [PMID:19568033] [ Links ]
 Correspondence:
L Pote
g06p1630@campus.ru.ac.za

