


Services on Demand
Article
 English (pdf)
 Article in xml format
 Article references
Indicators

Related links
-
 Cited by Google
 -
 Similars in Google
Share

 Permalink
South African Journal of Sports Medicine
On-line version ISSN 2078-516X
Print version ISSN 1015-5163
SA J. Sports Med. vol.27 n.2 Bloemfontein Jun. 2015
http://dx.doi.org/10.7196.570
ORIGINAL RESEARCH
The cricket bowling performance of different racial groups at a junior provincial level in South Africa
M S TaliepI; R GamieldienII; S J WestI
IPhD; Department of Sports Management, Faculty of Business and Management Sciences, Cape Peninsula University of Technology, Cape Town, South Africa
IIBTech; Department of Sports Management, Faculty of Business and Management Sciences, Cape Peninsula University of Technology, Cape Town, South Africa
ABSTRACT
OBJECTIVE: To investigate the difference in performance and bowling opportunity of black African (BA), coloured/Indian (C/I) and white (W) cricket bowlers at a junior provincial level in South Africa between 2006 and 2012.
METHODS: Data of all players performing in the South African interprovincial under-13 (U13), under-15 (U15) and under-19 (U19) tournaments were analysed. Bowling performance (bowling average and the top 20 wicket takers relative to their par representation) and bowling opportunity (number of overs bowled) were compared between racial groups.
RESULTS: There were no significant differences in the bowling averages between BA bowlers and the other racial groups between 2008 and 2012. BA bowling averages were only significantly worse than W bowlers in the U13s in 2006 and U19s in 2007. BA bowling averages were also only significantly worse than C/I in the U13s and U15s in 2007. BA bowlers were below par representation in the top 20 wicket takers in each year for the U15s and U19s and below par representation for the U13s in 2007 - 2009 and 2011. The performance of C/I and W bowlers was relatively similar across the age groups. BA players bowled significantly fewer overs than W bowlers in the U13s in 2006, in the U15s in 2007 and 2009 and in the U19s in 2006, 2007, 2010 and 2011. C/I bowlers bowled significantly fewer overs than W bowlers in the U13s in 2008 and 2009.
CONCLUSION: The bowling averages of the different racial groups are similar. However, there were relatively few BA bowlers in the top 20 wicket takers each year. This could be because of a lack of highly skilled BA bowlers or the lack of opportunity provided to BA bowlers to bowl in these tournaments.
Apartheid in South Africa (SA) was a system of legal racial segregation involving political and economic discrimination against black (black African (BA), coloureds/Indian (C/I)) South Africans. These policies were enforced by the SA government between 1948 and 1994. The apartheid system also disadvantaged blacks in the sporting arena. Blacks received minimal and inferior cricket facilities at schools and clubs.[1] An example of this is that a white population of 15%[2] had 89% of the school cricket pitches in 1981.[1] Blacks were also not allowed to participate in international sport, thereby further limiting their development.
Post apartheid (1994), the SA government and the cricketing body in charge at that time, United Cricket Board of South Africa (UCBSA) today known as Cricket South Africa (CSA), were faced with the enormous challenge of trying to redress the injustices caused by apartheid. White (W) players had access to the best fields, facilities, coaches, schools and the provincial and national teams were mainly constituted of W players. The biggest challenge of UBCSA was to develop and transform cricket among the previously disadvantaged black communities so that cricket could be fully represented by all racial groups at all levels.
The Department of Sport in SA defines transformation in the Transformation Charter as: 'Increased access and opportunities for all South Africans, including women, persons with disabilities, youth, children and the elderly to sport and recreation opportunities; the socio-economic benefits of sport are harnessed; and the constitutional right to sport is recognised'.[3] Much money was spent on implementing this transformation process.[4] Money was spent trying to promote cricket by either building new or upgrading existing facilities. A mini cricket programme was also introduced to develop cricket among the youth at soft cricket ball level. Over 2 million children have since been a part of this mini cricket programme.[5] Bursaries were established for black players to attend the best cricketing schools in the country.[6] There were a number of programmes and cricket academies introduced to further improve the skill and performance of cricketers. Talent acceleration programmes were initiated that targeted the elite U17 and U19 players to prepare them to bridge the gap between junior and senior provincial cricket. The CSA high performance programme further aims at developing skilled players. There was the formation of a Rural Cricket Week competition and inland and coastal academies.[7] There is also the CSA national cricket academy that aims to bridge the gap between 1st class and international cricket.[7]
Monitoring the success of transformation is difficult because of its broad definition. Despite this broad definition, an important factor to assess the success of the transformation process is to observe the playing numbers and performance of black players at national and provincial level. This is evident in the governmental meetings held where this was discussed.[8-10] Some authors have therefore attempted to identify the success of transformation by investigating the playing numbers and performance of black players at senior and junior provincial level. There has been a significant increase in the number of BA players participating in senior provincial cricket but there was a significant decrease at a junior provincial level.[11,12] The increase in C/I players has been at both senior and junior level.
The performance of senior BA bowlers (runs per dismissal) was on par with W bowlers between 1996 and 2008 (i.e. all years reported by the authors). However, the performance of BA batsmen showed a different trend. They found that there were few skilled senior provincial BA batsmen. Senior provincial BA batsmen batting performance, as measured by batting average, was significantly worse than W batsmen for every season between 1996 and 2008. Furthermore, at junior provincial level, BA batsmen batting average was significantly worse than W batsmen in every year reported.[12] Therefore, there is a concern with the representation and performance of BA batsmen at the junior and senior level, suggesting that the problem exists from a young age and persists to adulthood. Despite the numerous development and transformation programmes and policies aimed at enhancing skill, the performance of BA batsmen remained weak.
There have been no published articles reporting the bowling performance at a junior provincial level. We are therefore uncertain if BA bowlers are performing well at a junior provincial level (representing a natural ability) or if their performance is weak and then improves as they reach the senior ranks (most probably a representation of the positive effect of development). Furthermore, none of the previous studies has investigated the bowling opportunity provided to BA players in matches (i.e. were the bowlers allowed to bowl the same amount of overs as other racial groups). Therefore, the aim of the study is to evaluate the performance and bowling opportunity provided to BA bowlers at junior provincial level.
Methods
Data were taken from the under-13 (U13), under-15 (U15) and under-19 (U19) annual interprovincial cricket tournaments in SA between 2006 and 2012. Bowling performance was determined by two different methods. The first method investigated the bowling average (runs/dismissal) while the second method investigated the number of players in the top 20 highest wicket takers in the tournament relative to their par representation. Where more than one player had the same number of wickets, the player with the best bowling average was ranked higher. Par representation was determined by calculating the percentage representation of each group relative to their total representation in that year.[12] The following equation was used:
Par representation (x, y, z) = (Total percentage participation x 20)/100.
where x, y, z represent W, C/I and BA respectively.
The par value was then subtracted from the actual representation of the group in the top 20 and plotted. Therefore a value of 1 indicates that a group had 1 person more than the estimated par value for that group, a value of -1 indicates that a group had 1 person less than the estimated par value for that group.
Opportunity to bowl was measured by the number of overs a player bowled. One-way analysis of variance (ANOVA) was used to determine the difference between the mean bowling averages and mean bowling overs of the different racial groups for each year. When a significant p-level (p<0.05) was achieved, a post hoc, Bonferroni test was applied to determined where the means differed. Bowling average is a measure of bowling performance, and the higher the average the weaker the performance (i.e. more runs are scored against the bowler before a wicket is taken).
Results
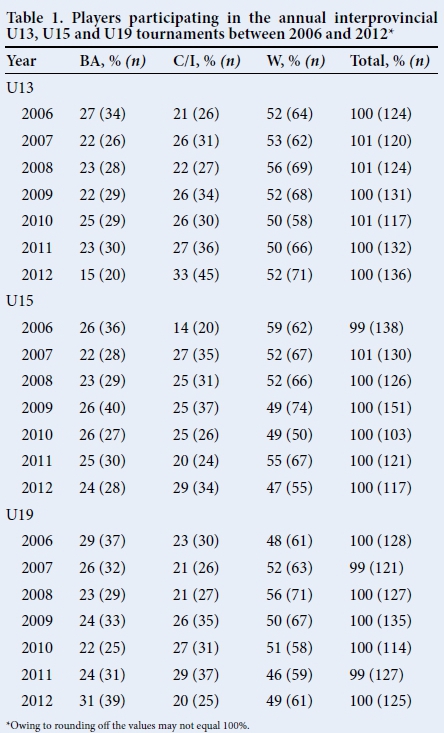
A total of 4 180 players participated in the U13, U15 and U19 inter-provincial tournaments between 2006 and 2012. Of these 4 180 players, 2 511 (60%) bowled. The number and per cent of BA, C/I and W players that bowled in these tournaments are presented in Table 1. Although the per cent representation varies in each year, there is relatively equal representation in the U13, U15 and U19 interprovincial tournaments between the W (~50%) and black bowlers (~50%) for each year. There was also similar representation between the C/I (~25%) and BA (~25%) bowlers.
Bowling performance measures
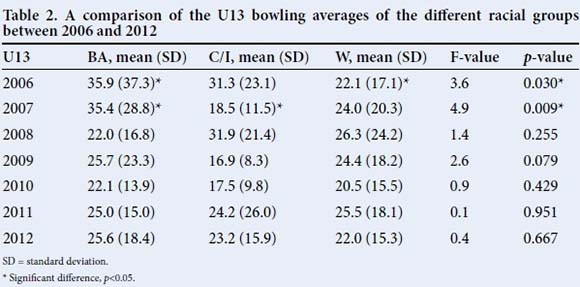
In the U13 age group, there were significant differences in the performance of the three racial groups in 2006 (F2,121=3.6, p=0.030) and 2007 (F2,117=4.9, p=0.009)(Table 2). Bonferroni (post hoc) comparison of the three groups indicated that in 2006 W bowlers had better bowling averages (mean 22.1, 95% confidence interval (CI) 17.83 - 26.36) compared with BA bowlers (mean 35.9, 95% CI 22.92 - 48.96), p=0.034. In 2007 C/I bowlers had significantly better bowling averages (mean 18.5, CI 14.23 - 22.68) compared with BA bowlers (mean 35.9, 95% CI 23.80 - 47.05, p=0.008). There was no significant difference between W and C/I bowlers in 2006 and 2007. There were no significant differences in the bowling averages between racial groups from 2008 to 2012.
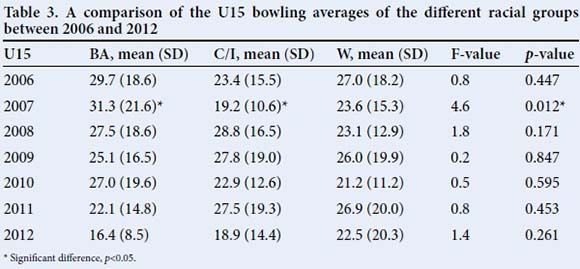
In the U15 age group, there were only significant differences in the performance of the three racial groups in 2007 (F2,126=4.6, p=0.012) (Table 3). Post hoc comparison of the three groups indicated C/I bowlers had significantly better bowling averages (mean 19.2, 95% CI 15.53 - 22.82) compared with BA bowlers (mean 31.3, 95% CI 22.92 - 39.66, p=0.009). There was no significant difference between W and C/I bowlers in 2007. There were no significant differences in the bowling averages between racial groups for 2006 and between 2008 and 2012.
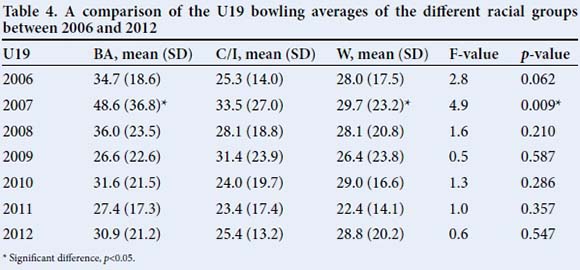
In the U19 age group, there were only significant differences in the performance of the three racial groups in 2007 (F2,118=4.9, p=0.009) (Table 4). Post hoc comparison of the three groups indicates that W bowlers had significantly better bowling averages (mean 29.7, 95% CI 18.87 - 31.02) compared with BA bowlers (mean 48.6, 95% CI 17.81 - 35.33, p=0.007). There were no significant differences in the bowling averages between the groups for 2006 and between 2008 and 2012.
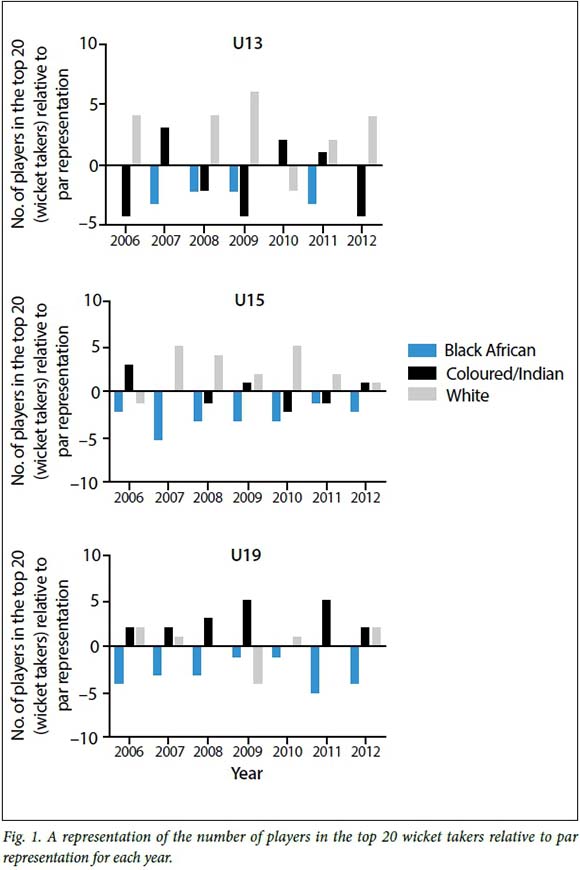
Data of the top 20 highest wicket takers relative to their par representation are presented in Fig. 1. BA bowlers were below par representation for the U13s from 2007 to 2009 and in 2011. In the U13 group, W bowlers were mainly above par representation (2006, 2008, 2009, 2011, 2012) while the C/I bowlers oscillated above and below the par representation mark. In the U15 group, BA bowlers were below the par representation mark in every year while W bowlers generally appear above the par representation mark (2007 - 2012). C/I bowlers oscillated above and below the par representation mark. In the U19 age group, BA bowlers were below the par representation mark in every year. C/I bowlers are above the par representation level for the U19s from 2006 to 2009 and in 2011, while W bowlers approximated the par representation mark.
Opportunity to bowl
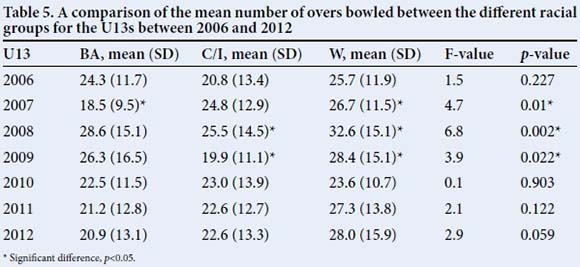
In the U13 age group, there were significant differences in the mean bowling overs of the three racial groups in 2007 (F2,117=4.7, p=0.01), 2008 (F2,121=6.8, p=0.002) and 2009 (F2,128=3.9, p=0.022)(Table 5). Post hoc comparison of the three groups indicates that in 2007 W bowlers bowled significantly more overs (mean 26.7, 95% CI 23.8 - 29.6) than BA bowlers (mean 18.5, 95% CI 14.6 - 22.3, p=0.008). White bowlers also bowled significantly more overs than C/I in 2008 (mean 32.6, 95%CI 29.0 - 36.3 v. mean 25.5, 95% CI 20.7 - 30.3) and in 2009 (mean 28.4, 95% CI 24.8 - 32.1 v. mean 19.9, 95% CI 16.0 - 23.8).
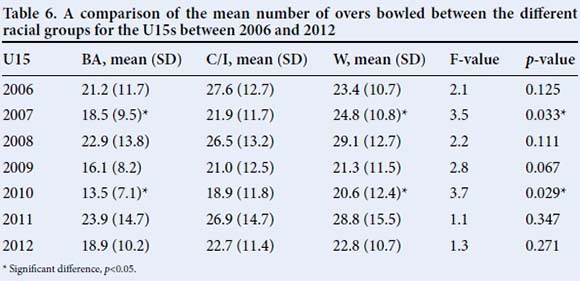
In the U15 age group, there were significant differences in the mean bowling overs of the three racial groups in 2007 (F2,127=3.5, p=0.033) and 2010 (F2,100=3.7, p=0.029)(Table 6). Post hoc comparison of the three groups indicated that W bowlers bowled significantly more overs than BA in both 2007 (mean 24.8, 95% CI 22.2 - 27.5 v. mean 18.5, 95% CI 14.9 - 22.2, p=0.031) and in 2010 (mean 20.6, 95% CI 17.1 - 24.1 v. mean 13.5, 95% CI 10.7 - 16.3, p=0.025).
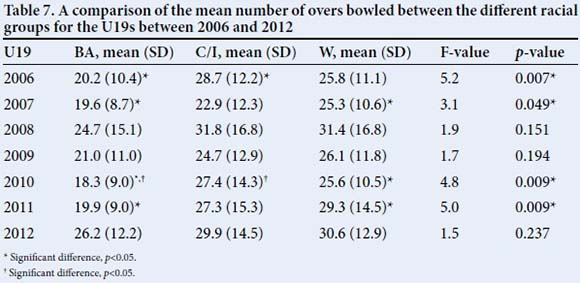
In the U19 age group, there were significant differences in the mean bowling overs of the three racial groups in 2006 (F2,125=5.2, p=0.007), 2007 (F2,118=3.1, p=0.049), 2010 (F2,111=4.9, p=0.009) and 2011 (F2,124=5.0, p=0.009)(Table 7). Post hoc comparison of the three groups indicates that C/Is bowled significantly more overs than BAs in 2006 (mean 28.7, 95% CI 24.2 - 33.3 v. mean 20.2, 95% CI 16.8 - 23.7), p=0.007 and in 2010 (mean 27.4, 95% CI 22.1 - 28.3 v. mean 18.3, 95% CI 14.6 - 22.1, p=0.012). White bowlers bowled significantly more overs than BA in 2007 (mean 25.3, 95% CI 22.6 - 28.0 v. mean 19.6, 95% CI 16.5 - 22.8, p=0.043), 2010 (mean 25.6, 95% CI 22.8 - 28.3 v. mean 18.3, 95% CI 14.6 - 22.1, p=0.028) and 2011 (mean 29.3, 95% CI 25.6 - 33.1 v. mean 19.9, 95% CI 16.6 - 23.2, p=0.007).
Discussion
In the U13, U15 and U19 provincial teams, there was relativly equal representation of black (BA & C/I, ~50%) and W bowlers (~50%) between 2006 and 2012. There was also relatively similar representation between the C/I and BA bowlers. Unfortunately, it is very difficult to determine if all the players were selected purely on merit as the transformation target system stipulated a minimum of 50% representation of black players per team. To better assess this system, it is therefore important to investigate the bowling performance of these players during the tournament.
The bowling performances were assessed using two separate methods. The first investigated the bowling average of all players in the tournament, which provided an indication of the performance of the BA bowlers as a group. During 2006 and 2007 there were some significant differences between BA and the other racial groups, where BA bowling performances were worse. However, between 2008 and 2012 there were no differences in the bowling performance between BA bowlers and other racial groups. This suggests an improvement in the performances of BA players relative to the other racial groups. A reason for this could be the numerous development programmes and transformation policies implemented by CSA aimed at improving the status of cricket among black cricketers. These results are similar to the bowling performances at senior provincial cricket, where there were no significant differences between the bowling averages across races over an 8-year period.[11] From these data, we are tempted to conclude that the performances of BA bowlers are on par with the other racial groups at both a junior and senior level. However, one has to investigate the best bowlers in the tournament to provide an indication of bowling excellence.
The second method of investigating bowling performances was to report the proportion of bowlers in the top 20 (highest wickets taken). BA bowlers were consistently below the par representation mark in all years for the U15s and U19s, while often occurring below the par representation mark in the U13 age group. The BA bowlers were never above the par representation mark for any of the age groups. There are three possible reasons for this. The first is that there are a number ofgood BA bowlers participating in the provincial tournaments but few exceptional bowlers. As a result there are relatively fewer bowlers in the top 20. The second reason could be related to the fact that they have been given fewer opportunities to bowl. W bowlers, for example, generally bowled more overs in the tournaments in each age group. The bowling average data indicate that there were few differences between the racial groups yet W bowlers bowled more overs than BA bowlers. W bowlers' mean bowling averages were only significantly better than BA bowlers in 2006 in the U13 group and in 2007 in the U19 group. However, W bowlers were allowed to bowl significantly more overs than BA in 2007 in the U13, 2007 and 2010 in the U15 and 2007, 2008 and 2011 in the U19 group. BA bowlers therefore have less opportunity to take wickets and this could hinder their ability to be in the top 20 wicket takers in the tournament. The third possibility is that BA bowlers are given a chance to bowl a few overs very late in the innings. They then bowl to batsmen that are weaker (tail enders) and easier to dismiss. This could possibly explain why their bowling averages are similar yet they take fewer wickets. However, this is speculative as the information on bowling order is not available.
One of the main aims of CSA is to provide equal opportunity for all cricketers to achieve the highest level of success in the sport.[9] They therefore introduced the target policy. This policy specifies a target of a certain number of black players in provincial and national teams at senior and junior level. Committees were established to monitor the implementation of this transformation policy.[13] However, the target system becomes ineffective if BA players of equal skill are not provided with the same opportunities in matches. BA cricketers have voiced their concerns regarding this lack of opportunity.[14] In a study done by Bayer,[14] 20 BA cricketers in the Gauteng Province of SA were interviewed. It was found that 65% of these players believed that W cricketers were given better opportunities. The author reported that this perceived lack of opportunity created a feeling of despair among the BA players. Interestingly, in SA rugby at an international level, BAs had less playing time than other players,[15] suggesting a trend of providing less opportunity to BA players during matches. The possibility of racial prejudice in SA sport needs to be considered as this will in turn counteract the purpose of the development and transformation system.
Despite the lack of opportunity provided to BA bowlers at a junior provincial level in SA, they still appear to be competent at bowling. This implies merit selection of bowlers, counteracting the idea of 'window dressing' and credit should be given to CSA for achieving this. These data drastically contrast with the batting average data where BA batting averages were worse than W batsmen for every year for both U15s and U19s. The poor performance of BA batsmen at a junior level continues to the senior ranks. Therefore, it can be suggested that the lag in development is too great in batting so that the BA players are not able to catch up. Lambert[16] has expressed concern that if athletic development does not take place within specific windows of opportunity, the athlete might not be able to catch up later in their career. With the introduction of the long-term athletic development model by CSA[17] the focus is on general movement and sports skills development at an early age.[18] Less technical coaching is required at this young age (below 13 years)18 and the child's natural flair and skill largely contributes to their success as a cricketer. As the child reaches adolescence and enters secondary school, there is a greater requirement for sports specific skills to be enhanced.[18] The reliance on a coach, parents and good facilities are important during this phase of skills development. This early adolescence phase might be an important window of trainability for skill acquisition in batting but not for bowling. BAs were the worst disadvantaged group during apartheid. They did not have access to the best cricketing schools, coaches, training programmes and facilities. These important components, if missed during adolescence could have adverse effects on the development of the batsmen. This could explain the reason for the poor batting performance of BA players from the junior (U15 and U19) and through the senior ranks.
This hypothesis is supported by the fact that in the current SA national team, all specialist batsmen have attended good cricketing schools in SA. These schools are renowned for their culture of cricket, coaches and cricketing excellence. In contrast, the bowlers of the SA team did not necessarily attend this type of school. Dale Steyn, Morné Morkel and Vernon Philander are good examples. In addition, many world class international bowlers only started bowling at a late age. These include bowlers like Wes Hall, Curtley Ambrose, Dirk Nannes and Zaahir Khan.[19-24] It has been reported that Ambrose only started playing formal cricket at the age of 21.[22] On the contrary, it is almost unheard of for skilled international batsmen to have developed or started playing at such a late age. If BA bowlers were provided with the appropriate support, opportunities and coaching, they are likely to improve their bowling performances even further and could become among the best bowlers in the country.
Acknowledgements. The authors would like to thank all the coaches and coaching managers of the various provinces for their assistance with the classification of players and to Mrs Corrie Uys for her assistance with the statistics.
References
1. Human Sciences Research Council. Investigation into Education (South Africa). Report of the Main Committee. Pretoria: Human Science Research Council, 1981. [ Links ]
2. Spain D. Republic of South Africa: Unraveling the population size. Country profile. Int Demogr 1984;3(6):4-11. [ Links ]
3. Sport and Recreation South Africa. The Transformation Charter for South African Sport. http://www.srsa.gov.za/MediaLib/Home/DocumentLibrary/Transformation%20Charter%20-%20FINAL%20Aug%202012.pdf (accessed 20 August 2014). [ Links ]
4. United Cricket Board of South Africa Presentation Group. Presentation by the United Cricket Board of South Africa to the Parliamentary Portfolio Committee on Sports and Recreation, 2002. http://www.pmg.org.za/docs/2002/appendices/020903ucb.ppt (accessed 20 August 2014). [ Links ]
5. Cricket South Africa. KFC Mini Cricket, 2014. http://www.cricket.co.za/development_programs.aspx?id=3 (accessed 20 August 2014). [ Links ]
6. Padayachee V, Desai A, Vahed G. Managing South African transformation: The story of cricket in KwaZulu-Natal, 1994 - 2004. Patterns Prejudice 2004;38(3):253-278. [http://dx.doi.org/10.1080/0031322042000250457] [ Links ]
7. Cricket South Africa. CSA National Cricket Academy, 2014. http://www.cricket.co.za/development_programs.aspx?id=14 (accessed 2 September 2014). [ Links ]
8. Parliamentary Monitoring Group. SA Cricket Selection: Selectors Meeting with Cricket South Africa Minutes, 2007. http://db3sqepoi5n3s.cloudfront.net/files/docs/080226minutes.htm (accessed 1 September 2014). [ Links ]
9. Parliamentary Monitoring Group. Cricket SA: Transformation Policy: Selection of National Cricket Team. Transformation Background, 2008. http://www.pmg.org.za/files/docs/080226csa.pdf (accessed 1 September 2014). [ Links ]
10. Parliamentary Monitoring Group. Cricket South Africa on Transformation Plan, Disciplinary Process with Mr Majola, 2012. http://www.pmg.org.za/report/20120801-briefing-cricket-south-africa-transformation-plan-implementation-spor (accessed 1 September 2014). [ Links ]
11. Taliep MS. Effectiveness of the cricket transformation process in increasing representation and performance of black cricketers at provincial level in South Africa. S Afr J Sports Med 2009;21(4):156-162. [ Links ]
12. Taliep MS, Gamieldien R, West S. An analysis of the performance of black African junior provincial cricket batsmen. S Afr J Sports Med 2011;23(3):90-94. [ Links ]
13. Vahed G, Padayachee V, Desai A. Between black and white: A case study of KwaZulu- Natal Cricket Union. In: Desai A, ed. The Race to Transform Sport in Post-Apartheid SA. Cape Town: HSRC Press, 2010:222-256. [ Links ]
14. Bayer J. A phenomenological study of a sample of young Black players in the transformation process of cricket in Gauteng. MA thesis. KwaDlangezwa: University of Zululand, 2010. [ Links ]
15. Du Toit J, Durant J, Joshua J, Lambert M. Playing time between senior rugby players of different ethnic groups across all levels of South African rugby. S Afr J Sports Med 2012;24(3):81-86. [http://dx.doi.org/10.7196/sajsm.327] [ Links ]
16. Lambert M. The lack of transformation in sport and the long-term athletic development programme. S Afr J Sports Med 2010;22(3):54. [ Links ]
17. Cricket South Africa. Long-term Participation Development Programme: From Grassroots to Proteas, 2011. http://www.cricket.co.za/docs/Coaching/LTPD%20Nov%202011.pdf (accessed 1 September 2014). [ Links ]
18. Balyi I, Way R, Higgs C. Long Term Athletic Development. United States: Human Kinetics, 2013. [ Links ]
19. National Sporting Archives of Trinidad and Tobago. Wesley Windfield Hall. http://www.sportarchivestt.com/athletes/wesley-winfield-hall/ (accessed 2 September 2014). [ Links ]
20. Sports Pundit. Wes Hall. http://www.sportspundit.com/cricket/cricketers/9290-wes-hall (accessed 2 September 2014). [ Links ]
21. Journalism of Courage Archive. Curtly Ambrose, a reluctant cricketer who became a legend. http://archive.indianexpress.com/news/curtly-ambrose-a-reluctant-cricketer-who-became-a-legend/802820/0 (accessed 2 September 2014). [ Links ]
22. Ambrose C. Curtley Elconn Lynwall Ambrose. http://curtlyambrose.com/biography.php (accessed 2 September 2014). [ Links ]
23. Danakar S. Interview/Zahier Khan. Sportstar 2002;25(44):2-8. http://www.sportstaronnet.com/tss2544/25440160.htm (accessed 4 September 2014). [ Links ]
24. Nrc.nl. Skier turned cricket player boost Dutch success. 2009. http://vorige.nrc.nl/international/Features/article2265622.ece (accessed 4 September 2014). [ Links ]
Corresponding author: M S Taliep (talieps@cput.ac.za)

