


Servicios Personalizados
Articulo
 Inglés (pdf)
 Articulo en XML
 Referencias del artículo
Indicadores

Links relacionados
-
 Citado por Google
 -
 Similares en Google
Compartir

 Permalink
South African Journal of Sports Medicine
versión On-line ISSN 2078-516X
versión impresa ISSN 1015-5163
SA J. Sports Med. vol.27 no.2 Bloemfontein jun. 2015
http://dx.doi.org/10.7196/SAJSM.566
ORIGINAL RESEARCH
Movement and impact characteristics of South African professional rugby union players
J C TeeI; Y CoopooII
IMSc (Exercise Science); Department of Sport and Movement Studies, Faculty of Health Sciences, University of Johannesburg, South Africa
IIDPhil, FACSM; Department of Sport and Movement Studies, Faculty of Health Sciences, University of Johannesburg, South Africa
ABSTRACT
BACKGROUND: Global positioning system (GPS) technology can provide accurate, non-invasive, real-time movement analysis of players participating in team sports. The application of this technology to rugby union will improve training practices by allowing improved understanding of movement characteristics and more individualised programmes.
OBJECTIVES: To characterise the movement and impact patterns of South African professional rugby union players during match play and compare these to previously reported data.
METHODS: Nineteen professional rugby players were tracked using GPS systems during 24 matches during the 2013 rugby season. Players were grouped as (i) backs or forwards and (ii) tight forwards, loose forwards, scrumhalves, inside backs or outside backs. Movements were categorised in speed zones corresponding to walking (0 - 2 m.s-1), jogging (2 - 4 m.s-1), striding (4 - 6 m.s-1) and sprinting (>6 m.s-1). Walking and jogging were classified as low-intensity and striding and sprinting as high-intensity movement zones. An inbuilt triaxial accelerometer (sampling frequency 100 Hz) measured the total impacts >5G and high-intensity impacts >8G. All data were normalised to time on field and reported as mean (standard deviation).
RESULTS: There was no difference between forwards and backs in relative distance covered. Backs reached higher maximum speeds than forwards (backs 8.8 (1.1) v. forwards 7.6 (1.3) m.s-1, effect size (ES) 1.0, and outside backs were the fastest positional group (9.4 (0.9) m.s-1, ES 0.4 - 2.2). Players in all positions spent the majority of time walking (79 - 84%). Backs covered more distance than forwards in high-intensity speed zones (forwards 11 (5) v. backs 14 (4) m.min-1, ES 0.7). Tight forwards covered the most distance in low-intensity zones (63 (6) m.min-1, ES 0.3 - 1.7) while scrumhalves ran the most distance in high-intensity zones (20 (5) m.min-1, ES 1.2 - 3.6). High-intensity : low-intensity running ratios ranged from 1:13 (tight forwards) to 1:3 (scrumhalves). Loose forwards and inside backs exhibited similar movement patterns. There was no difference in impact variables between forwards and backs. Inside backs sustained the least total impacts (6.5 (1.2) >5G.min-1, ES 0.9 - 2.0) and high-intensity impacts (0.7 (0.2) >8G.min-1, ES 0.5 - 1.4).
CONCLUSIONS: There were notable differences in the movement of professional rugby union players in different positions, and effective training programmes should reflect these variations.
Rugby union is a full contact sport during which players are involved in short-duration, high-intensity efforts, which often involve high-speed collisions, interspersed by low-intensity periods of standing, walking and jogging.[1] Playing positions are individually named and reflect distinct roles within the game, but are commonly grouped with other positions with similar attributes to create designations such as 'forwards ' and 'backs, and 'tight-five, 'loose forwards, 'inside backs' and 'outside backs'.[1,2] All players are required to perform core skills such as tackling and rucking during a match, but the physical and skill demands of the playing positions are different.[1] Forwards are generally involved in actions to contest for and retain possession of the ball and are exposed to high volumes of physical contact as a result.[1,2] Backline players are regularly involved in the execution of tactical movements to gain field position or score and are able to run more freely with less contact involvements.[1,2] To ensure the conditioning and recovery programmes of the players are appropriate, it is essential to have a good understanding of the physical demands placed on players in these different positions.[3]
A number of researchers have endeavoured to quantify the physical demands of rugby union through video-based time-motion analysis (TMA).[1,2,4-6] These studies all agree that the majority of time is spent engaged in low-intensity activities for all positions, but that the nature of physical exertion differs across position groups. Researchers have previously determined that backs spend more time in low-intensity activity than forwards,[6] but also that backs spend more time sprinting than forwards.[1] When divided into four positional groups (front row forwards, back row forwards, inside backs and outside backs), back row forwards were shown to spend the greatest amount of time engaged in high-intensity activity, while inside backs covered the most total distance.[6]
Rugby union has evolved rapidly owing to intermittent law changes making it necessary to continuously re-evaluate game demands.[7] While video TMA has provided a great deal of valuable information to researchers, its practical application is somewhat limited considering the time required for coding movement events and subjectivity in the categorisation of locomotive events.[8]
The development of Global Positioning Systems (GPS) that provide accurate, non-invasive movement analysis for team sports has reduced the time required for TMA.[8] As a result, research has emerged describing the motion characteristics based on GPS of a variety of sports including rugby union, rugby sevens, rugby league, Australian football league, field hockey and football.[9]
To date, only four studies have been published describing the movement characteristics of elite professional rugby union players.[3,10-12] The first two of these, Cunniffe et al.[3] and Coughlan et al.,[10] used similar methodology: tracking a single forward and a single back during an international rugby union match. The results were similar: players covered >6 500 m in both studies and the backs performed a greater number of high-intensity runs and reached greater maximal speeds than the forwards did. A major limitation of both of these preliminary studies is that they observed only two players on single occasions, and as such it is difficult to generalise this information. Reid et al.[12] examined eight players from different positions in a single match and reported a range of relative running distances from 67.0 to 78.2 m.min-1. Furthermore, they reported that backs covered the most distance walking, while forwards covered the most distance jogging.[12] Cahill et al.[11] provided a comprehensive study that observed players from a variety of English Premiership clubs over the course of a season. They showed that although all players covered relatively little distance while sprinting, loose forwards sprinted the most. Furthermore it was shown that backs covered greater relative distances than forwards, scrumhalves covered the greatest total distance and tight forwards the least.[11]
The validity and reliability of the SPI-Pro GPS unit (GPSports, Australia) has been previously established.[8,13] In particular, the validity for speed zones walking (standard error ofestimate (SEE) 1.0% (0.4%)), jogging (SEE 3.7% (1.4%)) and striding (SEE 3.0% (1.1%)) is strong.[13] The validity of distance measures in sprint zones (>5 m.s-1) is less accurate (SEE 10.5% (3.9%)), typically underestimating sprint distance and should be interpreted carefully.[13] GPS units have been shown to reliably measure peak velocity (coefficient of variation (CV) 2.3, 90% confidence interval (CI) 2.1 - 6.6).[8] This indicates that absolute sprint counts may be more accurate as a measure of high speed exertion than high-speed running distance.
GPS is a powerful tool for analysis of movement characteristics, but is unable to record time or effort spent in static exertions. Deutsch et al.[2] reported that forwards spend approximately 10 minutes per match engaged in static, high-contact activities like tackling, scrumming, rucking and mauling. These activities will not be recorded by GPS monitoring but make up a significant portion of game exertion. Physical contact has been shown to lead to reductions in total, low-intensity and high-intensity running v. non-contact games.[14]
In an attempt to quantify these additional loads, manufacturers of GPS devices have included a triaxial accelerometer to measure impact forces. The validity of these accelerometer measures has not been established. Waldron et al.[15] showed the reliability of accelerometer measures to be disappointing (CV 4.7 - 5.2%). Interpretation of accelerometer data is complicated because acceleration peaks result from a variety of actions including foot strikes, running, jumping, falling, tackling and rucking. Researchers have not shown any correlation between high-intensity impacts and collision events like tackles during rugby league matches.[16] Despite this, research has shown correlations between high-intensity impacts (>8G) and markers of muscle damage[17], as well as neuromuscular markers of post-match fatigue[16] in rugby league. Accelerometer data have not previously been reported in elite rugby union competitions, and may be of some value in terms of quantifying physical impacts sustained and planning recovery strategies.
Rugby union is thought to display variations in the pace of the game played in different hemispheres as a result of differing playing conditions and styles. This assertion is supported by statistics comparing the Six Nations and Tri Nations competitions, the premier international competitions in each hemisphere. Analysis of these competitions from 2008 to 2011 indicates that the ball is in play for more time per match in Six Nations matches (49 v. 45%).[18] The objective of this study was therefore to provide normative data for movement and impact characteristics of player's participation in South Africa (SA)'s elite professional rugby competitions and to compare these data with previous research from other countries.
Methods
Participants
A prospective, observational, longitudinal design was used to assess the movement and impact characteristics of players from an SA professional rugby union team. Players were invited to participate in the study for the duration of the 2013 rugby season; participation was voluntary but endorsed by the management and medical staff of the team. Players who volunteered to participate in the study signed informed consent. In total 19 players (mean (standard deviation (SD)) age 26 (2) years; body mass 101.5 (12.2) kg, stature 1.86 (0.07) m) volunteered. The University of Johannesburg ethical review board approved the study.
Player grouping
Players were grouped according to two different classification systems, neither of which is mutually exclusive, to allow for analysis of different positional attributes. Firstly, players were grouped as either forwards (props, locks, hooker, flanks and eighth man) or backs (scrumhalf, flyhalf, centres, wings and fullback). Secondly, players were assigned to one of five positional groups: tight forwards (props and locks), loose forwards (hooker, flanks and eighth man), scrumhalf, inside backs (flyhalf and centres) and outside backs (wings and fullback), as previously described.[5,6] Data were examined to check the validity of these groupings and were found to be accurate.
Procedures
All matches took place between March and October 2013 during the local rugby season and were part of senior professional domestic competitions. Players wore individual SPI Pro GPS units (GPSports, Australia) (mass = 76 g; size = 87 x 48 x 20 mm) positioned between the shoulder blades and supported by an elasticised harness worn underneath the playing jersey. The GPS unit sampled positioning data at a frequency of 5 Hz and contained a triaxial accelerometer that sampled at 100 Hz.
Players were familiarised with the use of the GPS units at practice sessions before using them in matches. The strength and conditioning coach of the team assigned and fitted the GPS units on match days. There were insufficient units and harnesses for all players to wear at once, so units were rotated among players in each of the five position groups and according to the monitoring needs of the coaching staff. Units were switched on before the warm-up, which started ~45 minutes before kick-off, to ensure that the satellite signal was received.
After each match, the GPS data files were downloaded to a personal computer and the data analysed using Team AMS software version 10 (GPSports, Australia). The raw data files were segmented into 1st and 2nd halves, to exclude the time recorded during half time, and then exported to Microsoft Excel (Microsoft Corp, USA). 1st and 2nd half data were then combined to determine whole-game exertions. Three files were excluded because players hadn't spent a sufficient amount of time on the field (<30 minutes, which was outside 2 SDs from the mean). A total of 102 match participation files from 24 separate matches were analysed in the following positional distribution: forwards (n=53), backs (n=49), tight forwards (n=23), loose forwards (n=30), scrumhalves (n=8), inside backs (n=12) and outside backs (n=29).
Movement and impact analysis
The dependent variables for this study were total distance (m) covered, maximum speed (m.s-1) attained, distance covered in differentiated speed zones (walking, 0 - 2 m.s-1; jogging, 2 - 4 m.s-1; striding, 4 - 6 m.s-1; and sprinting, >6 m.s-1). These speed zones were chosen because they are typical of the locomotive activity profiles of intermittent team sport athletes.[19] Data were normalised to the amount of time spent on the field to account for different playing times as a result of player substitutions. This is a departure from the subject-relative velocity measures employed by Cahill et al.,[11] but allows for comparison within and between sporting codes. In addition, two broader speed zones (low-intensity running, 0 - 4 m.s-1 and high-intensity running, >4 m.s-1) were calculated to allow for the calculation of a high:low intensity running ratio. In addition, proportion of time spent in each speed zone was calculated. Because peak velocity measurements have been shown to be more accurate than measures of distance covered at high speed,[8,13] sprint and maximal acceleration counts were included to support analysis of high-speed running distance. These are reported as frequencies (1 every N min). A sprint was defined as each time a player reached a speed >6 m.s-1, and a maximal acceleration was defined as any acceleration > 2.75m.s-2. This acceleration corresponds to a change in speed of 10 km.h-1 in a 1 second interval. Accelerometer data were recorded as the total number of impacts >5G and total high-intensity impacts >8G, and normalised to playing time. Time on field statistics are reported to allow for calculation of total work volumes.
Statistical analysis
Data were analysed using SPSS version 21 (IBM, USA) analysis software. Shapiro-Wilk tests were performed on all dependent variables to test the assumption of normality; the majority of variables (60%) did not satisfy this assumption. Data were visually assessed using Normal Q-Q plots and were found to be similarly, and only moderately, skewed. A decision was taken to proceed with parametric tests due to the robustness of the particular tests used in dealing with deviations from normality, particularly in the presence oflarge sample sizes (>50) and similar sized sample groups. Forwards and backs were compared using an independent samples t-test. A Levene's test was applied to the five positional groups to assess homogeneity of variance. The majority of variables were normally distributed and in these cases were assessed by one-way analysis of variance (ANOVA) and Tukey's post hoc test. In cases where data were not normally distributed, a Welch robust test for equality of means and Games-Howell post hoc test were applied to discern differences between groups. Descriptive statistics (mean (SD)) were calculated for all variables, and the level of significance was set at p<0.05 for all tests. In addition, due to the practical nature of this study, Cohen's effect size statistic was calculated to determine the practical significance of observed differences. Effect sizes (ESs) of 0.2, 0.5, 0.8 and 1.2 were considered small, medium, large and very large respectively.[20]
Results
Movement analysis
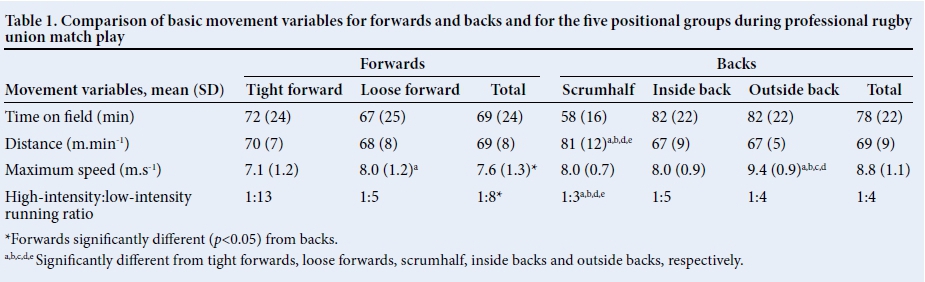
Analysis of basic movement parameters for forwards and backs and for the five positional groups is presented in Table 1. There was no significant difference in the relative distance covered during competitive match play between forwards and backs (forwards 69 (8) v. backs 69 (9) m.min-1). Positional group analysis revealed that scrumhalves cover a significantly greater distance during match play than all other positional groups (81 (12) m.min-1, ES 0.5 - 1.4). Backs had greater maximum speed compared to forwards (backs 8.8 (1.1) v. forwards 7.6 (1.3) m.s-1, ES 1.0). This can be accounted for by the presence of the outside backs in this group who were significantly faster (9.4 (0.9) m.s-1, ES 0.4 - 2.2) than all other positional groups.
The relative distances covered by backs and forwards in each of the four speed zones are presented in Fig. 1, and a similar analysis by positional group is presented in Fig. 2.
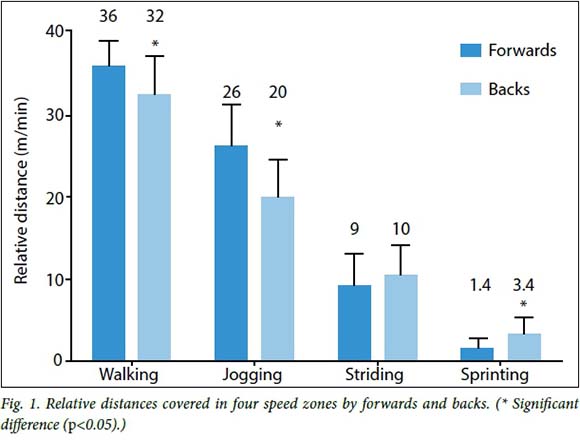
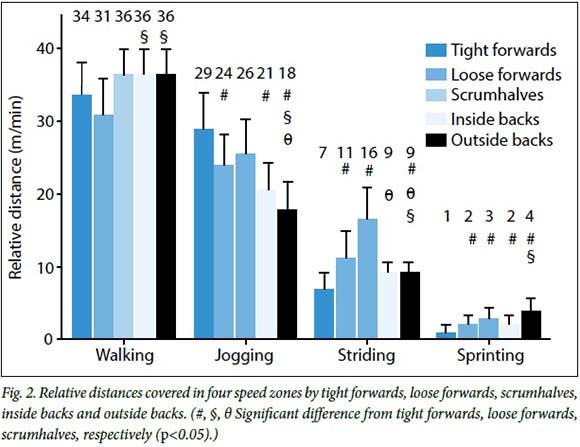
Forwards distinguished themselves by covering significantly more distance while walking (forwards 36 (3) v. backs 32 (5) m.min-1, ES 0.9) and jogging (forwards 26 (5) v. backs 20 (5) m.min-1, ES 1.3) than backline players, while backs covered twice as much distance as forwards while sprinting (backs 3.4 (2.0) v. forwards 1.4 (1.3) m.min-1, ES 1.2). Positional analysis revealed that loose forwards walked the least distance (31 (5) m.min-1, ES 0.6 - 1.2), which was significantly less than inside and outside backs. Tight forwards jogged the most distance (29 (5) m.min-1, ES 0.7 - 2.6), significantly more than loose forwards, inside and outside backs. Outside backs jogged the least distance (18 (4) m.min-1, ES 0.8 - 2.6). There was no difference in distance covered striding between forwards and backs. Scrumhalves covered the most distance (16 (5) m.min-1, ES 1.4 - 3.2) striding, significantly more than every other group except loose forwards. The loose forwards also out performed the tight forwards and outside backs in this speed zone (11 (4) m.min-1, ES 0.6 - 1.4). Outside backs performed the most sprinting (4 (2) m.min-1, ES 0.4 - 2.5), covering significantly more distance than tight forwards, loose forwards and inside backs in this category. Tight forwards performed the least sprinting, covering just 1 (1) m.min-1 (ES .1 - 3.3) in this speed category.
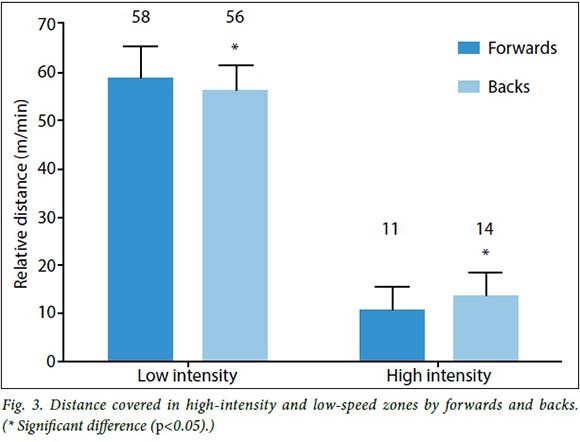
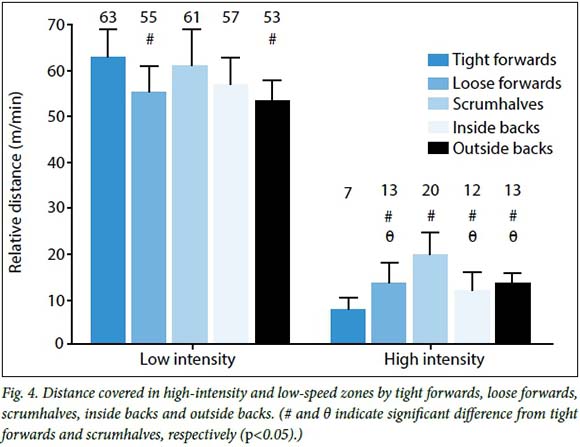
High- and low-intensity running
The time spent in low- and high-intensity running zones for backs and forwards is shown in Fig. 3, and for positional groups in Fig. 4. These results were used to calculate average high-intensity:low-intensity running ratios, which are presented in Table 1. Analysis revealed that forwards cover more distance than backs in low-intensity ranges (forwards 58 (7) v. backs 56 (6) m.min-1, ES 0.4), while backs cover more distance in high-intensity ranges (forwards 11 (5) v. backs 14 (4) m.min-1, ES 0.7). Accordingly, the high-intensity:low-intensity running ratio was approximately 1:8 for forwards and 1:4 for backs. This indicates that forwards cover double the low-intensity distance for each high-intensity run than backs do. Tight forwards perform the greatest amount of low-intensity running (63 (6) m.min-1, ES 0.3 - 1.7), significantly more than loose forwards and outside backs. They also perform the least high-intensity running (7 (3) m.min-1, ES 1.1 - 3.6), significantly less than all other position groups. Tight forwards thus have the greatest high-intensity:low-intensity running ratio (1:13). Scrumhalves perform the most high-intensity running (20 (5) m.min-1, ES 1.2 - 3.6) and the second most low-intensity running (61 (8) m.min-1, ES 0.3 -1.0). Scrumhalves have the smallest high-intensity:low-intensity running ratio (1:3).
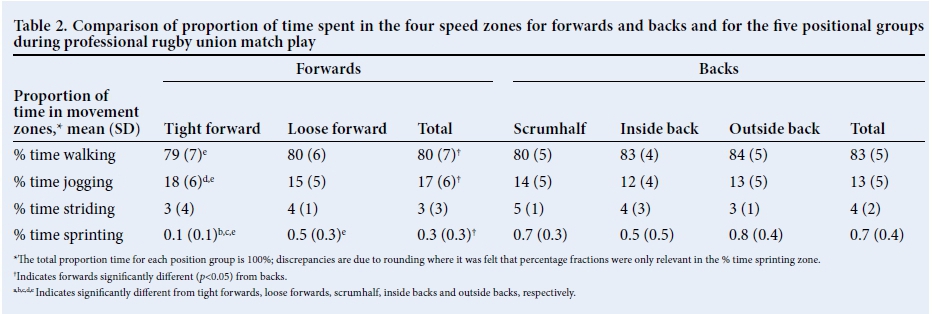
Proportion of time spent in speed zones
The majority of playing time (79 - 84%) was spent walking for all positions. Backs spent a significantly greater portion of time walking (forwards 80% (7%) v. backs 83% (5%), ES 0.6) and sprinting (forwards 0.3% (0.3%) v. backs 0.7% (0.4%), ES 1.1) than forwards did (Table 2). Forwards spent more time jogging than backline players (forwards 17% (6%) v. backs 13% (5%), ES 0.7). Tight forwards were a unique positional group, spending the most time jogging (18% (6%), ES 0.5 - 1.0), and the least time walking (79% (7%), ES 0.3 - 0.8) and sprinting (0.1% (0.1%), ES 1.1 - 3.6). There was no significant difference between any position groups for time spent striding, but scrumhalves spent the most time in this speed zone (5% (1%), ES 0.6 - 1.2). Outside backs spent significantly more time sprinting (0.8% (0.4%), ES 0.2 - 2.3) than tight and loose forwards.
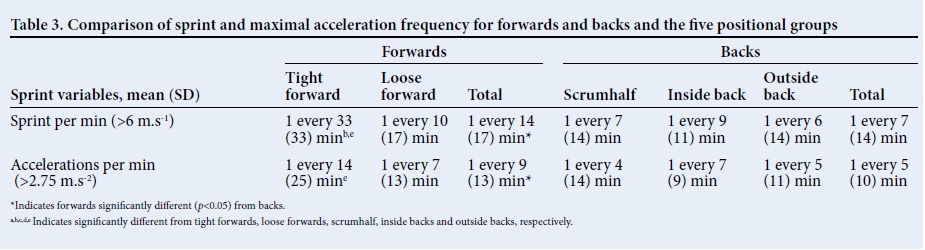
Sprint and acceleration characteristics
Analysis of sprint and acceleration frequency is shown in Table 3. Backs reached sprint velocity twice as often as forwards (backs 1 every 7 (14) minutes v. forwards 1 every 14 (17) minutes, ES 1.1). Backs also performed maximal accelerations 1.5 times more often than forwards did (backs 1 every 5 (10) minutes v. forwards 1 every 9 (13) minutes, ES 1.1). Notably, all players were involved in acceleration actions 30 - 40% more often than they were involved in sprint actions. Inside and outside backs were the positions most frequently involved in both sprint and acceleration actions. Tight forwards participated the least frequently in sprint and acceleration actions.
Impact characteristics
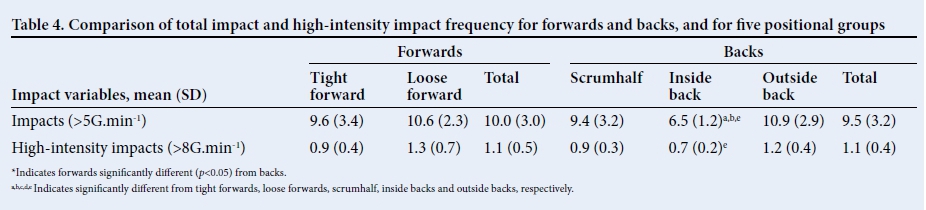
There was no difference in the total number of impacts (backs 9.5 (3.2) v. forwards 10.0 (3.0) >5G.min-1, ES 0.2) or high-intensity impacts (backs 1.1 (0.4) v. forwards 1.1 (0.5) >8G.min-1, ES 0.0) between backs and forwards. Inside backs experienced significantly less total impacts (6.5 (1.2) >5G. min-1, ES 0.4 - 2.0) than tight forwards, loose forwards and outside backs. Inside backs also experienced the fewest high-intensity impacts (0.7 (0.2) >8G.min-1, ES 0.5 - 1.4). Though not statistically significant, loose forwards experienced the most total (10.6 (2.3) >5G.min-1, ES 0.5 - 2.0) and high-intensity impacts (1.3 (0.7) >8G.min-1, ES 0.2 - 1.0).
Discussion
This analysis of the movement and impact characteristics of players participating in professional rugby union competitions is the first of its kind to be performed in SA. This research provides valuable comparison with research on players from other countries.
The first major finding of this research is that there was no significant difference in the distances covered relative to time on field between forwards and backs. This result is in contrast with previous research,[3,10-12] which has reported backs covering a higher amount of relative distance than forwards. Notably, these previous studies have also reported higher relative speeds for backs than the present study, while the relative distance covered by forwards was comparable. These differences may reflect differences in ball-in-play time between competitions or differences in playing style of the teams studied. A greater emphasis on forward play could lead to limited opportunities for backline players, while an increased number of kicks could increase backline player involvement.
The results of the movement characteristic analysis in this study tend to agree with those that have been previously reported;[2,5,6,11] the game is played mostly at low speed with players spending the majority of their time standing, walking or jogging. Notably, the forwards covered more distance in low-intensity movement zones, while backs covered more distance in high-intensity movement zones. This most likely reflects the influence of positional requirements, where forward players typically contest possession of the ball at close quarters, while backs await possession in wider areas giving them more opportunity and space in which to run.[2] Positional analysis revealed that scrumhalves covered the most distance overall (81 (12) m.min-1, ES 0.5 - 1.4) and the most distance in high-intensity running zones (20 (5) m.min-1, ES 1.2 - 3.6). These results are similar to those of Cahill et al.,[11] although they reported a lower overall distance covered (median 78.5 m.min-1, interquartile range (IQR) 7.2). These results reflect scrumhalves' unique role in the game where they keep pace with play in order to distribute possession, and as a result are in possession of the ball most often.[2,5,6]
Outside backs were the most accomplished sprinters, attaining the greatest maximum speed (9.4 (0.9) m.s-1, ES 0.4 - 2.2), covering the most distance sprinting (4 (2) m.min-1, ES 0.4 - 1.2) and performing sprints (1 every 6 minutes) and maximal accelerations (1 every 5 minutes) more often than other positions. Outside backs also spent more time walking (84 (5)%, ES 0.1 - 0.8) than other position groups. Cahill et al.[11] also reported outside backs attaining the greatest maximum speed (median 8.8 m.s-1, IQR 0.9), and that outside backs spent the most time walking (median 51.9%, IQR 10.3).
Tight forwards spent more time (18 (6)%, ES 0.5 - 1.0) and covered more distance (29 (5) m.min-1, ES 0.7 - 2.6) jogging than any other positional group. Cahill et al.[11] also reported that tight forwards spend the most time jogging (median 49.5%, IQR 7.4). In match play, tight forwards primary responsibility is in contesting and retaining possession,[2] a role that results in a great deal of physical contact in scrums, rucks and mauls. As such, tight forwards may be placed at a disadvantage when it comes to attaining high speeds, due to the highly fatiguing nature of these involvements. Johnston et al.[14] have shown that physical contact reduces high-intensity running during game play, and conditioning programmes for tight forwards should reflect this.
Despite falling into different positional groups (backs and forwards), analysis revealed the movement characteristics of loose forwards and inside backs to be similar. There were no significant differences in distance covered jogging (loose forward 24 (4) v. inside back 21 (4) m.min-1, ES 0.8), striding (loose forward 11 (4) v. inside back 9 (3) m.min-1, ES 0.6) or sprinting (loose forward 2 (1) v. inside back 2 (2) m.min-1, ES 0.2) for these two groups. Loose forwards did walk significantly less than inside backs (loose forward 31 (5) v. inside back 36 (4) m.min-1, ES 1.2). Time spent in various speed zones and overall high-intensity:low-intensity running ratio was the same for loose forwards and inside backs. These results indicate that the typical strategy of grouping forwards and backs during training is most likely wrong. It may be more prudent to group tight forwards, loose forwards and inside backs, scrumhalves, and outside backs for training. Scrumhalves have highly unique positional requirements and should have specialised programmes that reflect this.
Analysis of accelerometer data revealed that there was no difference in the number of total (backs 9.5 (3.2) v. forwards 10.0 (3.0) >5G.min-1, ES 0.1) or high-intensity impacts (backs 1.1 (0.4) v. forwards 1.1 (0.5) >8G.min-1, ES 0.0) between backs and forwards. It was notable however that loose forwards (1.3 (0.7) >8G.min-1, ES 0.2 - 1.0) and outside backs (1.2 (0.4) >8G.min-1, ES 0.2 - 1.4) were the positions most likely to be involved in high-intensity impacts. These results may reflect the greater speeds that outside backs are capable of, resulting in a preponderance of high-speed collisions. Forwards are typically involved in a higher number of tackles and rucks than other positions,[2] which may result in a greater number of high-intensity impacts. Accelerometer measures have been shown to be reasonably reliable,[15] while validity of these measures is still to be established. They are reported here to provide normative data for practitioners using these GPS devices.
Overall, the results of this research tend to agree with those of Cahill et al.'s[11] research into English Premiership rugby teams. A notable exception to this is the difference in relative distance covered by backs and forwards found by Cahill et al.[11], which was not found here. Further comparisons between the two studies are impeded by differences in methodology of measurement. Cahill et al.[11] chose to use subject relative speed bands based on percentages of each player's observed maximum speed during match play. Our study chose to use objective speed criteria. Generally, the proportion of distance covered and time spent in each speed zone was similar for the two studies, but Cahill et al.[11] reported greater absolute values. The authors would speculate that these absolute differences are as a result of differences in ball in play time, but further research is required.
Study limitation
A limitation of this study was that it only examined one team, with multiple measures performed on the same players. Cahill et al.[11] were able to collect data from eight different teams. As a result of this, some of the results reflected here will be accounted for by team tactics and prevailing playing conditions. There is scope to extend this type of analysis to more teams and to include measurements of static work such as scrumming and lifting that is not revealed by GPS analysis.
Conclusion
This investigation has highlighted the variation in movement patterns in professional rugby union players playing in different positions. Coaches and strength and conditioning programme designers should be aware of these variations when planning. Training programmes should as far as possible be specialised and reflect the running intensities and frequencies of sprints and acceleration that are present for each positional group during match play.
Acknowledgements. The players and coaching staff of the Golden Lions Rugby Union are thanked for their cooperation in this research project. This project was partially funded by the National Research Foundation, and thanks go to them for their continued support.
References
1. Duthie G, Pyne D, Hooper S. Applied physiology and game analysis of rugby union. Sports Med 2003;33(13):973-991. [http://dx.doi.org/10.2165/00007256-200333130-00003] [ Links ]
2. Deutsch MU, Kearney GA, Rehrer NJ. Time motion analysis of professional rugby union players during match-play. J Sports Sci 2007;25(4):461-472. [http://dx.doi.org/10.1080/02640410600631298] [ Links ]
3. Cunniffe B, Proctor W, Baker JS, Davies B. An evaluation of the physiological demands of elite rugby union using global positioning system tracking software. J Strength Cond Res 2009;23(4):1195-1203. [http://dx.doi.org/10.1519/JSC.0b013e3181a3928b] [ Links ]
4. Quarrie KL, Hopkins WG, Anthony MJ, Gill ND. Positional demands of international rugby union: Evaluation of player actions and movements. J Sci Med Sport 2013:16(4):353-359. [http://dx.doi.org/10.1016/j.jsams.2012.08.005] [ Links ]
5. Duthie G, Pyne D, Hooper S. Time motion analysis of 2001 and 2002 Super 12 rugby. J Sports Sci 2005;23(5):523-530. [http://dx.doi.org/10.1080/02640410410001730188] [ Links ]
6. Roberts SP, Trewartha G, Higgitt RJ, El-Abd J, Stokes KA. The physical demands of elite English rugby union. J Sports Sci 2008;26(8):825-833. [http://dx.doi.org/10.1080/02640410801942122] [ Links ]
7. Quarrie KL, Hopkins WG. Changes in player characteristics and match activities in Bledisloe Cup rugby union from 1972 to 2004. J Sports Sci 2007:25(8):895-903. [http://dx.doi.org/10.1080/02640410600944659] [ Links ]
8. Coutts AJ, Duffield R. Validity and reliability of GPS devices for measuring movement demands of team sports. J Sci Med Sport 2010;13(1):133-135. [http://dx.doi.org/10.1016/j.jsams.2008.09.015] [ Links ]
9. Cummins C, Orr R, O'Connor H, West C. Global positioning systems (GPS) and microtechnology sensors in team sports: A systematic review. Sports Med 2013;43(10):1025-1042. [http://dx.doi.org/10.1007/s40279-013-0069-2] [ Links ]
10. Coughlan GF, Green BS, Pook PT, Toolan E, O'Connor SP. Physical game demands in elite rugby union: A global positioning system analysis and possible implications for rehabilitation. J Orthop Sports Phys Ther 2011;41(8):600-605. [http://dx.doi.org/10.2519/jospt.2011.3508] [ Links ]
11. Cahill N, Lamb K, Worsfold P, Headey R, Murray S. The movement characteristics of English premiership rugby union players. J Sports Sci 2013;31(3):229-237. [http://dx.doi.org/10.1080/02640414.2012.727456] [ Links ]
12. Reid LC, Cowman JR, Green BS, Coughlan GF. Return to play in elite rugby union: Application of global positioning system technology in return-to-running programs. J Sport Rehabil 2013;22(2):122-129. [ Links ]
13. Petersen C, Pyne D, Portus M, Dawson B. Validity and reliability of GPS units to monitor cricket-specific movement patterns. Int J Sports Physiol Perform 2009;4(3):381-393. [ Links ]
14. Johnston RD, Gabbett TJ, Seibold AJ, Jenkins DG. Influence of physical contact on pacing strategies during game-based activities. Int J Sports Physiol Perform 2014;9(5):811-816. [http://dx.doi.org/10.1123/ijspp.2013-0424] [ Links ]
15. Waldron M, Worsfold P, Twist C, Lamb K. Concurrent validity and test-retest reliability of a global positioning system (GPS) and timing gates to assess sprint performance variables. J Sports Sci 2011;29(15):1613-1619. [http://dx.doi.org/10.1080/02640414.2011.608703] [ Links ]
16. McLellan CP, Lovell DI. Neuromuscular responses to impact and collision during elite rugby league match play. J Strength Cond Res 2012;26(5):1431-40. [http://dx.doi.org/10.1519/jsc.0b013e318231a627] [ Links ]
17. McLellan CP, Lovell DI, Gass GC. Performance analysis of elite rugby league match play using global positioning systems. J Strength Cond Res 2011;25(6):1703-1710. [http://dx.doi.org/10.1519/JSC.0b013e3181ddf678] [ Links ]
18. International Rugby Board. IRB Game Analysis Reports 2011. Dublin: International Rugby Board, 2011. http://www.irbplayerwelfare.com/?documentid=76 (accessed 13 November 2014). [ Links ]
19. Dwyer DB, Gabbett TJ. Global positioning system data analysis: Velocity ranges and a new definition of sprinting for field sport athletes. J Strength Cond Res 2012;26(3):818- 824. [http://dx.doi.org/10.1519/JSC.0b013e3182276555] [ Links ]
20. Hopkins WG, Marshall SW, Batterham AM, Hanin J. Progressive statistics for studies in sports medicine and exercise science. Med Sci Sports Exerc. 2009;41(1):3-13. [http://dx.doi.org/10.1249/MSS.0b013e31818cb278] [ Links ]
Corresponding author: J C Tee (jasonctee@gmail.com)

