


Serviços Personalizados
Artigo
 Inglês (pdf)
 Artigo em XML
 Referências do artigo
Indicadores

Links relacionados
-
 Citado por Google
 -
 Similares em Google
Compartilhar

 Permalink
South African Journal of Sports Medicine
versão On-line ISSN 2078-516X
versão impressa ISSN 1015-5163
SA J. Sports Med. vol.27 no.1 Bloemfontein 2015
http://dx.doi.org/10.7196/SAJSM.565
ORIGINAL RESEARCH
Dynamic plantar pressure profiles of South African university students
M KramerI; R du RandtIII; D VenterII
IMA, BA (HMS) Hons (Biokinetics), PhD; Department of Human Movement Science, School of Lifestyle Sciences, Nelson Mandela Metropolitan University, Port Elizabeth, South Africa
IIPhD;Department of Statistics, School of Computer Science, Mathematics, Physics and Statistics, Nelson Mandela Metropolitan University, Port Elizabeth, South Africa
IIIPhD; Department of Human Movement Science, School of Lifestyle Sciences, Nelson Mandela Metropolitan University, Port Elizabeth, South Africa
ABSTRACT
BACKGROUND: Footscan technology allows for assessment of injury risk and walking mechanics, yet there is a dearth of normative data pertaining to the normal, injury-free foot in a South African (SA) context.
OBJECTIVE: To generate normative tables from plantar pressure profile data gathered from students at an SA university.
METHODS: The RS Footscan (RSscan, Belgium) system was used to measure the plantar pressure values of the foot. Ten anatomical landmarks of the foot were analysed: the hallux, lateral toes, five metatarsal heads, midfoot, and medial and lateral heel. These ten areas were grouped into one of three regions: forefoot, midfoot and heel. A total of 180 participants were subdivided as follows: gender (males, n=90; females, n=90); race (black, n=60; white, n=60; coloured, n=60). Each race group comprised 30 males and 30 females.
RESULTS: Of the ten individual plantar pressure areas, the second and third metatarsal heads demonstrated the highest mean peak plantar pressure values. Of the three regions, the heel region was ascribed with the largest plantar pressure values. Black females, coloured males and coloured females yielded the highest pressure values, especially under the midfoot region of the foot. Black and white males and white females exhibited the lowest pressure under the foot, especially under the midfoot region.
CONCLUSION: The plantar pressure profile data generated in this study could serve to provide clinicians with a frame of reference when evaluating participants within the age range of 18 - 30 years.
The literature is extensive with information and research on the key factors affecting foot pressure and foot structure during dynamic activities such as walking and running, including gender, race, age, height, weight, body mass index, walking speed and physical activity.[1-6] However, internationally, there is a dearth of reference data pertaining to normal, injury-free population groups. This is compounded by the general absence of normative data and a lack of controlled, structured and standardised procedures for clinical profiles across diverse gender and race groups.
The structure and function of the foot is of critical importance during weight-bearing activities, such as walking, running, jumping and cycling.[7] This is primarily because the entire lower extremity composes a closed kinetic chain; therefore, a change in foot and ankle structure has an effect not only on the foot and ankle, but also on superincumbent joints such as the knee, hip and lower back.[8] A change in dynamic foot structure and subsequent foot pressure may therefore lead to a higher incidence of injury.[1·4·8·9]·
Research has demonstrated that the most common joint injuries sustained are those of the ankle and knee, and that these injuries occur mostly in the 15 - 24-year age category, especially in the male population (1.53/1 000 person-years).[9-11] Interestingly, Waterman et al.[10]found that, among other factors, more than half of ankle injuries were attributed to stair falls or walking on a level surface; the remainder was attributed to athletic activities. In the same study, it was established that black and white race groups were associated with substantially higher incidence rates of injuries compared with coloured population groups, with most injuries in the male population.[9]
The potential risk of injury related to foot and ankle biomechanics is a reality whether during activities of daily living or athletic endeavours. This substantiates the importance of accurately and reliably measuring plantar pressure values of normal, injury-free population groups in order to establish reference data for clinical settings. Reference tables would serve to provide clinicians and practitioners with the tools to define patients into appropriate categories and possibly identify those participants with a higher propensity for injury.
The present study was therefore initiated to help address this need by determining plantar pressure profiles of a normal, injury-free student population representative of a South African (SA) university.
Method
A total of 180 participants (90 male, 90 female) were recruited for the present study through the university's intranet network and posters. Participation was voluntary and anonymous. The research ethics committee of the university granted approval for the study (REC-H: H10HEAHMS003). The mean (standard deviation (SD)) anthropometric data of the group were: age 22.2 (2.9) years; weight 67.0 (12.0) kg; height 169.7 (8.9) cm; and body mass index (BMI) 23.2 (3.2) kg.m-2. There was a total of 30 male and 30 female participants per representative race group (black, white and coloured). For inclusion in the present study, participants had to be between the ages of 18 and 30 years, have no history of lower extremity injury or surgery, and fall within a BMI range of 18.0 - 30.0 kg.m-2.
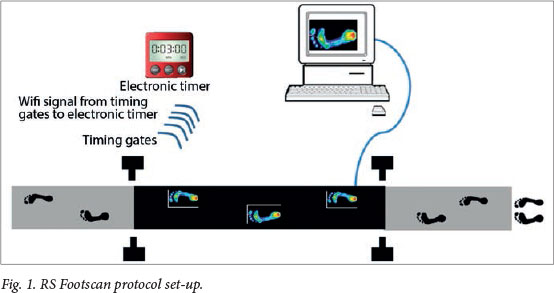
Four data-collecting instruments were utilised in the study, namely the completion of a questionnaire, and measurements of height, weight and plantar pressure. The questionnaire obtained biographical information and medical history. The questionnaire helped to identify participants not suitable for the study. Height measurements were performed using the Holtain Stadiometer (Holtain Ltd, UK); weight measurements were taken using the calibrated Scalemaster Medical Electronic scale (Weigh Tech Co. Ltd, China). The equipment used for the purposes of plantar foot pressure measurement was the RS Foot-scan system (RSscan, Belgium). The latter system runs on a data acquisition frequency of up to 500 Hz as subjects perform trials at a walking pace. Walking speed was controlled for by using timing gates; therefore, only trials that fell within the speed limit of1.3 - 1.5 m.s-1 were saved for analysis. Initial contact would be identified by the force plate when at least three sensors were activated at a resultant force level of >5 N (as per user manual for RS Footscan). A 12-bit analogue-to-digital (AD) conversion was used, thereby providing each sensor with a resolution of 0.5 N and a maximum measuring range of1 - 127 N/cm-2.
Participants performed five trials to familiarise themselves with the equipment and the testing procedure (Fig. 1). A total of 10 successful walking trials per participant was then recorded and saved for analysis. Each trial yielded three footprints, thus a total of 30 footprints (15 left feet and 15 right feet) were used for analysis per participant. Left and right foot data were included to assess gait symmetry; discrepancies between values obtained for the left and right feet could indicate clinical relevance.
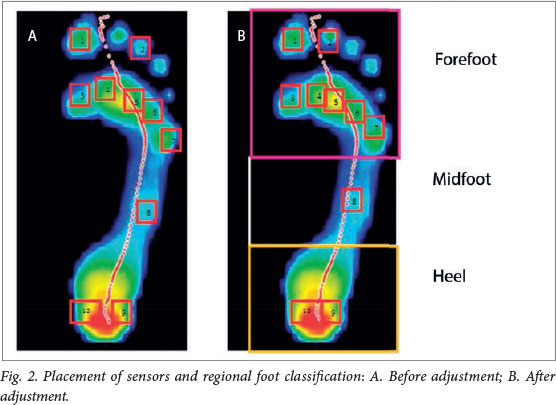
The RS Footscan software divides the footprint into ten anatomical areas for analysis, namely the hallux (great toe), lateral toes, metatarsal 1 - 5, midfoot, medial heel and lateral heel. A complex algorithm places these ten sensor areas of equal size at predetermined areas of the recorded footprint, which may not always be entirely accurate (Fig. 2A), requiring the adjustment of sensor recording to be executed manually for each of the ten anatomical areas for each footprint for all participants (Fig. 2B). Each change recorded was saved to represent more accurately the ten anatomical landmarks. These ten anatomical landmarks were then further grouped into three categories, namely the forefoot, midfoot and heel to allow for comparison with the literature, and for ease of reference in terms of foot structure (Fig. 2B). The forefoot category comprised the hallux, lateral toes and all ive metatarsal sensors, the midfoot category comprised the midfoot pressure sensor only, and the heel category comprised the lateral and medial heel sensors (Fig. 2).
Although pressure values are expressed as N.m-2, this study, as well as most others, represented plantar pressure values as N.cm-2 owing to the small size of the sensors and anatomical landmarks.[5,12]
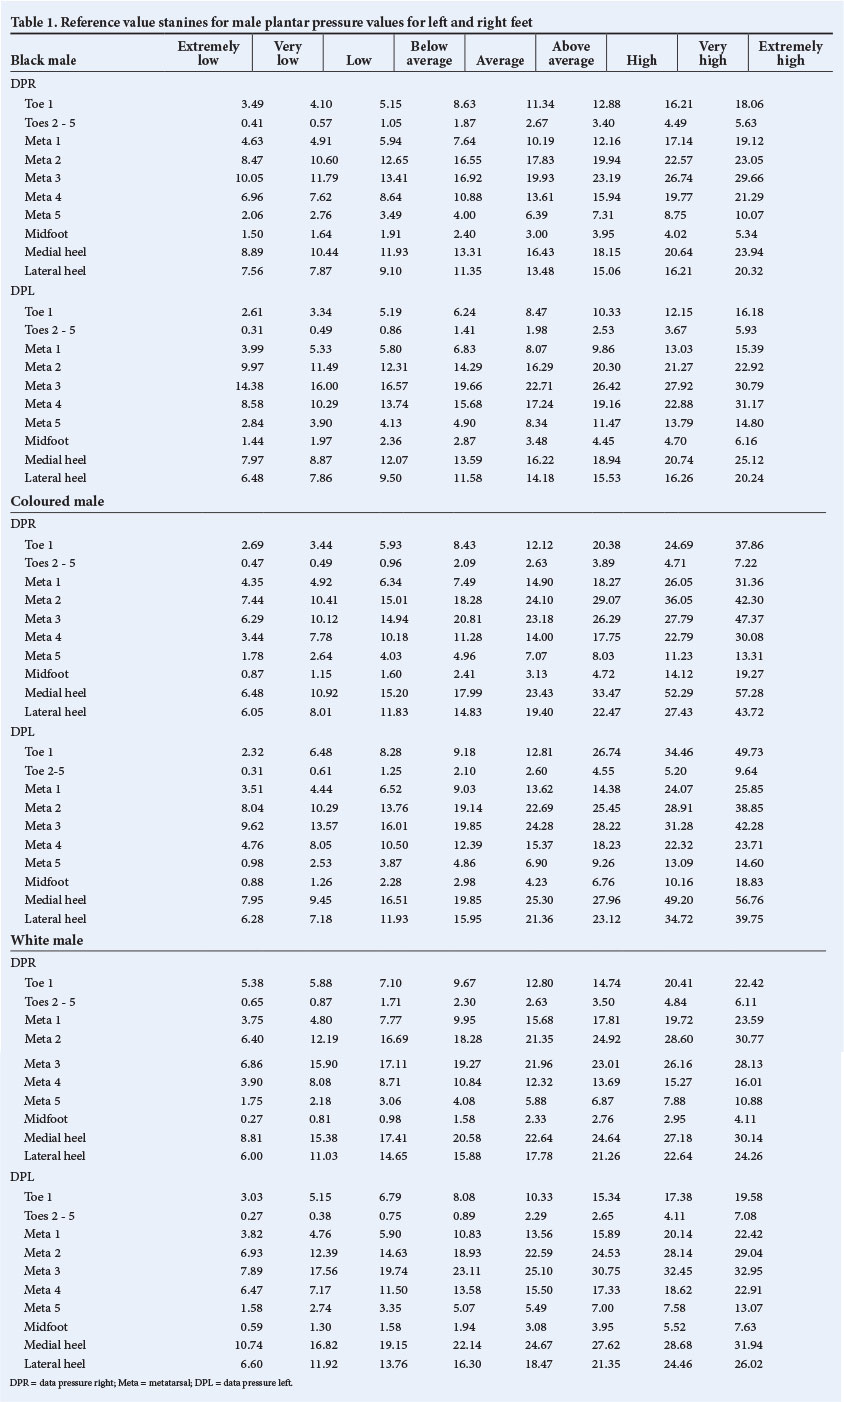
To meet the primary objective of the present research, reference data in the form of stanine tables (based on a normal distribution) were established for plantar pressure values for each gender and race group. Stanine scores were ranked from lowest to highest: 1 (extremely low), lowest 4%; 2 (very low), next 7%; 3 (low), next 12%; 4 (below average), next 17%; 5 (average), next 20%; 6 (above average), next 17%; 7 (high), next 12%; 8 (very high), next 7%; 9 (extremely high), last 4%.
Results
Gender-race pressure profiles
The plantar pressure data of all 180 participants were gathered and analysed to establish normative data in the form of stanine tables for each gender-race group. Tables 1 and 2 indicate the plantar pressure values for males and females, respectively, for each ofthe race groups, with plantar pressure values being classiied into speciic stanine categorisations. Plantar pressure values (expressed in N.cm-2) are provided for the left and right feet for each gender-race group. Each stanine rating represents the limit between one rating and another; therefore, in order to score a higher rating, a participant would have to obtain a higher score than that set by the specific stanine cut-off. For example, with regard to black males, values between 8.629 and 11.338 N.cm-2 for right toe 1 would be considered average, whereas values between 11.339 and 12.882 N.cm-2 would be considered above average.
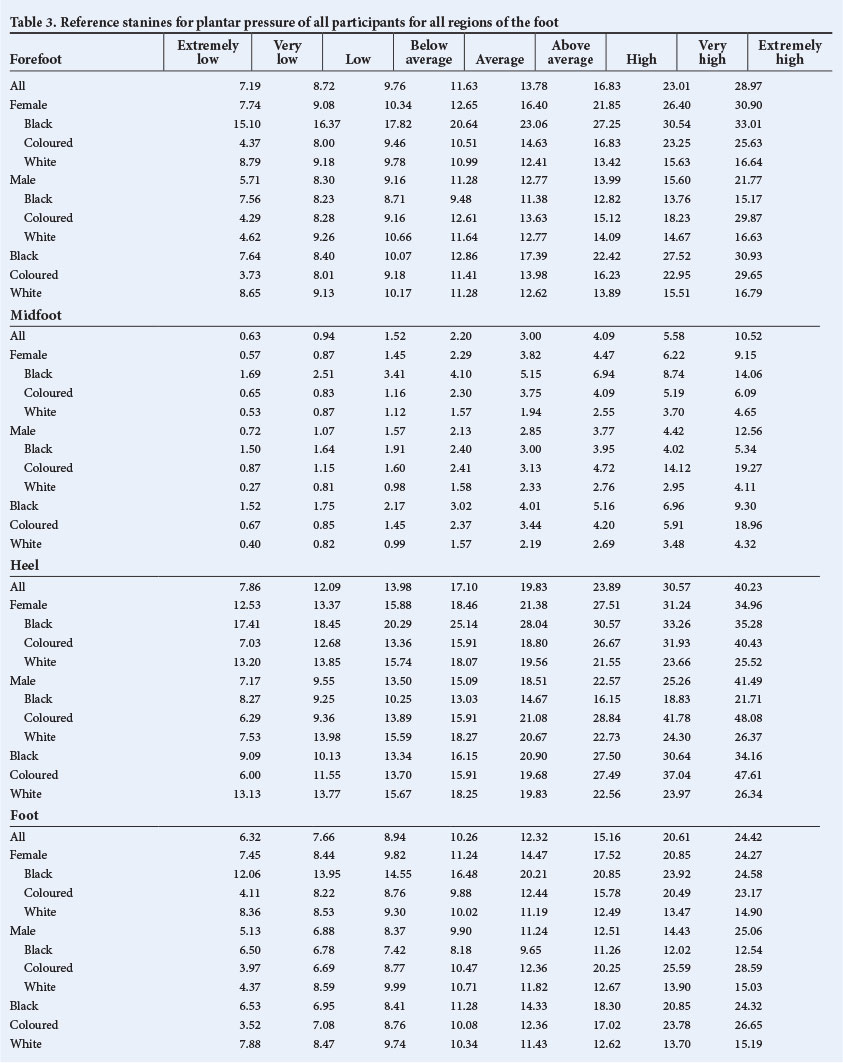
Gender-race regional pressure profiles
In addition to the 10 anatomical areas loaded during walking, the foot may also be classiied according to speciic regions, namely the forefoot, midfoot and heel (Fig. 2). Classifying plantar pressures in this manner allows for greater correlation to more diverse literature, as plantar pressure loading may be linked to the gross region of the foot that is loaded as opposed to the specific anatomical area.[13] The forefoot, midfoot, heel and whole-foot regions are highlighted in Table 3. The stanine categorisations are given relative to each gender group (male and female), each race group (black, coloured and white), and each gender-race group (black female, coloured female, white female, black male, coloured male and white male).
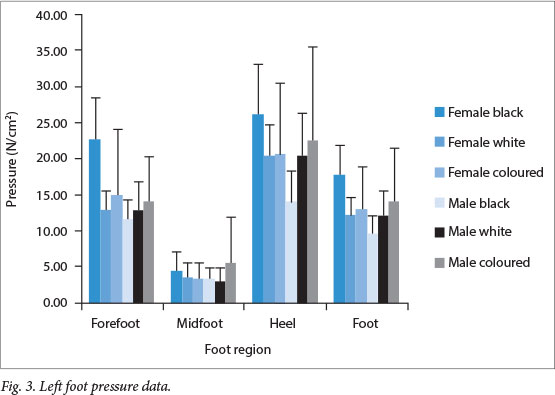
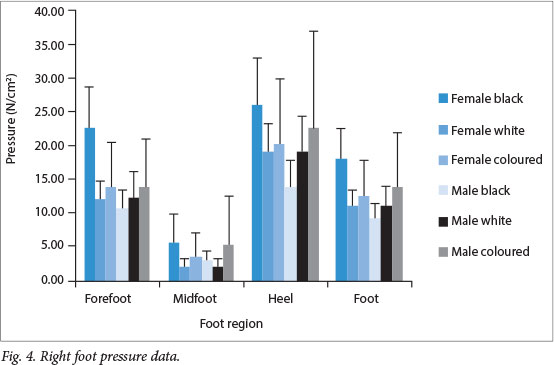
The mean peak plantar pressure values, together with the SDs, for each region of the left and right feet are illustrated in Figs 3 and 4, respectively. These figures provide an overview of the pressure differences between the various gender-race subgroups, in addition to the regions of the foot that exhibit the highest or lowest mean peak pressure values.
Discussion
The reality of gender and racial diversity in SA substantiates the requirement for both gender-specific and race-specific plantar pressure proile data. Although diferences in plantar pressure proiles have been observed between gender and race groups, the causes thereof have yet to be established in an SA context. The establishment of gender- and race-specific plantar pressure profile data would provide clinicians with the necessary information to make more accurate comparisons and assessments, and therefore ultimately to make more precise diagnoses and recommendations to minimise the risk of potential injury.
The present study found that the heel and forefoot regions yielded the highest pressure values, whereas the midfoot yielded the lowest. This can be understood in terms of the biomechanical concepts of pronation and supination, the degree of which determines the plantar pressure distribution under the various areas of the foot.[8,13] In the case of pronation, the midtarsal bones tend to unlock the subtalar joint, which in turn causes the cuboid and navicular bones to become more parallel, allowing the forefoot and midfoot to unlock.[13] Although the latter is necessary for effective shock absorption of ground reaction forces during gait, it becomes problematic in the case of overpronation, where the forefoot does not resupinate in time for toe-off, thereby exerting markedly higher pressure values under the midfoot and forefoot regions.
Owing to the biomechanics of gait and various muscle activation patterns, the centre of mass of the participant should move over the medial metatarsals and first ray (first cuneiform and first metatarsal) during toe-off, as these structures are designed to bear the greatest loads.[8,13] In a more pronated foot structure, the medial longitudinal arch becomes more mobile, resulting in longer loading times and thus higher pressure values.[8] Under these circumstances, the cuboid bone, which acts as a pulley for the peroneus longus on the lateral aspect of the foot, cannot fulfil its function of stabilising the irst ray, resulting in increased pressures under the other metatarsals.[7,8]
The plantar pressure profile values generated are of particular interest with regard to race, as it was found that black participants demonstrated statistically and practically signiicant higher pressure values under the forefoot when compared with white (í=0.000, p<0.05, d=0.78) and coloured (i=0.026, p<0.05, d=0.35) participants. With regards to the midfoot region, white participants demonstrated statistically and practically signiicant lower values compared with black (i=0.003, p<0.05, d=0.94) and coloured (i=0.02, p<0.05, d=0.58) participants. This may indicate greater amounts of pronation at the midfoot for black and coloured participants, whereas white participants may have a greater tendency to either underpronate or exhibit a higher arch proportional to other groups. These findings are in agreement with other similar research findings.[7,14] More specifically, the results depicted in Tables 1 and 2 indicate that the largest mean peak plantar pressure values were recorded under the second and third metatarsal heads of both the left and right feet for both black and white race groups, with only the magnitude thereof varying. The coloured group was the exception here, with both the first toe and heel pressure data reflecting higher values.
The midfoot is often of great interest, as it indicates the dynamic behaviour of the foot.[15] Midfoot pressure values have been variably established.[5,11] Although reported values are dissimilar and indeed substantially higher than those obtained in the present research, it is noteworthy that this is dependent on the gender and race groupings. This also reiterates the need for the establishment of normative data, as both higher and lower values are indeed present within a normal range. Disparities pertaining to plantar pressure data may be attributable to differences in participant characteristics and testing methodology. What remains of interest, however, is that substantially lower pressure values were observed under the midfoot region compared with those of the forefoot or heel regions in the studies referenced earlier in this paragraph, as well as in the present study. The need for standardised testing and evaluation (such as the use of ten anatomical landmark sensor placements by software manufacturers) as well as the establishment of normative data is therefore reinforced so as to allow for improved accuracy and effectiveness when comparing plantar pressure values both nationally and internationally.[15] In addition, gender-race-specific plantar pressure profile data will allow clinicians to evaluate and rate future clients based on the plantar pressure values generated, thereby allowing for better assessment of future clients' potential injury risk profile.
Conclusions
Although the largest pressure values were generally observed under the second and third metatarsal heads of the forefoot when the ten individual foot regions were considered, when the foot was subdivided into the three subregions, the overall largest pressure values were ascribed to the heel region of the foot, closely followed by the forefoot region. The midfoot region yielded the lowest plantar pressure values. Black females, coloured males and coloured females yielded the highest pressure values, particularly when compared under the midfoot region of the foot. Black and white males and white females exhibited the lowest plantar pressures, especially under the midfoot region.
The plantar pressure profile data generated in this study serve to provide clinicians with an initial frame of reference when evaluating participants with the RS Footscan and other footscan systems. Values falling outside or within the extreme categories of these norms may prompt the clinician to investigate further, and potentially improve diagnostic accuracy and minimise the possible risk of future injury. Future research to further extend the proile to larger and more diverse population groups is recommended.
Furthermore, future research could consider comparing normative plantar pressure proile with clinical populations, measuring foot function during gait by determining the centre of pressure excursion index, establishing foot function by measuring the modified arch index, as well as establishing diferences between plantar pressure exhibited during static weight-bearing in comparison with the dynamic values obtained in the present study. It is also recommended that future research focuses on factors affecting plantar pressure values with regard to anthropometric variables such as height, weight, BMI and levels of physical activity. A possible limitation pertaining to the mean age of the present study is that caution should be observed when generalising the normative data to older participants.
Acknowledgements. Acknowledgements include the funding provided by the National Research Fund (NRF) and the National Lottery Distribution Trust Fund (NLDTF).
References
1. Deepashini H, Baharudin O, Paungmali A, Amaramalar N, Ohnmar H, Leonard J. An insight into the plantar pressure distribution of the foot in clinical practice: Narrative review. Pol Ann Med 2014;21:51-56. [http://dx.doi.org/10.1016/j.poamed.2014.03.003] [ Links ]
2. Gurney JK, Kersting UG, Rosenbaum D. Dynamic foot function and morphology in elite rugby league athletes of different ethnicity. Appl Ergon 2009;40(3):554-559. [http://dx.doi.org/10.1016/j.apergo.2008.11.001] [ Links ]
3. Hills AP, Hennig EM, McDonald M, Bar-Or O. Plantar pressure differences between obese and non-obese adults: A biomechanical analysis. Int J Obes Relat Metab Disord 2001;25(11):1674-1679. [http://dx.doi.org/10.1038/sj.ijo.0801785] [ Links ]
4. Nagel A, Fernholz F, Kibele C, Rosenbaum D. Long distance running increases plantar pressures beneath the metatarsal heads: A barefoot walking investigation of 200 marathon runners. Gait Posture 2008;27(1):152-155. [http://dx.doi.org/10.1016/j.gaitpost.2006.12.012] [ Links ]
5. Putti AB, Arnold GP, Abboud RJ. Diferences in foot pressures between caucasians and Indians. Foot Ankle Surg 2010;16(4):195-198. [http://dx.doi.org/10.1016/j.fas.2009.11.004] [ Links ]
6. Roislien J, Skare O, Gustavsen M, Broch NL, Rennie L, Opheim A. Simultaneous estimation of effects of gender, age and walking speed on kinetic gait data. Gait Posture 2009;30(4):441-445. [http://dx.doi.org/10.1016/j.gaitpost.2009.07.002] [ Links ]
7. Razeghi M, Batt ME. Foot type classification: A critical review of current methods. Gait Posture 2002;15(3):282-291. [http://dx.doi.org/10.1016/S0966-6362(01)00151-5] [ Links ]
8. Prentice WE. Principles of Athletic Training: A Competency-based Approach. 10th ed. New York: McGraw-Hill, 2009. [ Links ]
9. Van Schie CHM, Boulton AJM. The effect of arch height and body mass on plantar pressure. Wounds 2000;12(4):88-95. [http://www.medscape.com/viewarticle/407555] [ Links ]
10. Waterman BR, Owens BD, Davey S, Zacchilli MA, Belmont PJ. The epidemiology of ankle sprains in the United States. J Bone Joint Surg Am 2010;92(13):2279-2284. [http://dx.doi.org/10.2106/JBJS.L01537] [ Links ]
11. Burns J, Crosbie J, Hunt A, Ouvrier R. The effect of pes cavus on foot pain and plantar pressure. Clin Biomech 2005;20(9):877-882. [http://dx.doi.org/10.1016/j.clinbiomech.2005.03.006] [ Links ]
12. Rapoo VM. Management of recurrent soccer injuries among the Premier Soccer League (PSL) players. MA Thesis. Limpopo: University of Limpopo, 2010. http://hdl.handle.net/10386/271 (accessed 21 March 2012). [ Links ]
13. Cavanagh PR, Morag E, Boulton AJM, Young MJ, Deffner KT, Pammer SE. The relationship of static foot structure to dynamic foot function. J Biomech 1997;30(3):243-250. [http://dx.doi.org/10.1016/S0021-9290(96)00136-4] [ Links ]
14. Donatelli RA. Normal biomechanics of the foot and ankle. J Orthop Sports Phys Ther 1985;7(3):91-95. [http://dx.doi.org/10.2519/jospt.1985.7.3.91] [ Links ]
15. Orlin MN, McPoil TG. Plantar pressure assessment. Phys Ther 2000;80(4):399-409. [http://www.ncbi.nlm.nih.gov/pubmed/10758524] [ Links ]
 Correspondence:
M Kramer
mark.kramer2@nmmu.ac.za

