


Services on Demand
Article
 English (pdf)
 Article in xml format
 Article references
Indicators

Related links
-
 Cited by Google
 -
 Similars in Google
Share

 Permalink
South African Journal of Sports Medicine
On-line version ISSN 2078-516X
Print version ISSN 1015-5163
SA J. Sports Med. vol.26 n.4 Bloemfontein 2014
http://dx.doi.org/10.7196/SAJSM.551
ORIGINAL RESEARCH
DOI:10.7196/SAJSM.551
Body mass index and associated physical activity levels in 7 - 10-year-old children in primary schools in Port Elizabeth
M L BaardI; J M McKersieII
IDPhil; Department of Human Movement Science, School of Lifestyle Sciences, Faculty of Health Sciences, Nelson Mandela Metropolitan University, Port Elizabeth, South Africa
IIMA (Human Movement Science (Research)) Department of Human Movement Science, School of Lifestyle Sciences, Faculty of Health Sciences, Nelson Mandela Metropolitan University, Port Elizabeth, South Africa
ABSTRACT
BACKGROUND: Declining levels of physical activity coupled with the rising incidence of childhood obesity in developing countries are of health concern. Current daily recommendations for preadolescent children are to accumulate 60 min of moderate physical activity per day. In South Africa, physical education forms part of the life skills curriculum, but children have limited school time to engage in physical activity. As many obesogenic behaviours are learnt in childhood and track into adulthood, physical activity should be promoted at a young age and should be a research priority
OBJECTIVES: To explore and determine the association between body mass index (BMI) and daily physical activity levels as expressed in metabolic equivalent of task (MET) in 7 - 10-year-old children in quintile-5 English-medium primary schools in Port Elizabeth
METHODS: A quantitative, descriptive, one-way, cross-sectional design utilising random sampling was used. A once-off survey comprised anthropometric assessment of height and weight of 713 participants. Age- and gender-specific prevalence rates of overweight, obesity and underweight were calculated based on the International Obesity Task Force (IOTF) cut-off points. One-way analysis of variance (ANOVA) and χ2 tests were performed. A validated once-offinterviewer-administered physical activity questionnaire was utilised to determine daily energy costs.
RESULTS: The BMI of the majority of children fell within the norm and was coupled with high levels of daily physical activity (average of 893 METs). No significant relationship was found for BMI and physical activity (p=0.8
CONCLUSION: Daily level of physical activity is not significantly related to BMI in urban children from an economically privileged setting
Physical inactivity in young children is of concern because of the increasing prevalence of obesity, type 2 diabetes mellitus, cardiovascular disease and lack of fitness, which are precursors of adult chronic disease.[1] Excessive adiposity is caused mainly by an imbalance between energy intake and energy expenditure. Multiple factors are interrelated and contribute to the complexity of obesogenic behaviour.[2] Physical activity improves cardiovascular fitness, body composition, blood lipid levels, and skeletal and psychological health in young children.[3] South Africa (SA) has the 4th highest prevalence of physical inactivity in Africa when assessed by global surveillance questionnaires. [4] The SA youth risk behaviour survey reported that less than a third of young children surveyed participated in physical activity, and ~42% fell short of the minimum standardised recommendation,[5] and SA children have among the highest prevalences of overweight (preobesity) and obesity globally and in sub-Saharan Africa.[6-
Health recommendations for preadolescent children are to accumulate at least 60 min of physical activity daily or to engage daily in moderate to vigorous physical activity for at least 50% of physical education class time in school.[7] Currently in SA, due to restructuring of the school curriculum, physical education has lost formal instruction time to the life skills subject. Therefore, children have limited opportunity to engage in the recommended daily amount of physical activity in order to benefit from a healthy lifestyle and prevent premature onset of chronic disease. The Health of the Nation study[8] pleads for the reintroduction of physical education as a separate school subject and reiterates the need for enhancing physical fitness among school children.
The prevalence of childhood obesity in developing countries is associated more with children from a higher socioeconomic background than their less economically privileged counterparts.[9] According to Rossouw et al.,[6]relevant published studies in higher socioeconomic prepubertal children in SA are scarce, as most researchers have focused on undernutrition in rural areas. It was thus deemed important to explore and determine associated physical activity levels based on recently acquired anthropometric data for 7 - 10-year-old urban children in financially privileged (quintile 5) English-speaking primary schools, in Port Elizabeth in the Eastern Cape Province.
Methods
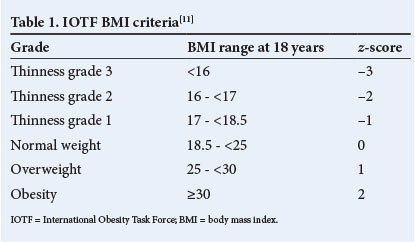
A descriptive, one-way, cross-sectional research design with baseline anthropometric measures of weight and height was used.[10] Body mass index (BMI) was calculated for each child. Table 1 displays the range of grades, BMI scores and z-scores according to which the children were categorised using the International Obesity Task Force (IOTF) method.[11] Physical activity was measured using an interviewer-administered physical activity questionnaire (PAQ) as a validated assessment tool for SA primary-school children.[12] Daily physical activity levels were reported with assistance from parents or guardians. The metabolic equivalent of task (MET) was used to assess daily energy expenditure during activities.[13] The Nelson Mandela Metropolitan University (NMMU) Research Ethics Committee: Human approved the study (H12-HEA-HMS-002).
The NMMU Department of Education provided a list of all 109 primary schools in Port Elizabeth, of which 28 were quintile 5 English-medium primary schools. Randomised sampling was used to select 10 schools from which to sample participants.[10] Only four of the principals gave voluntary consent to participate in the study.
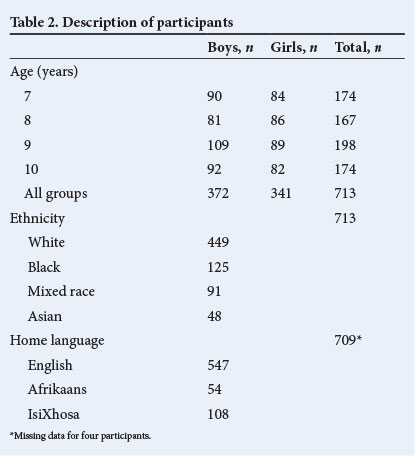
The target population comprised 713 7 - 10-year-old children. Rationale for inclusion of this age group was that body mass was unlikely to be affected by developmental changes associated with puberty or infancy. Demographic data pertaining to age, gender, ethnicity and home language of the children are presented in Table 2. For statistical analysis, four of the participants were excluded based on the home language variable, as they fell outside the inclusion criteria for this study. Therefore, the total sample population comprised 709 children.
A booklet containing the PAQ and demographic information was given to the children by their teacher, to be completed by parents or guardians a week prior to the scheduled anthropometric assessments. Parental informed consent and assent forms for children to be signed prior to voluntary participation were included in the booklet. Anthropometric measurements of weight and height were reported in the booklet for every participant. Trained postgraduate research assistants did the measurements in private classroom settings and completed assessments within 1 month of appointment times. Children were measured according to school grade and gender. Assessment methods were explained to the children to familiarise them with the measurements and to reduce any uncertainty or anxiety among them.
Standardised protocol of the American College of Sports Medicine[14] was used to do assessments. The anthropometric instruments were calibrated prior to measurement at all four schools.
Height was measured to the nearest 0.1 cm using a Charder HM 200 PW stadiometer (Charder Medical, Taiwan). Children stood barefoot in the anatomical zero position, and height was recorded in the midsagittal plane from the soles of the feet to the vertex.
A Scalemaster Jadever model JWI scale 86 (Scalemaster, Taiwan) was used to measure weight to the nearest 0.01 kg. The children were barefoot and wore minimal clothing. They had to stand still while being measured, with body weight distributed equally between their feet. Physical activity was expressed in terms of MET to calculate energy spent during activities.[13] MET is defined as the ratio of metabolic cost during an activity to a reference metabolic rate of 3.5 mL O2.kg-1.min-1 and is equivalent to 1 kcal.kg-1.h-1 or 4.184 kJ.kg-1.h-1.[13]
Quantitative data analysis was done by means of the Statistica version 9.0 computer processing package (StatSoft Inc., USA).[15] Variables of age, gender, BMI (z-scores) and MET levels were reported as means and standard deviations (SDs). One-way analysis of variance (ANOVA) determined whether statistical differences existed for BMI and MET levels. Chi-square tests established where these differences existed for the age cohorts and the selected variables. Significance was accepted at p<0.05.
Results
Height, weight and BMI of the children have been reported and discussed in detail elsewhere.[16] Table 3 illustrates descriptive data obtained for BMI and MET levels for the total group.

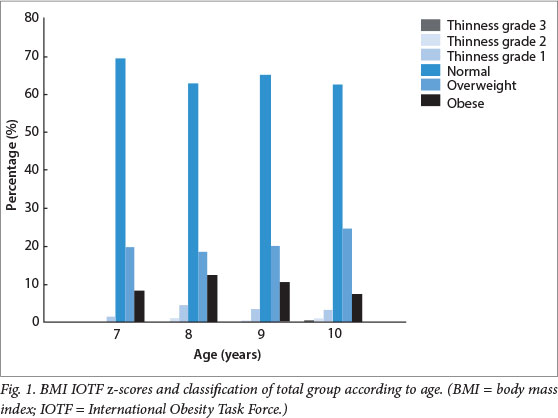
Descriptive results indicate that 65% of the children were of normal weight, 21% were overweight, 10% were obese and 4% were underweight (Fig. 1). The highest prevalence of overweight (25%) was found in children aged 10, and the highest incidence of obesity (13%) was found in 8-year-old children. Results analysed for gender effect showed that 19% of the boys were overweight and ~7% were obese, whereas 4% were underweight. In comparison, 23% of girls were overweight, 12% were obese and 5% were underweight. ANOVA indicated a significant difference in BMI IOTF z-scores between boys and girls (p<0.05) as reported in detail elsewhere.[16]
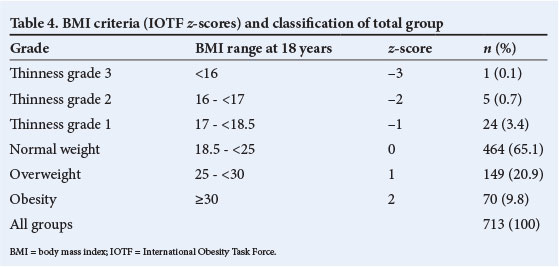
The normative gender-specific IOTF cut-off criteria[11] were used to quantify obesity and overweight rates among participants. These values represent cut-off points chosen as percentiles that match adult cut-offs for BMI values. Based on a child's current BMI and age, their BMI at age 18 years can be predicted. The reference criteria used to categorise the sample population of children is set out in Table 4.
The average daily energy expenditure of the participants was 881.6 METs. The range was large, as indicated by an SD of 471.6 METs. The relationship between BMI IOTF z-score categories and daily MET energy expenditure for 7 - 10-year olds is presented in Table 5. The highest energy expenditure and prevalence of overweight (25%) for the age groups was found in the 10-year-olds. Seven-year-olds expended the least energy and were the least active of all. Although 8-year-olds showed the highest obesity incidence, they obtained relatively high MET energy expenditures.
One-way ANOVA showed no significant relationship between daily physical activity levels and BMI categories for gender for any of the age groups.
Discussion
Declining levels of physical activity and subsequent increased sedentariness seem to have become normative lifestyles for many SA children. Evidence ofphysical inactivity in children was found in the follow-up SA national risk behaviour survey, which found that 42% of children had insufficient daily physical activity levels.[5] A study done on a smaller scale reported that only 27% of a total of 30 children met the daily standardised requirements.[12]
Children of optimal BMI performed the most physical activity daily in the current study. This finding that physical activity is a meaningful contributor to healthy living and weight a with what has been reported in the literature.[3] Although pre-obesity was found to be most prevalent in 10-year-olds, they performed the most physical activity daily. This supports an SA study that found that overweight children do accumulate the required level of daily physical activity.[17] BMI does not account for the increased lean muscle mass associated with growth and physical development in children and could have influenced the overestimation of pre-obesity. The current study found that 8-year-olds were the most obese, but had relatively high daily energy expenditure. It is informative to realise that obesity is more prevalent among younger children, despite their being physically active. This contrasts with a study[18] that found insufficient levels of physical activity in 7-year-old obese children due to bodily discomfort and a lack of motor skills and self-confidence. It is difficult to identify causal pathways, as factors contributing to obesogenic behavi our in children are complex and interrelated. Although this study explored the association of BMI and physical activity as a single aetiological variable, the question is whether overweight and obese children should exceed the standard physical activity recommendation to derive similar benefits as their normal-weight counterparts, and whether to argue for weight management similar to adult guidelines. In accordance with the literature, children in the thinness grade 2 category were the least active of all participants, and their insufficient physical activity has been ascribed to being sedentary for an average of 4 h per weekday and 6 - 8 h per day at weekends.[19]
The results demonstrated that physical activity and BMI for young urban children from economically privileged primary schools is not significantly related and is in alignment with inconclusive evidence found in the literature.[2] Although this study provides valuable information pertaining to the above, certain limitations existed that are inherent to the use of self-administered questionnaires. Thus, challenges arose in the measurement of daily physical activity. Furthermore, quantification of physical activity by using different instruments, varying from self-report questionnaires and pedometers to accelerometers, impedes comparative studies.[12] Most ofthe relevant studies on children do not differentiate clearly between physical activity, exercise and sport, therefore complicating variables when contrasting evidence. Applicability of the results to the broader urban population of young quintile 5 primary-school children in SA should be approached with caution, as the response rate of the principals was low.
Conclusion
Childhood overweight and obesity prevalence and lack of physical activity in 7 - 10-year-olds in financially privileged primary schools in a city in the Eastern Cape are relatively high. Children of optimal weight performed the most daily physical activity. The incidence ofpre-obesity is more prevalent in 8-year-olds than in 10-year-olds. When BMI is coupled with energy expenditure, the 8-year-olds engaged in aboveaverage levels of physical activity for the total group. Although preobesity was the highest in 10-year-olds, they were the most active on a daily basis. Underweight occurrence was extremely low, and children in the low BMI category were the least active of all participants. Results did not reveal a significant relationship between daily level of physical activity when expressed as MET energy expenditure and BMI.
Recommendations for future research
Overall, conflicting results emerged from evidence on the association between BMI and level of physical activity in young urban children from financially advantaged primary schools. The current study did not reveal a relationship between BMI and daily levels of physical activity. The establishment of a universally accepted set of classification criteria and cut-off points for defining overweight and obesity in children needs further exploration. Although an internationally accepted valid and reliable PAQ for South Africans was used to assess energy expenditure, more rigorous measures of daily physical activity through actigraphy should be used in future studies.
Acknowledgement. Financial assistance was received from the National Research Foundation (NRF) and the NMMU as a research grant.
References
1. Wang Y. Diet, physical activity, childhood obesity and risk of cardiovascular disease. International Congress Series 2004;1262:176-179. [http://dx.doi.org/10.1016/j.ics.2003.12.018] [ Links ]
2. Ortlieb S, Schneider G, Koletzko S, et al. Physical activity and its correlates in children: A cross-sectional study (the GINIplus and LISAplus studies). BMC Public Health 2013;13:349. [http://dx.doi.org/10.1186/1471-2458-13-349] [ Links ]
3. Strong WB, Malina RM, Blimkie CJ, et al. Evidence based physical activity for school-age youth. J Pediatr 2005;146(6):732-737. [http://dx.doi.org/10.1016/j.jpeds.2005.01.055] [ Links ]
4. Lambert EV. Physical activity as a global risk factor for non-communicable diseases: Time for action, what, why, when, who and how? S Afr J SM 2012;24(1):25-26. [ Links ]
5. Reddy SP, Resnicow K, James S, et al. Underweight, overweight and obesity among South African adolescents: Results of the 2002 National Youth Risk Behaviour Survey. Public Health Nutr 2008;12(2):203-207.[http://dx.doi.org/10.1017/S1368980008002656] [ Links ]
6. Rossouw H, Grant C, Viljoen M. Overweight and obesity in children and adolescents: The South African problem. S Afr J Sci 2012;108(5/6):Art.#907. [http://dx.doi.org/10.4102/sajs.v108i5/6.907] [ Links ]
7. The National Institute of Child Health and Human Development. Study of early child care and youth development network. Arch Pediatr Adolesc Med 2003;157(1):185-190. [ Links ]
8. Armstrong M, Lambert E, Lambert M. Physical fitness of South African primary school children, 6 to 13 years of age: Discovery Vitality Health of the Nation Study. Percept Mot Skills 2011;113(3):999-1016. [http://dx.doi.org/10.2466/06.10.13.PMS.113.6.999-1016] [ Links ]
9. Kruger R, Kruger H, MacIntyre U. The determinants ofoverweight and obesity among 10-to-15-year-old schoolchildren in the North West Province, South Africa - the THUSA BANA study. Public Health Nutr 2006;9(3):351-358. [http://dx.doi.org/10.1079/PHN2006849] [ Links ]
10. Carter R, Lubinsky J, Domholdt E. Rehabilitation Research: Principles and Applications. 4th ed. USA: Elsevier Saunders, 2011:56-58. [ Links ]
11. Cole T, Flegal K, Nicholls D, Jackson A. Body mass index cut offs to define thinness in children and adolescents: International survey. BMJ 2007;335(2):194-197. [http://dx.doi.org/10.1136/bmj.39238.399444.55] [ Links ]
12. McVeigh J, Norris S. Criterion validity and test-retest reliability of a physical activity questionnaire in South African primary school-aged children. S Afr J SM 2012;24(2):43-48. [ Links ]
13. Ainsworth B, Haskell W, Herrmann S, et al. 2011 Compendium of physical activities: a second update of codes and MET values. Med Sci Sport Exerc 2011;43(8):1575-1581. [ Links ]
14. American College of Sports Medicine. ACSMs Guidelines for Exercise Testing and Prescription. 8th ed. London: Lippincott, Williams and Wilkins, 2010. [ Links ]
15. Statsoft. Statistica for Windows. 8th ed. USA: StatSoft, 2008. [ Links ]
16. McKersie J, Baard ML. Obesity in seven-to-ten-year-old children in urban primary schools in Port Elizabeth. S Afr J SM 2014;26(2):55-58. [http://dx.doi.org/10.7196/SAJSM.526] [ Links ]
17. Reddy S, Panday S, Swart, D, et al. Umthenthe Uhlaba Usamila - The South African Youth Risk Behaviour Survey, 2008. Cape Town: South African Medical Research Council, 2010. [ Links ]
18. Truter L, Pienaar AE, du Toit D. Relationships between overweight, obesity and physical fitness of nine-to-twelve-year-old South African children. S Afr Fam Pract 2010:52(3):227-233. [http://dx.doi.org/10.1080/20786204.2010.10873979] [ Links ]
19. Puckree T, Naidoo P, Pillay P, Naidoo, T. Underweight and overweight in primary school children in eThekwini district in KwaZulu-Natal, South Africa. Afr J Prim Health Care Fam Med 2011;3(1):Art. 203. [http://dx.doi.org/10.10.4102.phcfm.v3i1.203] [ Links ]
Corresponding author: M L Baard (maryna.baard@nmmu.ac.za)

