


Serviços Personalizados
Artigo
 Inglês (pdf)
 Artigo em XML
 Referências do artigo
Indicadores

Links relacionados
-
 Citado por Google
 -
 Similares em Google
Compartilhar

 Permalink
South African Journal of Sports Medicine
versão On-line ISSN 2078-516X
versão impressa ISSN 1015-5163
SA J. Sports Med. vol.26 no.2 Bloemfontein 2014
http://dx.doi.org/10.7196/SAJSM.507
ORIGINAL RESEARCH
Associations of objectively and subjectively measured physical activity with trabecular and cortical bone properties in prepubertal children
R MeiringI; J A McVeighII
IMSc; Exercise Laboratory, School of Physiology, Faculty of Health Sciences, University of the Witwatersrand, Johannesburg, South Africa
IIPhD; Exercise Laboratory, School of Physiology, Faculty of Health Sciences, University of the Witwatersrand, Johannesburg, South Africa
ABSTRACT
OBJECTIVES: To compare the relationship between peak bone strain scores (PBSSs) calculated from physical activity (PA) questionnaires and accelerometry measures of PA with trabecular and cortical bone properties in prepubertal children.
METHODS: We compared PBSSs calculated from the bone-specific component of PA questionnaires with accelerometry and bone mass measures in 38 prepubertal children (mean 9.9 (standard deviation 1.3) years). Dual energy X-ray absorptiometry (DXA) and peripheral quantitative computed tomography (pQCT) were used to assess bone content and structure, and to estimate bone strength at the radial and tibial diaphysis and radial metaphysis.
RESULTS: The PBSS was reliable and reproducible with significant (p<0.001) intraclass correlation coefficients. There were significant correlations between PBSS and moderate (r=0.38; p=0.02), vigorous (r=0.36; p=0.03) and combined moderate- to vigorous-intensity activity counts (r=0.38; p=0.02). PBSS was significantly correlated to body size-adjusted bone mineral content at all sites scanned by DXA (r=0.33 - 0.48; p<0.05). Positive correlations were observed between PBSS and area, density and strength at the radius and tibia (r=0.40 -0.64; p<0.05). Only vigorous activity was correlated to cortical area at the radial diaphysis (r=0.37; p=0.03) and bone strength at the tibial diaphysis (r=0.32; p=0.05). Activity as assessed by the PBSS explained a greater amount of variance in bone variables as measured by DXA and pQCT than accelerometer-measured PA.
CONCLUSION: Accelerometer-measured moderate and vigorous habitual PA is associated with indices of cortical bone size and geometry in children, whereas light PA has no detectable association. Furthermore, the bone-specific questionnaire appears to be more strongly associated with bone outcomes than accelerometer-derived measures of PA.
Pre- and early pubertal children who perform weight-bearing physical activities (PAs) that load major axial and appendicular bones have denser and stronger bones than less-active children.[1] Two of the most common PA assessments used for research purposes are accelerometry and PA questionnaires (PAQs). Accelerometry is a reliable and acceptable method of assessing energy expenditure in children.[2] For the surrogate assessment of bone loading, no such standard exists and researchers rely on PAQs as proxy assessments. The Iowa Bone Development Study has shown good associations between accelerometer-measured time spent in moderate- to vigorous-intensity PA (MVPA) and changes in bone mineral content (BMC), bone mineral density and bone area as measured by dual energy X-ray absorptiometry (DXA) in children.[1] Accelerometers have also been shown to be useful in detecting ground reaction force exerted by different types of activity, although there is inconsistency between types/brands of accelerometers.[2] One study has shown that accelerometer-measured vigorous-intensity activity, more so than moderate, is a significant predictor of BMC of the total body as well as at the femoral neck of 9-year-old children, while in children of similar age, Nor Aini et al.[3]indicated that there is better agreement between increased BMC and moderate-intensity exercise.
The PAQ is a validated questionnaire[4] that can be used to survey sport, habitual and leisure-time PA. The PAQ has been used to assess PA in children and adolescents,[5,6] and McVeigh et al.[5] developed a mechanical-loading, bone-relevant PAQ algorithm (the peak bone strain score (PBSS)) that incorporates PA duration, frequency and weight-bearing load. Few studies have validated bone-specific algorithms from general PAQs in children,[7,8] and although bone-specific questionnaires do exist, their ability to predict bone indices in children has not been assessed. In addition, the ability of the PBSS algorithm to predict volumetric bone parameters of children has not been studied. Although DXA remains useful for monitoring bone response to exercise, DXA measurements do not assess bone geometry, and small increments (due to loading PAs) on the periosteal surface of the bone may be missed.[9] The use of peripheral quantitative computed tomography (pQCT) provides structural and true density measures of paediatric bone[10] and thus allows delineation of the effects of exercise intensity on bone. Farr et al.[11] examined the relationship between bone strength as measured by pQCT and PA assessed using a pedometer and PAQs, and found that a past-year PAQ was a better predictor of bone strength indices (BSIs) than a pedometer. Pedometers may be limited in their ability to reflect time spent in MVPA as they only measure steps per day
and have a high amount of variability when used by people with different gait patterns.[2] Only one group has assessed the relationship between accelerometry measures and pQCT bone outcomes, and found that in adolescents, vigorous - not light or moderate - PA was associated with bone geometric measures and indices of bone strength at the diaphysis of the tibia.[12,13] The relationship between pQCT-measured bone outcomes and PA assessment (using accelerometry and questionnaires) in pre- and early pubertal children remains largely unknown. A valid, simple and effective weight-bearing activity assessment questionnaire would be of value in studies in poorer communities as more technical assessments are often not feasible.
We therefore sought to compare the relationship between PBSS calculated from the PAQ and accelerometry measures of PA with trabecular and cortical bone properties in prepubertal children.
Methods
Participants
Cross-sectional data were obtained from a convenience sample of 45 participants recruited from local schools in the greater Johannesburg area. Participants who responded to advertisements and distributed flyers were screened to determine their eligibility for the study. Based on previously published correlation coefficients between PAQs and accelerometry data, which range between 0.40 and 0.60,[7,14] we chose a value of 0.50 (moderate strength) and conducted a sample size calculation. It was estimated that a sample size of 38 children was needed at a power of 87% to ascertain a correlation coefficient of this size. Screening included a self-assessment of pubertal status using the Tanner five-stage classification criteria.[15] A general health questionnaire was administered to the primary caregiver of each child; children were excluded if they had been on corticosteroid medication for more than 7 consecutive days in the past year, if they had milk or lactose food allergies, if they were on a vitamin D or calcium supplement, or if they had been ill or admitted to hospital in the last 3 months prior to participation in the study. Girls were excluded if they had attained menarche. All children who participated in the project had the study protocol verbally explained to them and, if they agreed to participate, signed an assent form. Primary caregivers were required to consent to their child's participation in the project. The project was approved by the Human Research Ethics Committee of the University of the Witwatersrand (protocol number: M10635), which adheres to the principles of the Declaration of Helsinki.
Anthropometry
Participant height and weight were recorded to the nearest millimetre and 100 g using a stadiometer (Holtain, UK) and a digital scale (Dismed, South Africa), respectively. Body mass index percentile for age was calculated using software available from the World Health Organization (WHO, http://www.who.int/childgrowth/software/en). Radial and tibial lengths (to the nearest millimetre) were measured using sliding callipers (Holt ain, UK) for the determination of the position of the bone scans. Radial length was defined as the distance from the tip of the olecranon process to the most distal end of the ulna styloid process. Tibial length was defined as the distance from the distal end of the medial malleolus to the superior aspect of the medial tibial condyle.
Physical activity questionnaire (PAQ)
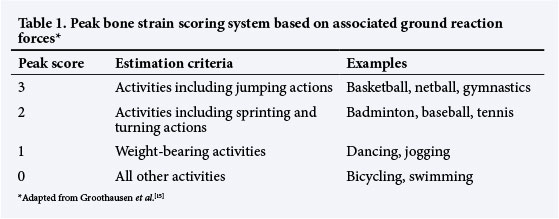
Children were required to complete the PAQ (with the assistance of their primary caregiver) on their participation in physical and leisure-time activities for the previous 2 years. Information was gathered from four activity question domains, namely PA participation during school, extramural/after-school PA, leisure-time activity and mode of transport to and from school. Children were asked to provide details on the number of times per week they performed an activity, as well as the amount of time they spent on each activity at any one time, to determine the frequency of each PA. A regular activity was defined as that which was performed once a week for more than 4 months of the year (the usual length of a school semester in South Africa). Each regular activity was then assigned a bone strain score using a scoring system based on that of Groothausen et al.[16] (Table 1). A PBSS was calculated for each participant. The PBSS incorporated duration (defined as average minutes/session), frequency (sessions/week) and load (peak strain score). The sum of the scores for each activity made up the PBSS for each child. The PAQs for all children were filled out for the previous 2 years (April 2010 - April 2012) to account for seasonal and annual variation in PAs. The PAQ was re-administered 6 months later. A modified version of the questionnaire was also administered for the week in which the participants wore the Actical (and again 6 months later) to ensure that the week was representative of a typical active week for the participants.
Accelerometry
Children wore an Actical accelerometer (Phillips, USA), which was secured using an elasticised waist belt to the hip of the right leg for 7 consecutive days. The Actical was removed when participants showered, bathed or swam and this was recorded on the 7-day PAQ. The Actical was collected after 7 days and the data were downloaded and analysed independently of the PAQ data. Activity counts were collected in 15-second epochs and data were reduced by removing only full days of non-wear time as assessed either by observation of the data, where a full day of consistent zero activity counts was recorded, or as indicated by the participant if a day of wearing the Actical was missed. The remaining data are referred to as the 'wear period. Participant data were included if, out of the 7 days, there was a minimum of 4 days of wear time where 10 hours of consecutive total activity and activity counts were recorded per day. Light, moderate and vigorous activity categories were defined according to activity count thresholds based on guidelines recommended for children between the ages of 7 and 18 years:[17] light activity = 300 - 1 499 counts per minute; moderate activity = 1 500 - 6 500 counts per minute; vigorous activity = >6 501 counts per minute. The Actical output variables were total activity counts per minute and daily minutes spent in either moderate and/or vigorous activity.
Dual energy X-ray absorptiometry (DXA)
BMC was measured by a trained technician using DXA (Hologic QDR, Discovery W, USA) at the following sites: forearm (ulna and radius), whole body, lumbar spine, total hip and femoral neck. The same technician performed and analysed all DXA scans. The coefficients of variation for BMC over the course of the study was 0.36%.
Peripheral quantitative computed tomography (pQCT) Measures of the forearm and tibia were conducted using pQCT (Stratec XCT 2000, Stratec Medical, Germany). A scout view was performed for each participant and a reference line placed at the midline of the epiphyseal plate of the radius and the tibia. Scans of 2.3 mm thickness were done at 4% and 65% of the length of the radius from the reference line, and at 65% of the length of the tibia from the reference line for the measurement of bone area, density and strength. Strength, periosteal circumference (PC), endosteal circumference (EC) and cortical thickness (CT) were also calculated. Muscle cross-sectional area (MCSA) was obtained from the 65% site as this site is associated with the largest muscle belly. For the 4% radial measures, the bone threshold was set at 180 mg/cm3 and contour mode 1/peel mode 1 was used. For the cortical and bone geometry measures at the 65% radial and tibial sites, bone threshold was set at 711 mg/cm3 (contour mode 1/ peel mode 2). Threshold for SSI at these sites for both the radius and tibia was set at 480 mg/cm3. For the measures of MCSA, threshold was set at 40 mg/cm3 (contour mode 3/peel mode 1). The same independent technician performed all pQCT scans. A quality-control phantom spine was scanned each morning before 9 o-clock and before any participant scans were performed, with the coefficient of variation for total attenuation at 0.44% and trabecular attenuation at 0.37% during the study period (from April 2012 to October 2012). An acceptable and true representation of the 4% tibia (metaphysis) was not available for all participants (n=16 available) because the lower limbs of some participants were too short for an acceptable scan at that site. Thus the 4% tibia was excluded from the final analysis.
Statistical analysis
The PBSSs calculated from the 2-year PAQ and the 7-day PAQ were compared using a Wilcoxon signed rank test. Intraclass correlation coefficients (one-way random effects model) were used to evaluate the reproducibility of the estimates of two administrations of the 2-year and 7-day PBSSs. The initial 2-year PBSS (indicative of bone loading history) was used for subsequent analyses. PBSSs and Actical activity (counts/min) were log transformed as data were not normally distributed. Pearson's correlations were then performed between PBSS and moderate, vigorous and MVPA, and between log-transformed PBSS, Actical activities and adjusted bone variables. DXA measurements were adjusted for bone area, body mass and sex, while pQCT values were adjusted for limb length, body mass and sex.
Multiple regression analyses were used to determine the independent contribution of PA measures (PBSS and MVPA) on the variance of selected DXA (femoral neck, spine and hip) and pQCT (cortical area (CoA), density and strength of the 65% radius and tibia) derived variables after adjustment for the abovementioned covariates. MVPA, PBSS and the covariates were entered into the models using a forced option. Unless otherwise specified, data are presented as mean (SD). Data were analysed using SPSS 21.0 (IBM SPSS, USA). Significance was set at p<0.05.
Results
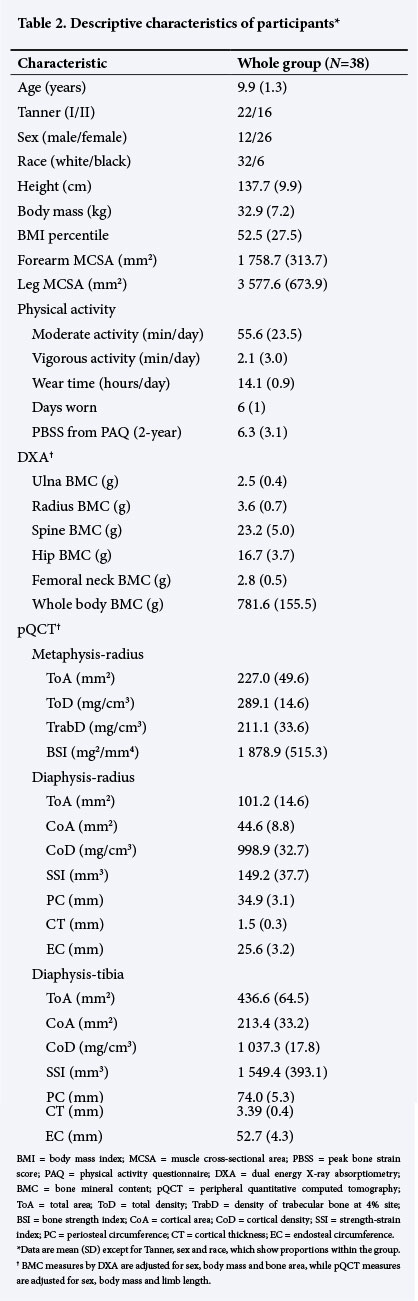
Seven children were excluded from the analysis due to a lack of Actical data that met the criteria for a 'wear' day. Therefore 38 children's data were included in the final analysis. Participant characteristics are shown in Table 2.
Relationship between PBSS and Actical-derived PA
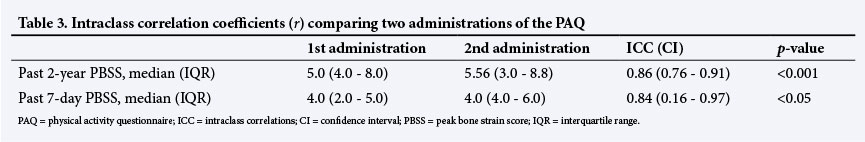
The 2-year and 7-day PBSSs were comparable between administrations and demonstrated high intraclass correlations (Table 3). There were significant positive correlations between PBSS and moderate (r=0.38; p=0.02), vigorous (r=0.36; p=0.03) and combined MVPA (r=0.38; p=0.02).
Bivariate correlations between activity and bone
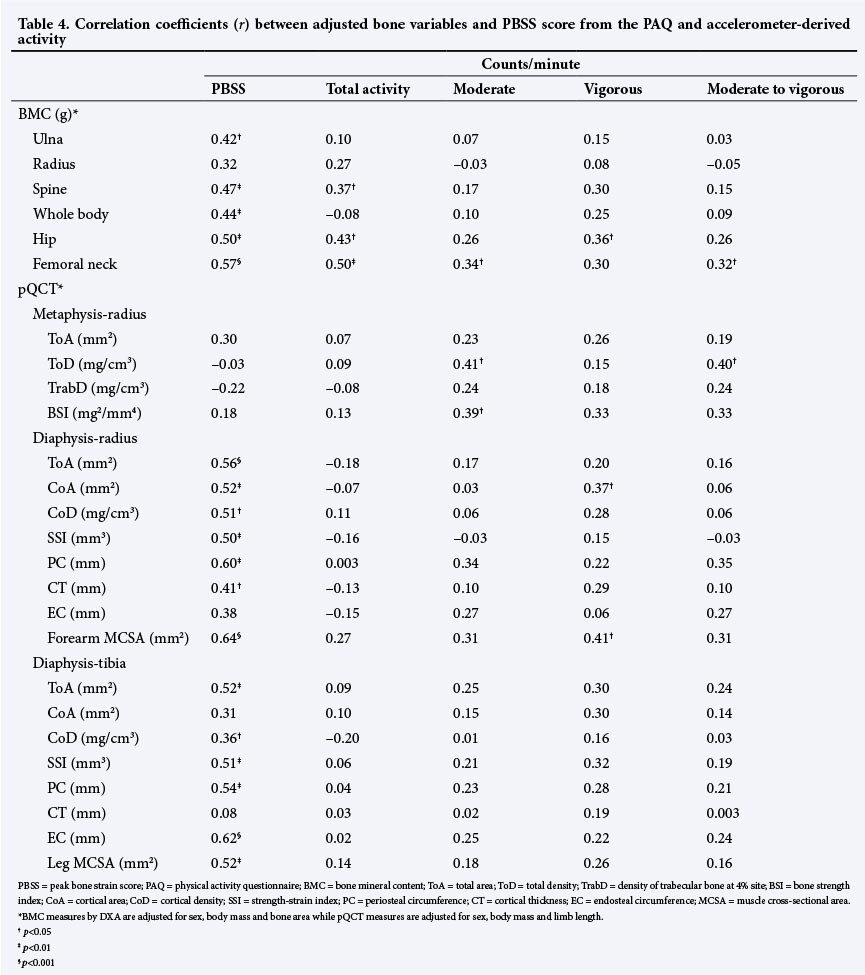
PBSS was significantly correlated to body size-adjusted BMC at all sites scanned by DXA (except the radius) (Table 4). In addition, at the 65% radius, correlations were significant for total area (ToA) (p<0.001), CoA (p=0.001), cortical density (CoD) (p=0.001) and strength-strain index (SSI) (p=0.002). PBSS was also significantly correlated to PC (p=0.003) and CT (p=0.05) of the radius at the 65% site. At the 65% site of the tibia, ToA (p=0.001), CoD (p=0.03), SSI (p=0.001), PC (p=0.001) and EC (p=0.006) were all significantly and positively correlated to PBSS. PBSS was also significantly correlated to both arm (p<0.001) and leg (p=0.002) MCSA.
Total activity (counts/min) as measured by accelerometry was significantly correlated to body size-adjusted BMC at the spine (p=0.04), hip (p<0.001) and femoral neck (p<0.001). However, total activity was not correlated to any of the bone variables measured by pQCT. Similarly, moderate activity was significantly correlated to BMC at the femoral neck (p=0.04), whereas vigorous activity was correlated to BMC at the hip (p=0.03). When both moderate and vigorous activity were combined, significant correlations were seen for BMC at the femoral neck only (p=0.05). At the 4% radius, significant correlations between moderate activity and MVPA combined were seen for total density (p=0.01 and p=0.01, respectively). Moderate activity was also correlated to BSI at the 4% radius (p=0.02). Vigorous activity was correlated to CoA (p=0.03) and forearm MCSA (p=0.01) at the 65% radius. There was no correlation between either moderate or vigorous activity and other pQCT-measured radial bone variables.
There was a trend for ToA (p=0.07) and CoA (p=0.08) of the tibia to be correlated to vigorous activity. Significant correlations were observed between forearm MCSA and moderate-intensity activity.
Linear regression analysis
A summary of the results from the multiple linear regression analysis is presented in Table 5. Although small, PA as assessed by the PBSS explained significantly more variance in BMC of the femoral neck, spine and total hip compared to MVPA as measured by the Actical accelerometer. In addition, at the cortical sites of the radius and tibia, variance in area, density and strength were explained more by the PBSS than by MVPA.
Discussion
Whereas we observed moderate correlations between intensity of activity (assessed by the Actical) and bone health indices of the radius and tibia, the associations between accelerometry measures and bone area and content were weaker compared with those observed between the PBSS algorithm and size and content of bone. In the current study, MVPA was moderately associated with PBSS. Nor Aini et al. [3] (in children of similar age to our study) showed less-strong associations between their PAQ and Actical-derived moderate activity, due in part to their participants over- or underreporting vigorous activities.[3] We may have observed stronger correlations between objectively measured activity and PBSS because we assessed activity over 2 years to account for variations in annual changes in sport.
Similar to other studies that have found associations between PAQs and BMC at the femoral neck, hip and spine,[1] in our study PBSS was not only significantly associated with spine, hip and femoral neck BMC but also with ulna BMC. Children who take part in upper-extremity sports have greater bone mass, strength and area at the proximal and distal radius.[18] On secondary analysis, we found that participation in tennis (in both boys and girls) and netball (in girls) - sports that use arm movement - was common in children who participated in this study (n=24 taking part in at least one of the abovementioned sports on a regular basis). In our study, PBSS was also associated with forearm and leg muscle cross-sectional area, indicating the ability of the score to reflect the close relationship that exists between muscle and bone. Our study also indicated the usefulness of the PBSS algorithm in predicting bone size and geometry as measured by pQCT. Farr et al.[8] investigated associations between a PAQ and pQCT bone measures and reported that associations between a past-year PA recall and BSIs were stronger than between pedometry and bone outcomes. Similarly, in the present study, stronger associations between PBSS and area of cortical bone, BSI and PC were observed, than between accelerometery and bone outcomes. The fact that the PAQ in the present study was bone-specific was the most probable reason that strong correlations were seen between the PBSS and bone outcomes measured by pQCT and DXA.
In our study, we did not find that vigorous-intensity activity was more closely related to BMC than moderate, as has been shown previously.[1,19] Rather, we found that moderate and combined MVPA were significantly associated with BMC at the femoral neck, whereas vigorous activity was associated with BMC at the hip only. The positioning of the accelerometer on the hip as well as its limited ability to accurately detect movement in three-dimensional planes may have been a reason for associations in activity only being evident at the hip and femoral neck but not at any of the other sites assessed by DXA.
At the metaphysis of the radius, a site that is susceptible to wrist fracture during growth, moderate and combined MVPA were associated with bone strength, while at the cortical tibia only vigorous activity was associated with bone strength. Previous studies that have examined associations between BSIs at the radius and tibia and activity-measured accelerometry[12,13] report similar findings to those of our study. Pedometers are not as accurate a method of assessing activity as accelerometry[2] and the strength of the relationships reported in the Farr et al.[11] study (using pedometers) was not as strong as seen in our study. Farr et al. also showed that girls with the highest levels of duration and frequency of weight-bearing activity had greater strength at the tibia compared to girls with lower levels of weight-bearing activity without any changes in CoD.[11] Vigorous activity was associated with CoA at the radius but no significant association was seen between vigorous activity and radial strength. A study in prepubertal tennis players, however, has shown that resistance to torsion and bending (i.e. greater SSI) is due to increases in CoA as a result of periosteal apposition, and not necessarily bone density.[20]
Study limitations
The two-dimensional nature of DXA measurements is consistently problematic in interpreting bone data in children. However, we controlled for this by limiting participation in this study to children who were classified as being prepubertal and using appropriate body size covariates in the statistical analysis. The Actical has limited ability to accurately assess the intensity of specific types of activity, such as weight-bearing activities, cycling and swimming, and the positioning of the Actical may also have contributed to the difference in associations seen between the PBSS and the Actical. The use of different cut points for MVPA may also have contributed to the discrepancy in results between studies, therefore this study may only apply to activity studies using the Actical accelerometer. In addition, the fact that the Actical and the PBSS measure activity in different ways may be considered a limitation of the study. The PBSS has a loading component built into the calculation (i.e. estimates of ground reaction force), whereas the Actical accelerometer measures energy expenditure. Therefore the bone outcomes may be more closely associated with the PBSS than the Actical for this reason only. However, we believe that our results still reflect the benefits of participation in weight-bearing PA rather than the biasing toward a more effective tool of assessment. The load values assigned to activities reported on in our PAQ are based on PBSSs reported in the literature and we acknowledge that we did not measure ground reaction forces in our sample. In our study, vigorous activity was not quite significantly correlated to tibial total and CoA (p=0.07 and p=0.08, respectively) but this may be due to the small sample size and the relatively low levels of participation in vigorous activity in this cohort of children. We recommend similar analyses to be conducted in a larger sample size in the future.
Conclusion
We have shown that the bone-specific component of our PAQ (PBSS algorithm) is useful in the assessment of the relationship between participation in weight-bearing sport and bone health in prepubertal children. While the PBSS algorithm was a significant predictor of bone health measured by DXA and pQCT, accelerometer-measured activity did not predict bone health to the same extent as the PBSS. In conclusion, the PBSS generated from the PAQ can be used to reliably and accurately collect data on participation in weight-bearing exercise.
References
1. Janz KF, Burns TL, Levy SM, et al. Everyday activity predicts bone geometry in children: The Iowa Bone Development Study. Med Sci Sports Exerc 2004;36(7):1124-1131. [http://dx.doi.org/10.1249/01.MSS.0000132275.65378.9D] [ Links ]
2. Ryan J, Gormley J. An evaluation of energy expenditure estimation by three activity monitors. Eur J Sport Sci 2013;13(6):681-688. [http://dx.doi.org/10.1080/17461391.2013.776639] [ Links ]
3. Nor Aini J, Poh BK, Chee WSS. Validity of a children's physical activity questionnaire (cPAQ) for the study of bone health. Pediatr Int 2013;55(2):223-228. [http://dx.doi.org/10.1111/ped.12035] [ Links ]
4. McVeigh JA, Norris SA. Criterion validity and test-retest reliability of a physical activity questionnaire in South African primary school-aged children. South African Journal of Sports Medicine 2012;24(2):43-48. [http://dx.doi.org/10.7196/sajsm.178] [ Links ]
5. McVeigh JA, Norris SA, Cameron N, Pettifor JM. Associations between physical activity and bone mass in black and white South African children at age 9 yr. J Appl Physiol 2004;97(3):1006-1012. [http://dx.doi.org/10.1152/japplphysiol.00068.2004] [ Links ]
6. Thandrayen K, Norris SA, Pettifor JM. Fracture rates in urban South African children of different ethnic origins: The birth to twenty cohort. Osteoporos Int 2008;9(1):20:47-52. [http://dx.doi.org/10.1007/s00198-008-0627-x] [ Links ]
7. Economos CD, Hennessy E, Sacheck JM, Shea MK, Naumova EN. Development and testing of the BONES physical activity survey for young children. BMC Musculoskelet Disord 2010;11:195. [http://dx.doi.org/10.1186/1471-2474-11-195] [ Links ]
8. Farr J, Blew R, Lee V, Lohman T, Going S. Associations of physical activity duration, frequency, and load with volumetric BMD, geometry, and bone strength in young girls. Osteoporos Int 2011;22(5):1419-1430. [http://dx.doi.org/10.1007/s00198-010-1361-8] [ Links ]
9. Seeman E, Delmas PD. Bone quality - the material and structural basis of bone strength and fragility. N Engl J Med 2006;354(21):2250-2261. [http://dx.doi.org/10.1056/NEJMra053077] [ Links ]
10. Binkley TL, Berry R, Specker BL. Methods for measurement of pediatric bone. Rev Endocr Metab Disord 2008;9(2):95-106. [http://dx.doi.org/10.1007/s11154-008-9073-5] [ Links ]
11. Farr JN, Lee VR, Blew RM, Lohman TG, Going SB. Quantifying bone-relevant activity and its relation to bone strength in girls. Med Sci Sports Exerc 2011;43(3):476-483. [http://dx.doi.org/10.1249/MSS.0b013e3181eeb2f2] [ Links ]
12. Sayers A, Mattocks C, Deere K, Ness A, Riddoch C, Tobias JH. Habitual levels of vigorous, but not moderate or light, physical activity is positively related to cortical bone mass in adolescents. J Clin Endocrinol Metab 2011;96(5):e793-e802. [http://dx.doi.org/10.1210/jc.2010-2550] [ Links ]
13. Deere K, Sayers A, Rittweger J, Tobias JH. A cross-sectional study of the relationship between cortical bone and high-impact activity in young adult males and females. J Clin Endocrinol Metab 2012;97(10):3734-3743. [http://dx.doi.org/10.1210/jc.2012-1752] [ Links ]
14. De Ridder CM, Kemper HCG, Bertens MJM, et al. Concurrent validity of a weight-bearing activity questionnaire in prepubertal and pubertal girls and boys. Ann Hum Biol 2002;29(3):237-246. [http://dx.doi.org/10.1080/03014460110075701] [ Links ]
15. Tanner JM. Normal growth and techniques of growth assessment. Clin Endocrinol Metab 1986;15:411-451. [ Links ]
16. Groothausen J, Siemer H, Kemper HCG, Twisk J, Welten DC. Influence of peak strain on lumbar bone mineral density: An analysis of 15-year physical activity in young males and females. Pediatr Exerc Sci 1997;9(2):159-173. [ Links ]
17. Puyau MR, Adolph AL, Vohra FA, Zakeri I, Butte NF. Prediction of activity energy expenditure using accelerometers in children. Med Sci Sports Exerc 2004;36(9):1625-1631. [http://dx.doi.org/10.1249/01.MSS.0000139898.30804.60] [ Links ]
18. Burt LA, Greene DA, Ducher G, Naughton GA. Skeletal adaptations associated with prepubertal gymnastics participation as determined by DXA and pQCT: A systematic review and meta-analysis. J Sci Med Sport 2013;16(3):231-239. [http://dx.doi.org/10.1016/j.jsams.2012.07.006] [ Links ]
19. Sardinha LB, Baptista F, Ekelund U. Objectively measured physical activity and bone strength in 9-year-old boys and girls. Pediatrics 2008;122(3):e728-e736. [http://dx.doi.org/10.1542/peds.2007-2573] [ Links ]
20. Bass SL, Saxon L, Daly RM, et al. The effect of mechanical loading on the size and shape of bone in pre-, peri-, and postpubertal girls: A study in tennis players. J Bone Miner Res 2002;17(12):2274-2280. [http://dx.doi.org/10.1359/jbmr.2002.17.12.2274] [ Links ]
 Correspondence:
R Meiring
rebecca.meiring@wits.ac.za

