


Serviços Personalizados
Artigo
 Inglês (pdf)
 Artigo em XML
 Referências do artigo
Indicadores

Links relacionados
-
 Citado por Google
 -
 Similares em Google
Compartilhar

 Permalink
South African Journal of Chemistry
versão On-line ISSN 1996-840X
versão impressa ISSN 0379-4350
S.Afr.j.chem. (Online) vol.78 Durban 2024
http://dx.doi.org/10.17159/0379-4350/2024/v78a06
RESEARCH ARTICLE
Development of physicochemical methods for the quantification of CBD in South African cannabis-based consumer goods
Marwaan Rylands; Daniel A. Kusza; Nduduzo Hlabisa; Thandazani Gwampa; Neil Ravenscroft
Department of Chemistry, University of Cape Town, Rondebosch, Cape Town, South Africa
ABSTRACT
In this study, various cannabis-based products were analysed for their cannabidiol (CBD) and ∆-9-tetrahydrocannabinol (∆9-THC) content. Thirteen samples were analysed using proton nuclear magnetic resonance (1H NMR) spectroscopy, with a subset further analysed by high pressure liquid chromatography (HPLC). In South Africa, it is currently required that the amount of CBD present in a sales pack should not exceed 600 mg, with the maximum dose in an individual unit being 20 mg, while the concentration of ∆-9-THC in processed products should not exceed 0.1% w/w. This study found that 85% of the products analysed had some degree of incorrect labelling with respect to CBD and THC content. Significant amounts (>1% w/w) of ∆-9-THC were also detected in 23% of the products that were tested. This method was also applied to 6 Cannabis plant extracts, which are used in the production of some of the cannabis-based goods. The concentrations of CBD and THC in both the goods and extracts, as determined by NMR spectroscopy, were in good agreement with concentrations determined orthogonally by HPLC. Analysis by 1H NMR spectroscopy, in particular, is shown to be a rapid and robust method for detecting and quantifying CBD and ∆-9-THC in cannabis-based products.
Keywords: cannabis, cannabinoids, CBD, THC, NMR spectroscopy
INTRODUCTION
The widespread availability and use of cannabis-based consumer goods, particularly those containing cannabidiol (CBD), have surged in recent years, both in South Africa and globally. These products have garnered attention for their potential therapeutic benefits and have gained significant popularity among consumers.1 Cannabis-based goods are produced using extracts, isolates or other components of Cannabis plants (s.a Cannabis sativa L.). The Cannabis plants contain a myriad of bioactive compounds, including cannabinoids, terpenes, and flavonoids. The most commonly extracted and isolated compounds are the cannabinoids which include cannabidiol (CBD), ∆-9-tetrahydrocannabinol (∆-9-THC), tetrahydro-cannabinolic acid (THCA), cannabinol (CBN) and ∆8-tetrahydrocannabinol (∆8-THC) (Figure 1).
CBD is reportedly associated with a wide variety of potential health benefits, while ∆-9-THC is the major psychoactive component in the cannabis plant.2,3 Most commercial products are therefore expected to contain CBD and no THC. South African consumers in particular, have access to a wide range of cannabis-derived products offered by retail outlets and informal traders. Many of these products are produced locally and include CBD containing foods and drinks, massage oils, tinctures, and e-cigarette liquids, among others.4 The South African cannabis and cannabis-related goods industry was estimated to be worth R87.7 million in 2021, with the industry projected to grow to R406.3 million in 2026.5 There is also an apparent positive shift in public perception regarding cannabis and cannabis-based products, which may be connected to the increase in research outputs highlighting the potential medicinal and therapeutic effects of cannabis and associated cannabinoids.6-8 However, the lack of testing and standardized analytical methods for the quantification of CBD and other bioactive compounds in these goods poses challenges for quality control, regulatory compliance, and consumer safety. A number of products have reportedly been marketed as "THC free" but have been found to contain high levels of ∆-9-THC.4,9 This study therefore aimed to contribute to the development of methods for the quantification of cannabinoids, focusing on CBD and THC, in South African cannabis-based consumer goods.
With a range of diverse products continually expanding and marketed for various health benefits, including relaxation and pain relief. There are, understandably, a number of guiding global and national regulatory policies which aim to regulate this massive market. For example, the South African Cannabis bill is a comprehensive legislative framework aimed at enabling the industry and its partners to promote the cannabis economy and protect consumers. For this study, the focus was on two aspects of such policy, which related to the amounts of CBD and THC legally allowed in cannabis-derived products. The bill states that the mass of CBD present in a sales pack should not exceed 600 mg and the maximum dose in an individual unit may not exceed 20 mg. In addition, the concentration of THC in processed products should not exceed 0.1%.
There are many more laws and specific regulations that govern the production, distribution, and sale of cannabis-based goods, however, whether these regulations are being implemented and adhered to remain unclear. A recent study by the South African National Analytical Forensics Service (NAFS) found that very few of the tested cannabis-based products adhered to the legal South African Industrial THC limit, using GC-MS and HPLC-UV to detect and quantify the cannabinoids. These results present a number of public health and safety concerns and demonstrate a clear lack of oversight and enforcement of the regulations.4 Some of these products, although touted for their potential benefits, can pose risks if not properly regulated. Factors such as inconsistent product quality, inaccurate labelling, and the presence of contaminants or adulterants can adversely affect consumer safety.10-12 Establishing analytical methods for cannabinoid quantification may contribute to the development of robust quality control measures and ensures consumer protection. It is therefore of interest to develop appropriate physicochemical methods to reliably determine the concentrations of THC and CBD, given the diverse range and forms of products available.
One technique with potential application in cannabis and cannabis-based goods analysis is proton nuclear magnetic resonance (1H NMR) spectroscopy. 1H NMR spectroscopy has been used extensively in industry and academia to investigate and validate product label claims. For example, 1H NMR spectroscopy has been used to determine the concentration of nicotine in e-cigarette liquids and caffeine in coffee.13,14 For this study, the cannabinoids of interest, CBD and THC, are known to have unique, distinguishable 1H NMR spectra, with one of the key signals being H-2 of the cyclohexenyl moiety.12
The NMR spectra of CBD and THC each display unique resonances which, because of the generally insensitive nature of the chemical shift, allows for their relative and absolute quantitation, using quantitative NMR or qNMR. In addition to NMR, chromatographic techniques such as HPLC are commonly used to determine cannabinoid content. Unlike NMR, HPLC requires the use of certified reference standards, however, HPLC-UV is considered more sensitive with greater limits of detection. In this study, both techniques were employed, with the overall aim being to quantify the amount of CBD in products, in order to determine if the analysed products were accurately labelled, specifically with respect to cannabinoid content. A further objective of this study was to develop a method to prepare samples for both qNMR and qHPLC analysis, which could be broadly applied to different types of cannabis-based products.
EXPERIMENTAL METHODS
A comprehensive approach was adopted, involving method development and validation for CBD quantification. Initially, various sample preparation techniques were explored to extract CBD and/or THC from different product matrices, such as oils and edibles. Since there were so many different types of products on offer, optimization of extraction parameters, including solvent selection, extraction time, and temperature, was performed to maximize CBD recovery and minimize interference from other components.
Sampling
Most of the cannabis products used in this study are commercially available. Some products were purchased at the Cannabis Expo (Sun Exhibits - Grand West, Cape Town, 23-27 March 2022) and from the online marketplace, Takealot, while others were received as marketing samples from local manufacturers. The cannabis-based goods were analysed directly or, an extract thereof was prepared for analyses.
Extracts from solid materials: 80-90 mg of a sample was cryo-milled and 1 mL of ethyl acetate was added to the material. The suspensions were sonicated in an ice bath for 15 minutes and centrifuged for 3 minutes at a speed of 12 000 rpm. Thereafter, 850 ||L of the supernatant was collected for analysis.
Extracts from aqueous products: Extracts were prepared by extracting with an equal volume of ethyl acetate, which were then concentrated under reduced pressure and used for analyses.
Materials
Purified CBD isolate (99.7%) was generously provided by Afrigen Ltd. (South Africa). Certified reference standards of ∆-9-THC, CBD and CBN (1 mg/mL in 1mL CAN, each) were imported under license by LGC (South Africa) from Dr Ehrensdorfer (Germany). All products and standards were stored at 4 oC prior to analysis. Formic acid (98100%), deuterated chloroform (CDCl3, 99.8%) and anthracene (99%) were purchased from Merck (Darmstadt, Germany) and used without further purification. Analytical grade ethyl acetate, acetonitrile and methanol were purchased from Merck and/or Kimix Chemicals (South Africa) and all aqueous solutions were prepared using milliQ water. The cannabis research was authorised by the Department of Health and the South African Health Product Regulatory Authority (SAHPRA) who issued a research permit (Permit No: POS 004/2022/2023) in terms of Section 22a(9)(a)(i) of the Medicines and Related Substances Act 1965, (Act 101 of 1965) to acquire, possess and use schedule 6 and 7 substances for education purposes.
NMR analyses
The analysis and preparation of the cannabis-based products were adapted from a reported procedure previously used in the analysis of cannabis flower.15,16 The samples were prepared for NMR analysis by dissolving the product or extract in CDCl3 together with an internal standard.
Preparation of samples for NMR analyses: 1 mL of CDCl3 was added to 1-10 mg ofthe cannabis-based product and 1 mg of anthracene. The resulting solutions were then transferred to a 5 mm NMR tube for 1H measurement. All product samples were prepared in triplicate.
Preparation of standard solutions: Standard solutions of CBD and THC were prepared at concentrations of 0.1-10 mg/mL in CDCl3. The standard solutions were prepared in triplicate, each at concentrations of 0.1, 1, 2, 4, 6 and 10 mg/mL, with an IS concentration of 1 mg/mL. The resulting solutions were then transferred to a 5 mm NMR tube for 1H measurement. The calibration curves were evaluated by integrating specific resonances of the selected compounds against the IS. All NMR measurements were performed on a Bruker 400 Ultrashield Plus spectrometer (Bruker Biospin, Rheinstetten, Germany) equipped with a 5 mm BBO probe, using a Bruker Automatic Sample Changer (SampleXpress lite) and all spectra were acquired at 300.0 K. 1H NMR spectra were acquired using a Bruker standard 1D zg pulse sequence with 8 scans (NS) and 4 prior dummy scans (DS). A relaxation delay (D1) of 1-10 sec and pulse (P1) of 10.4 msec were also used. The sweep width (SW) was 19.9914 ppm and the time domain of the FID was 65536 (65 k). To quantify CBD and THC, separate peaks corresponding to each substance were identified and integrated against anthracene as an intensity reference using TopSpin v. 3.2 (Bruker Biospin, Rheinstetten, Germany).
HPLC analyses
HPLC analysis was performed on an Agilent 1260 Infinity II (Agilent Technologies, Santa Clara, CA) Series LC system equipped with a degasser, quaternary pump, autosampler, thermos column compartment and a variable wavelength detector (VWD). Sample data was acquired and processed using Agilent OpenLAB software.
Preparation of samples for HPLC analyses: 10 μL of the sample or extract was added to 980 μL of methanol and 10 μL of 1.053 mg/mL ibuprofen (IBU) as the internal standard. The solution was filtered using a 0.22 μL nylon filter and transferred into an HPLC vial for analysis. HPLC analysis was performed on an Infinity Lab Poroshell 120 ECC18 column (4.6 x 150 mm) heated at 50 oC. The aqueous and organic mobile phases used were 0.1% formic acid in H2O and 0.05% formic acid in MeOH. The autosampler injected 5 μL aliquots at a flow rate of 1 mL/min and at an initial gradient of 25% to 5% aqueous mobile phase over 6 min, thereafter, returning to 25% aqueous mobile phase over 10 min, with a 2.5 min hold of 25%. The VWD detector was set to 230 nm with a signal peak width of > 0.0063 min (80 Hz).
Preparation of standard solutions: Working calibration standards were prepared by serial dilutions of a stock solution containing 50 mg/mg of each CBD and ∆-9-THC in ACN to produce concentrations of 50, 16.667, 5.555, 1.852, and 0.617 μg/mL. Each sample was spiked with 10 (μl of 1.503 mg/mL of IBU as the internal standard.
RESULTS AND DISCUSSION
The developed methods exhibited excellent linearity and sensitivity for CBD and THC at the concentrations found in goods and extracts. The accuracy can also be commented on since two orthogonal methods of analysis were used. The spectroscopic method showed promising results for CBD quantification, particularly in matrices where chromatographic techniques were less suitable. Studies were conducted to assess the reliability and robustness of the developed methods. Parameters such as limit of detection (LOD), limit of quantitation (LOQ), repeatability and stability were evaluated according to established guidelines. The results indicated that 1H NMR spectroscopy, in particular, was suitable for the quantification of CBD in various cannabis-based consumer goods, providing confidence in their application for routine analysis (Figure 2).
Quantitative analysis by qNMR and qHPLC
qNMR Analysis: The quantitative analysis of cannabis-based goods and cannabis extracts was conducted using both 1H qNMR and quantitative high-performance liquid chromatography (qHPLC) techniques. The qNMR spectra were recorded and anthracene was utilized as an internal standard due to its non-overlapping peaks with the cannabinoids (Figure 3). The relative integrals of the selected peaks of THC and CBD were quantified through the topspin NMRq function using topspin V.3.2.
qHPLC Analysis: Concurrently, the quantification of cannabinoids were performed using qHPLC and, to ensure the reliability and accuracy of the quantification results, the data obtained from both qNMR and qHPLC were compared. The concentrations of THC and CBD obtained from the qNMR analysis were generally in good agreement with the values obtained from qHPLC. This correlation between the two independent analyses further supports the accuracy and validity of the quantitative results.
From the analysed products, 8 cannabis-based products were analysed using both qHPLC and qNMR, and out of all these eight products, only one product was found to be accurately labelled in terms of CBD concentration and the absence of THC, while the other products were found to have some degree of incorrect labelling. One product label indicated that 10 mL of the product contained 1000 mg of CBD, however, CBD was not detected using both NMR and HPLC.
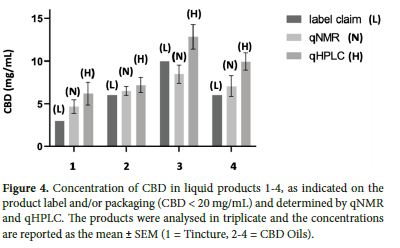
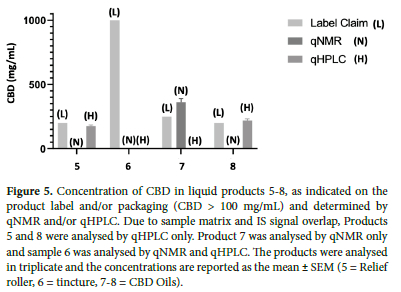
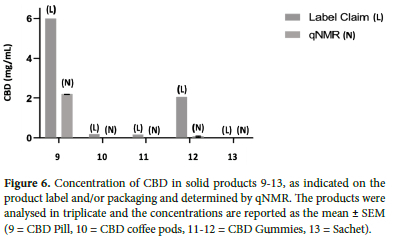
Products 1-4 were liquid products that, based on the label claim, were expected to contain relatively low amounts of CBD (<20 mg/mL) and no THC (Figure 4). Apart from product 3, the remaining products all contained more CBD than declared, with both qNMR and qHPLC data indicating an 18-55% (qNMR), 20-66% (qHPLC) greater mean concentration of CBD, compared to the label claim. Products 5-8 were also liquids and so could be analysed directly without the need for prior extraction. These products claimed to contain higher concentrations of CBD (200-1000 mg/mL). Products 5-8 were found to contain CBD at a range close to the label claims, while product 7 contained significantly more (Figure 5). Product 6 indicated that it contained 1000 mg/mL of CBD but both qNMR and qHPLC did not detect CBD nor any other cannabinoid. Products 9-13 were solids and required sample preparation for analyses. In these products, CBD was either not detected or, CBD content was found to be much lower than the label claim (10-30%) (Figure 6).
Some additional samples that were analysed included CBD-infused honey and a CBD vape liquid, in both cases no CBD were detected, however significant amounts of ∆-9-THC were found (Figure 7). For the honey sample, no concentrations or warnings were listed on the product label, however, it was found to contain 1% by weight THC. Interestingly, the CBD-infused honey was being marketed locally as a natural sleep aid and was submitted for analyses by a third party who had reported experiencing heart palpitations after use. There are number of such cases reported globally which further demonstrates the concern around testing cannabis-based products labelling.17-19 For the vape liquid sample, the CBD label claim was 20 mg/mL with zero THC and, from the qNMR analyses, the CBD concentration was found to be 15.2 ± 5.6 mg/mL with no THC detected.
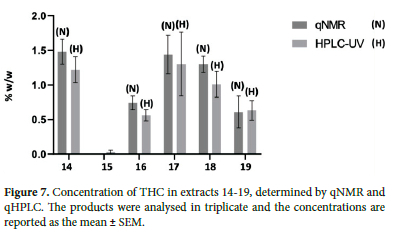
The extraction methods and analyses were also applied to extracts from local flower samples. CBD was not detected in the extracts, however, THC was detected and quantified using both qNMR and qHPLC and again, the concentrations determined were generally in good agreement. With percentage differences between concentrations determined by qNMR and qHPLC ranging between 2-20%.
Both nuclear magnetic resonance NMR spectroscopy and HPLC are powerful analytical techniques which were successfully used in the analysis of cannabis-based goods and flower extracts. Each technique had its advantages and limitations and, with some samples, it was only possible to use one of the two techniques. This was generally due to differences in the sample matrix.
NMR was found to be the cheaper, faster and more direct method, with a total experiment time, including sample preparation, of around 5 minutes based on the optimised 1H NMR acquisition parameters. The technique also does not rely on certified reference standards, although they may be used in combination with an internal standard for reference calibration curves. It is however important to note that NMR does have lower sensitivity compared to HPLC, especially for trace-level analysis, and that the NMR instrumentation itself is relatively expensive. Some of the validation aspects of the NMR method were further explored.
Method Development, Optimization and Validation
Calibration curves for CBD using a concentration range of 1-10 mg/mL were constructed using 1H NMR spectroscopy (Figure 8). The CBD samples, along with the internal standard anthracene, were analysed by 1H NMR spectroscopy, resulting in distinct peaks for both the internal standard and CBD. The relative integral values of each CBD sample were plotted against the concentration of CBD, generating a calibration curve that demonstrated good linearity and a high correlation coefficient (R2 > 0.99).
The robustness of the qNMR method was assessed by evaluating the effects of varying solvents and NMR parameters, such as the D1 delay. The analysis of CBD using different CDCl3 sources showed low standard deviations in the relative integral values across different solvents, as well between the same samples 12 hrs apart, indicating that the quantification results were not significantly affected by changes in solvent sources and, that the cannabinoids and internal standard were stable over the period of analysis. Furthermore, variations in NMR parameters did not result in significant differences in CBD concentrations, confirming the stability and reliability of the qNMR method as standalone analysis. The agreement between the qNMR and qHPLC data provides strong evidence for the accuracy and reliability of both analytical techniques in quantifying the cannabinoids in cannabis-based goods and flower extracts. The consistency in the quantification results obtained from these two independent methods adds robustness to the overall analysis.
Although only a subset of samples were analysed by HPLC, the cannabinoids of interest were easily identified and separated by chromatography. The two solvent systems used were 0.1% formic acid in water as mobile phase A, and the other was 0.05% formic acid in methanol as mobile phase B. The elution method started with a gradient of 25% to 5% mobile phase A over 6 min, followed by a return to 25% mobile phase A over a 4 min period, thereafter, holding at 25% mobile phase A for a further 2.5 min. The reference cannabinoids eluted in the following order: CBD, CBN, THC.
Calibration curves of the cannabinoid standards were constructed from a stock solution of 50 μg/mL of each cannabinoid in acetonitrile (Figure 9). These calibration curves were used to quantify the cannabinoids in each sample. Although this study only focused on CBD and THC, cannabinol (CBN) was also included, since a certified reference material for it was available, and, it is considered a degradation product of the psychoactive THC, which according to South African regulation, should not be present in samples. The degree of linearity was assessed by the correlation coefficients of the resultant standard curves (R2 = 0.999) and, Ibuprofen (IBU) was used as an internal standard to normalize the absorption readings to account for instrumental variations. IBU was chosen as an internal standard because it did not interfere with the cannabinoid peaks, appearing at a retention time of 3.688 min under the described conditions. It was initially intended that the same IS used for NMR analyses would be used in the HPLC quantification. However, the anthracene interfered with sample signals and, due to the signal overlap, an alternative internal standard had to be employed.
While this study focused on only NMR and HPLC, there are a number of other methods reported based on infrared (IR) spectroscopy. IR spectroscopy offers a potentially cheaper and more accessible approach to CBD determination, especially because there are a growing number of high quality, portable IR spectrometers being developed, which could be used by manufacturers and cannabis regulating bodies for easy, on-site analysis.20,21 However, these approaches generally provide estimates of cannabinoid content only, and usually have higher limits of detection relative to both HPLC and NMR analyses.
CONCLUSIONS
The combined analysis of cannabis-based goods and flower extracts using qNMR and qHPLC techniques demonstrated consistent results. The validation of the qNMR method for CBD quantification, in particular, along with the agreement between qNMR and qHPLC data, further strengthened the accuracy and reliability of the analysis. These findings contribute to the ongoing development of much needed quality control measures, facilitating the analysis of local cannabis-based goods. The development of reliable and accurate physicochemical methods for the quantification of CBD in South African cannabis-based consumer goods is essential for consumer safety and 1H NMR spectroscopy has been shown to be a rapid means of evaluating product label claims.
ACKNOWLEDGEMENTS
The authors would like to thank and acknowledge the staff of the University of Cape Town Cannabis Research Consortium (UCRC) who assisted with the study, Ms Pei-yin Liebrich (UCT), Dr Cesarina Edmonds-Smith (UCT). The authors would also like to thank UCT research contracts and innovation (RCI) for the funding provided (pre-seed fund, C22-001), and Mr Boyd Hutchings for CBD samples provided.
ORCID IDS
Marwaan Rylands: https://orcid.org/0000-0001-6833-3299
Daniel Kusza: https://orcid.org/0000-0002-4930-5855
Thandazani Gwampa: https://orcid.org/0000-0001-7407-8773
Nduduzo Hlabisa: https://orcid.org/0000-0003-1595-554X
Neil Ravenscroft: https://orcid.org/0000-0001-8476-5630
REFERENCES
1. Riley S, Vellios N, van Walbeek C. An economic analysis of the demand for cannabis: some results from south africa. Drugs Educ Prev Policy. 2020;27(2):123-130. https://doi.org/10.1080/09687637.2019.1581139. [ Links ]
2. White CM. A review of human studies assessing cannabidiol's (cbd) therapeutic actions and potential. J Clin Pharmacol. 2019;59(7):923-934. https://doi.org/10.1002/jcph.1387. [ Links ]
3. Kaufmann R, Kraft B, Frey R, Winkler D, Weiszenbichler S, Backer C, Kasper S, Kress H. Acute psychotropic effects of oral cannabis extract with a defined content of δ9-tetrahydrocannabinol (thc) in healthy volunteers. Pharmacopsychiatry. 2010;43(1):24-32. https://doi.org/10.1055/s-0029-1237397. [ Links ]
4. Viviers HJ, Petzer A, Gordon R. An assessment of the potency related to cannabis-based products in the south african market. Forensic Sci Int. 2021;322:110754. https://doi.org/10.1016/j.forsciint.2021.110754. [ Links ]
5. Insight Survey. South african cannabis/cbd industry landscape. 2022. https://insightsurvey.co.za/wp-content/uploads/2022/02/SA-Cannabis-CBD-Industry-Landscape-Brochure-2022.pdf. [ Links ]
6. Baron EP. Medicinal properties of cannabinoids, terpenes, and flavonoids in cannabis, and benefits in migraine, headache, and pain: an update on current evidence and cannabis science. Headache. 2018;58(7):1139-1186. https://doi.org/10.1111/head.13345. [ Links ]
7. Sampson PB. Phytocannabinoid pharmacology: medicinal properties of cannabis sativa constituents aside from the "big two". J Nat Prod. 2021;84(1):142-160. https://doi.org/10.1021/acs.jnatprod.0c00965. [ Links ]
8. Hazekamp A, Fischedick J. Cannabis-from cultivar to chemovar. Drug Test Anal. 2012;4(7-8):660-667. https://doi.org/10.1002/dta.407. [ Links ]
9. Hammond D. Communicating thc levels and 'dose'to consumers: implications for product labelling and packaging of cannabis products in regulated markets. Int J Drug Policy. 2021;91:102509. https://doi.org/10.1016/j.drugpo.2019.07.004. [ Links ]
10. Schonhofen P, Bristot IJ, Crippa JA, Hallak JEC, Zuardi AW, Parsons RB, Klamt F. Cannabinoid-based therapies and brain development: potential harmful effect of early modulation of the endocannabinoid system. CNS Drugs. 2018;32(8):697-712. https://doi.org/10.1007/s40263-018-0550-4. [ Links ]
11. Sarrafpour S, Urits I, Powell J, Nguyen D, Callan J, Orhurhu V, Simopoulos T, Viswanath O, Kaye AD, Kaye RJ, et al. Considerations and implications of cannabidiol use during pregnancy. Curr Pain Headache Rep. 2020;24(7):38-47. https://doi.org/10.1007/s11916-020-00872-w. [ Links ]
12. Barthlott I, Scharinger A, Golombek P, Kuballa T, Lachenmeier DW. A quantitative 1h nmr method for screening cannabinoids in cbd oils. Toxics. 2021;9(6):136. https://doi.org/10.3390/toxics9060136. [ Links ]
13. Crenshaw MD, Tefft ME, Buehler SS, Brinkman MC, Clark PI, Gordon SM. Determination of nicotine, glycerol, propylene glycol and water in electronic cigarette fluids using quantitative 1h nmr. Magn Reson Chem. 2016;54(11):901-904. https://doi.org/10.1002/mrc.4498. [ Links ]
14. Burton IW, Martinez Farina CF, Ragupathy S, Arunachalam T, Newmaster S, Berrué F. Quantitative nmr methodology for the authentication of roasted coffee and prediction of blends. J Agric Food Chem. 2020;68(49):14643-14651. https://doi.org/10.1021/acs.jafc.0c06239. [ Links ]
15. Lachenmeier DW, Breaux TA, Kuballa T, Schlee C, Monakhova YB. Composition of distilled perique tobacco liqueur: A connoisseur's spirit or a health risk due to nicotine? Food Chem. 2014;159:230-235. https://doi.org/10.1016/j.foodchem.2014.02.152. [ Links ]
16. Hahn J, Monakhova YB, Hengen J, Kohl-Himmelseher M, Schüssler J, Hahn H, Kuballa T, Lachenmeier DW. Electronic cigarettes: overview of chemical composition and exposure estimation. Tob Induc Dis. 2014;12(1):23-34. https://doi.org/10.1186/s12971-014-0023-6. [ Links ]
17. Lall S. CBD oil. Br Dent J. 2020;228(6):395-395. https://doi.org/10.1038/s41415-020-1436-7. [ Links ]
18. Benowitz NL, Rosenberg J, Rogers W, Bachman J, Jones RT. Cardiovascular effects of intravenous delta-9-tetrahydrocannabinol: autonomic nervous mechanisms. Clin Pharmacol Ther. 1979;25(4):440-446. https://doi.org/10.1002/cpt1979254440. [ Links ]
19. Parikh K, Patel M, Bansal T, Raco J, Gupta S, Jain R, Jain R. Cannabis and the heart: unchartered territory. Future Cardiol. 2022;18(11):883-890. https://doi.org/10.2217/fca-2022-0018. [ Links ]
20. Duchateau C, Stévigny C, De Braekeleer K, Deconinck E. Characterization of cbd oils, seized on the belgian market, using infrared spectroscopy: matrix identification and cbd determination, a proof of concept. Drug Test Anal. 2023;dta.3583. https://doi.org/10.1002/dta.3583. [ Links ]
21. Geskovski N, Stefkov G, Gigopulu O, Stefov S, Huck CW, Makreski P. Mid-infrared spectroscopy as process analytical technology tool for estimation of thc and cbd content in cannabis flowers and extracts. Spectrochim Acta A Mol Biomol Spectrosc. 2021;251:119422. https://doi.org/10.1016/j.saa.2020.119422. [ Links ]
Received 30 June 2023
Revised 1 December 2023
Accepted 21 December 2023
* To whom correspondence should be addressed. Email: marwaan.rylands@uct.ac.za

