


Services on Demand
Article
 English (pdf)
 Article in xml format
 Article references
Indicators

Related links
-
 Cited by Google
 -
 Similars in Google
Share

 Permalink
South African Journal of Chemistry
On-line version ISSN 1996-840X
Print version ISSN 0379-4350
S.Afr.j.chem. (Online) vol.78 Durban 2024
http://dx.doi.org/10.17159/0379-4350/2024/v78a05
RESEARCH ARTICLE
Manganese doping effect on Zn0 photocatalytic and electric properties
Zaineb HammamiI; Bilel ChoucheneII; Abdelhak OthmaniIII; Tahar Ben ChaabaneI, ; Raphaël SchneiderII
IUniversité de Carthage, Faculté des Sciences de Bizerte, Laboratoire des composés hétéro-organiques et des matériaux nanostructurés, Jarzouna, Bizerte, Tunisia
IIUniversité de Lorraine, CNRS, LRGP, Nancy, France
IIIUniversité de Carthage, Faculté des Sciences de Bizerte, Laboratoire de Physique des Matériaux: Structure et Propriétés, Zarzouna, Bizerte, Tunisia
ABSTRACT
Mn-doped ZnO nanocrystals with Mn content varying from 0 to 5 at% were successfully synthesized via a simple hydrothermal method. The structural, morphological, and optical properties of the as prepared nanostructures were investigated. The photocatalytic activities of these materials were evaluated by determining the extent of the degradation reaction yield of an organic dye, methyl orange (MO) in an aqueous solution under UV light irradiation. The photodegradation efficiency of MO reached 91% in 180 min for pure ZnO, while all Mn- doped samples showed lower photocatalytic activity according to the following sequence: Zn095Mn005O < Zn099Mn001O < Zn097Mn003O < ZnO. Photocurrent measurements showed that the photocurrent density of ZnO was higher to that of Zn0.97Mn0.03O. In addition, impedance spectroscopy was used to investigate the electrical properties of ZnO and Zn097Mn003O at different temperatures (373-773 K) and various frequencies (10 Hz-13 MHz). The photocurrent density measurements and the explored electrical properties of ZnO and Zn097Mn003O revealed good accordance with the reduced photocatalytic activity of Zn097Mn003O nanocrystals.
Keywords: ZnO, Mn doping, Photocatalysis, Photocurrent, Electrical conductivity
INTRODUCTION
Zinc oxide (ZnO) is one of the most studied semiconductors due to its high stability, low toxicity, and specific physicochemical properties that are at the origin of various applications. Pure or doped ZnO can be prepared by a multitude of synthetic routes, most of which are of low cost and easy to perform including precipitation, sol-gel, polyol process and hydrothermal synthesis etc.1-4 Whether it is pure or metal-doped, ZnO has interesting photocatalytic properties for the chemical degradation of recalcitrant water pollutant like dyes.5,6 It is often possible to improve the ZnO photocatalytic efficiency by metal doping. In other words, the incorporation of metal ions into the ZnO lattice can narrow the band gap, promote more photoexcited electrons to reach the conduction band, and facilitate the charge carriers mobility.7,8
However, some transition metal dopants may impair the photocatalytic performance of ZnO and in some cases, contradictory results are found in the literature for the same metal dopant such as manganese or copper.9,10 Focusing only on Mn and by way of examples, Anju Chanu, et al.,11 Baylan, et al.,12 Singh, et al.,13 have reported an evident improvement of the UV photocatalytic activity of ZnO when doped with Mn. On another side, some other researchers have pointed out an inefficient Mn doping effect on ZnO photocatalytic activity under UV illumination; Rekha et al.,9 Kaur et al.,14 and Barick et al.,15 have observed a higher photocatalytic efficiency for pure ZnO as compared to Mn-doped samples that exhibited poor activity. The authors attributed the decrease in the photocatalytic activity to transition metal ions incorporated into the ZnO matrix. These ions act as electron-hole recombination sites which lead to decreasing the number of the resulting reactive oxidant species like superoxide (O2--) and hydroxyl ('OH) radicals.
The purpose of the present work is to identify the accelerating or the inhibiting effect of the Mn doping on the UV photocatalytic activity of Zn(1-x)MnxO (x = 0, 1, 3, 5 at%) prepared via a hydrothermal process. Furthermore, photocurrent analysis and electrical conductivity measurements were conducted on pure ZnO and Zn0.97Mn0.03O to support the photocatalytic results. An explanation of the Mn doping effect was proposed; it was based on the consistency between the photocatalytic investigations and the electrical properties of the samples.
In most studies conducted on the positive or negative effect of ZnO/Mn photocatalytic activity, authors only explain the results by the increase or decrease, upon doping, of the number of the photogenerated electron-hole pairs. Generally, authors do not include other experimental investigations confirming the observed catalytic properties. In this paper, we add the complex impedance measurements and the photocurrent analysis in order to correlate the photocatalytic properties of ZnO/Mn with the electric ones. It should be noted that there are very few publications on the photocatalytic properties of doped or undoped ZnO, including measurements of electrical conductivity.
EXPERIMENTAL
Materials
Manganese chloride (MnCl2, Fluka, 99%), zinc chloride (ZnCl2, Fluka, 98%), and sodium hydroxide (NaOH, Sigma Aldrich, 98%) as well as the dispersing agent of polyvinylpyrrolidone (PVP K30, Sigma Aldrich) were used as received. Double distilled water was used as a solvent.
Hydrothermal synthesis of Zno-Mn nanostructures
ZnO nanocrystals were synthesized by a hydrothermal method according to the following synthetic protocol. NaOH (360 mg, 0.2 M), PVP K30 (1.667 g), and zinc chloride (409 mg, 0.2 M) were dissolved in 15mL of twice-distilled water and the mixture was stirred for 20 min at room temperature. Then, the obtained solution was transferred into a 20 mL Teflon-lined stainless autoclave and heated in an oven at 150 °C for 24 h. After cooling at ambient temperature, ZnO nanoparticles were collected, by centrifugation, washed several times with-water and absolute ethanol, and finally dried at 60 °C for 12 h.The same procedure was applied for the synthesis of Mn2+ doped ZnO nanocrystals (1, 3, and 5 at%) where MnCl2 was added with adjusted amounts to the starting solution.
In the rest of this paper, the notations will be shortened as follows: Zn(1-x)MnxO are denoted ZMn(x) for a particular amount of x, and the overall series Zn(1-x)MnxO are labelled as ZMn.
Characterization Techniques
The X-Ray powder Diffraction (XRD) patterns were recorded at room temperature using X'Pert MPD diffractometer using Cu-Ka-radiation (λ = 1.5418 Å). Energy dispersive X-Ray analysis (EDX) was obtained with JEOL Scanning Electron Microscope JSM-6490 LV. Transmission electron microscopy (TEM) images were taken by placing a drop of the dispersed ZMn powder in absolute ethanol onto a copper gird. The prepared samples were analysed using a Tecnai G2 TEM operating at 200 kV All the optical measurements were performed at room temperature with a Shimadzu 2600 UV-visible spectrophotometer to record the diffuse reflectance spectra in the interval 300-800 nm. Electrochemical measurements were conducted with a PGSTAT30 AUTOLAB electrochemical workstation in a conventional three-electrode cell, using a platinum wire and an Ag/AgCl electrode as counter electrode and reference electrode, respectively. Working electrodes were obtained by deposing sample suspensions (5 mg in 3 mL ethanol) onto a 1 cm2 area of an indium tin oxide-coated glass. The electrodes were next dried for 4 h at 80 °C. The photo-response was measured, under the previous UV source, in 0.1 M NaOH solution used as the supporting electrolyte at 0.0 V vs Ag/AgCl. The electrical measurements were explored via Hewlett Packard HP 4192A impedance analyser. The impedance parameters were measured in the frequency range 10 Hz-13 MHz and the temperature ranging between 373 K and 773 K in 25 °C intervals. The samples were pressed into disc-shaped pellets 12 mm in diameter and silver paint was applied to their two parallel surfaces to ensure electrical contact.
Photocatalytic Experiments
The photocatalytic experiments for the removal of MO were carried out at room temperature in a batch reactor under UV light irradiation using Actinic BL TL 8W mercury lamps emitting from 350 nm to 390 nm with a maximum of 370 nm. In a typical reaction, the ZMn(x) catalyst (50 mg) was added to 50 mL of MO aqueous solution (10 mg L-1) whose pH was adjusted to 7.0. The mixture was magnetically stirred for 50 min in the dark to achieve the adsorption/ desorption equilibrium between the dye and the photocatalyst. Next, the solution was brought to UV light radiation under continuous magnetic stirring. At regular irradiation time intervals (20 min), 2 mL of the solution was taken out and centrifuged for 3 min to remove the catalyst. The concentration of MO was determined by measuring the maximum absorbance at 464 nm using a Perkin Elmer UV/Vis spectrophotometer Lambda 11 in the range of 200-800 nm.
RESULTS AND DISCUSSION
Structural and Microstructural Analysis
X-ray Diffraction
Figure 1 illustrates the X-ray diffractograms of ZMn powders. All ZMn samples show the peaks of diffraction corresponding to a typical hexagonal wurtzite structure of ZnO (ICDD Card N° 70-8070).16
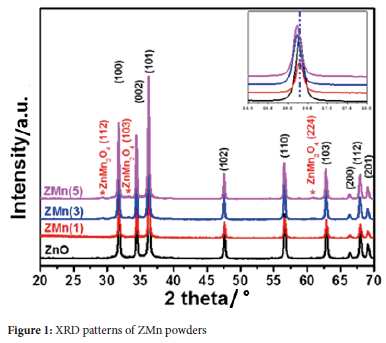
Pure ZnO, ZMn(1), and ZMn(3) samples show similar diffraction peaks without any phase impurity. When the concentration of Mn reached 5%, some very low additional peaks appear at 29 values of 29.45, 33.24, and 61.01°, which were related to the ZnMn2O4 tetragonal phase.17
The inset of Figure 1 shows a zoom on the dominant (101) diffraction peak for all ZMn samples. As one can see, the diffraction peaks of ZMn samples slightly shift to lower angles in comparison to pure ZnO. These peak shifts, mainly noticeable for ZMn(3) and ZMn(5), are in accordance with previous reports on Mn-doped ZnO,12,18 and are indicative of a minor increase in the corresponding hexagonal cell parameters because of the incorporation of Mn2+ cations into the ZnO crystal lattice. Indeed, the ionic radius of Mn2+ (0.66 Å) is slightly higher than that of the Zn2+ cations (0.60 Å).
TEM Analysis and Elemental Composition
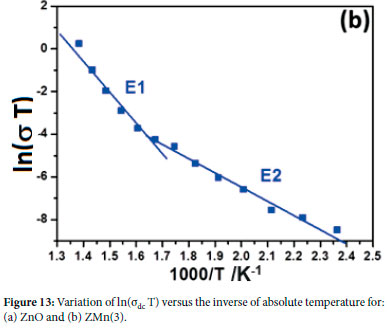
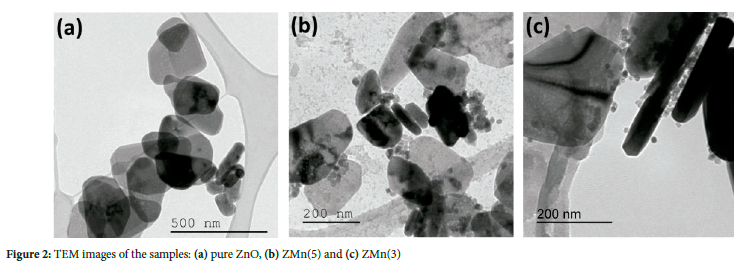
TEM analysis has been conducted to explore the morphology of the prepared samples. The Transmission Electron Microscopy (TEM) images of ZnO, ZMn(3), and ZMn(5) samples are illustrated in Figure 2. Irregular thin platelets with some rod-like shapes that vary in size and number depending on the sample's Mn content can be observed for all samples. For pure ZnO, platelets are the majority and only a few small rods can be seen; the platelets are approximately circular with diameters ranging from 180-190 nm for the smallest and from 300-350 nm for the largest (Figure 2a). For ZMn(5), the platelets are more elongated and the rods lengths vary from 140 to 200 nm with diameters in the range 60-80 nm (Figure 2b).
For ZMn(3), the rods become more pronounced with well-defined shapes and larger sizes (lengths and diameters in the range 300-400 nm and 70-90 nm, respectively) (Figure 2c). According to these results, it can be concluded that the Mn dopant, can affect the geometrical characteristics of the rods by favouring their formation along a given direction, which agrees with previous reports.19 It is finally worth noting that TEM images of ZMn(3) and ZMn(5) reveal some small spherical nanoparticles with ca. 10 nm in diameter that may likely be the primary particles that develop in the hydrothermal synthesis process.
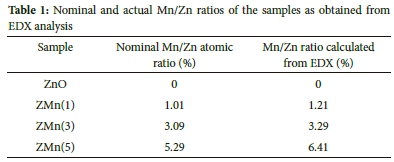
Energy dispersive X-ray spectroscopy was applied to determine the chemical compositions of ZMn powders using a JEOL Scanning Electron Microscope (JSM-6490 LV) operated at 20 kV. The surface morphology was observed under high magnification up to 15,000 times and results were obtained by averaging three values taken from different regions of a sample. Zn, O, and Mn signals are associated with the prepared nanostructures whereas Cu and C originate from the grid and the carbon film used for sample preparation (Figure S1 in supplementary information). The real and the nominal Mn/Zn ratios are displayed in Table 1; the actual Mn/Zn ratios of 1.21 and 3.29 were found to be slightly higher to the starting precursor ratios of 1.01 and 3.09 for ZMn(1) and ZMn(3), respectively. It indicates some impoverishment in zinc for these samples. However, ZMn(5) appears to be more sensitive to this zinc impoverishment which tends to increase with increasing the nominal manganese content (Table 1).
Optical Properties
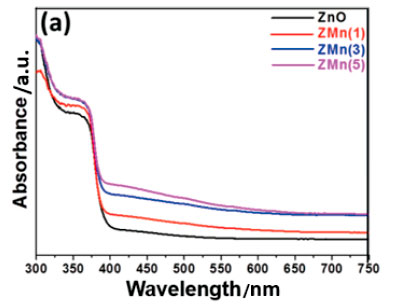
The absorbance spectra of ZMn powders were recorded in diffuse reflectance mode (Figure 3a) using a Shimadzu UV-2600/2700 series, equipped with integrating sphere. Before performing the measurement, calibration of the instrument was performed using a standard barium sulfate powder. In the range of 300-380 nm, the absorption intensity of the samples grew rapidly with the Mn content. It is worth noting the remarkable sharp absorption for all ZMn towards 376 nm that correlated to the ZnO band gap.20 In the visible region (390-750 nm), a moderate enhancement of ZMn absorption with increasing Mn content was observed. It may be due to the creation of new energy levels in the forbidden band gap further confirming the incorporation of Mn2+ in the ZnO lattice, which is in good accordance with XRD analysis.
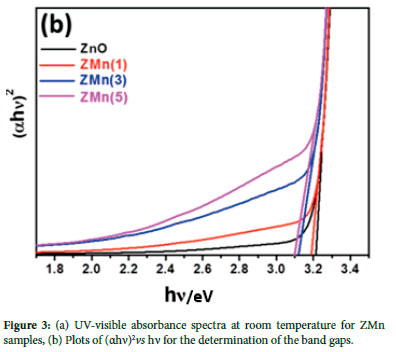
For estimating the optical band gap (Eg) of ZMn samples, the Tauc's curves were plotted using the following equation (1):

where a, h, v, and B are the absorption coefficient, the Planck constant, the photon frequency, and a constant, respectively.
The band gap values of ZMn samples were determined by plotting (ahv)2 vs hv and by extrapolating the linear part of the curves to the hv abscissa axis (Figure 3b). Pure ZnO, ZMn(1), ZMn(3), and ZMn(5) exhibit band gap energies of 3.21, 3.19, 3.12, and 3.10 eV, respectively. The Eg values are found to decrease with the Mn concentration which is in good agreement with the literature.21,22 Note that the increase of crystal defects owing to Mn doping, mainly oxygen vacancies, have been evoked in the literature to explain the band gap narrowing.20,23
Photocatalytic Study
Physico-chemical Characteristics of Methyl Orange
The photocatalytic activity of the prepared ZMn samples was tested in the photodecomposition of the anionic MO dye under a UV-light source.
The chemical structure of MO and its UV-visible absorption spectrum in an aqueous solution are given in Figure S2 in supplementary information. As can be seen, MO presents an intense band located at 464 nm attributed to the azo group -N=N- and a less intense one centred at 271 nm assigned to the aromatic ring.24
Photocatalytic Activity of ZMn Series
The photodegradation efficiency (PE) for the dye was determined according to the following equation (2):

where A0 and At are the absorbance of MO at t = 0 and at time t respectively.
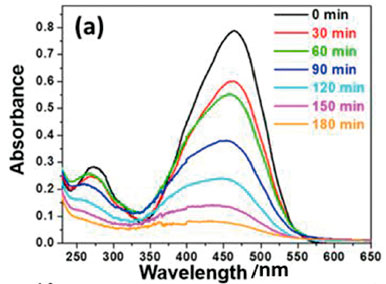
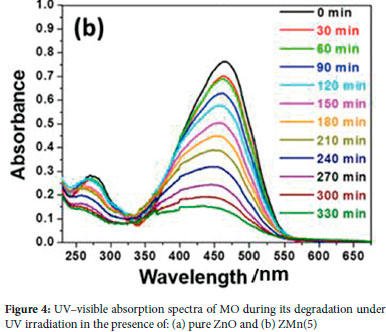
Figure 4 shows the decrease of the characteristic absorption bands of MO using the ZnO and ZMn(5) catalysts. The obtained results show that when using pure ZnO, the absorption band at 464 nm decays to almost 0.05 after 180 min of irradiation with a PE of 91% (Figure 4a), indicating an efficient decomposition of the dye. On the other hand, when ZMn(5) is used, a strong inhibition of methyl orange degradation is observed with a PE of 39% for 180 min of UV irradiation (Figure 4b).
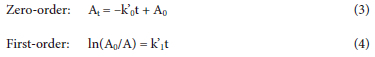
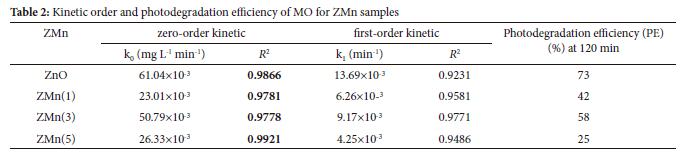
For ZMn catalysts, the photocatalytic efficiencies recorded after 120 min of irradiation were determined as 73, 42, 58, and 25% for ZnO, ZMn(1), ZMn(3), and ZMn(5), respectively. ZMn nanocrystals exhibit lower PE as compared to pure ZnO. In addition, this result can be quantitatively illustrated by determining the rate constants and the kinetic order of the photodegradation process of MO. According to the equations 3 and 4, we have analysed the validity of the zero-order and the pseudo-first-order by plotting, respectively, the measured absorbance At and ln(A0/At) versus irradiation time:
When expressed in the usual form, as a function of the concentration
C, equations (3) and (4) become, respectively:
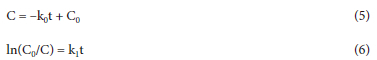
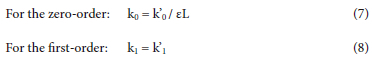
The constants k'0 and k'1 were calculated from the slopes of the linear fits and the rate constants k0 (mg L-1 min-1) and k (min-1) were easily determined, using the Beer-Lambert's formula (A = ε.C.L), as follows:
The obtained values of k0, k and the corresponding squared correlation coefficients R2 are summarized in Table 2. The highest linear correlation factors R2, varying from 0.9778 to 0.9921, correlate with the pre-eminent linear fit related to pseudo-zero-order best described the reaction kinetic.25-27
Figure 5 shows the linear fits corresponding to zero-order for ZnO, ZMn(1), ZMn(3), and ZMn(5) catalysts.
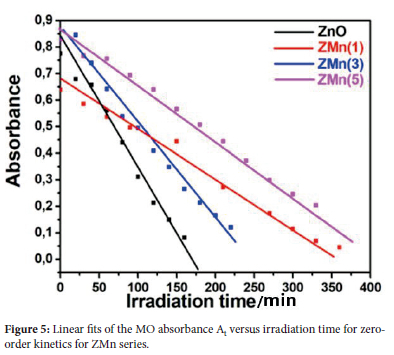
The obtained values of the rate k confirm that pure ZnO presented the highest rate constant k0 of 61.04x10⁻³ mg L-1 min-1 and all the Mn-doped photocatalysts exhibited lower rate constants indicating an inhibitor behaviour (Table 2).
Among doped samples, ZMn(5) presented the lowest rate constant whereas ZMn(3) exhibited the highest one of 50.79 x 10⁻³ mg L-1 min-1. Furthermore, the disparity between the photocatalytic activity of ZnO and ZMn(3) was also evaluated using a cationic organic dye, methylene blue (MB) in an aqueous solution at 10 mg L-1.
The chemical structure and the UV-visible absorption spectrum in the aqueous solution of MB are shown in Figure S3 in supplementary information. The photodegradation of MB was conducted under identical experimental conditions as MO. The variation of the MB concentration ratio C/C0as a function of irradiation time for ZnO and ZMn(3) is shown in Figure 6.
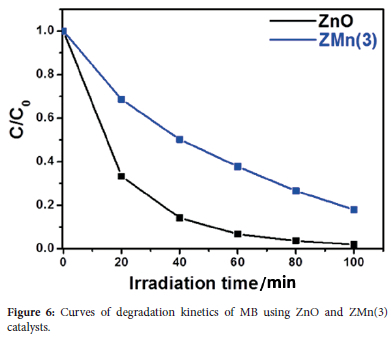
The results show that the MB degradation decreased for ZMn(3) as compared to pure ZnO which presented a higher PE of 98% after 100 min of UV illumination.
The decrease in the photocatalytic performance of Mn-doped ZnO was not surprising, as previously observed by other researchers.14,15,28 Indeed, the photogenerated electrons (e-) and holes (h+) are implicated in the formation of the reactive oxidizing species O2'- and 'OH, according to the following equations:
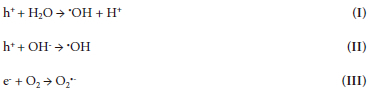
The involvement of O2" and 'OH species in photodegrading the dye was investigated using the MO dye and the ZMn(3) catalyst in the presence of tert-butanol (t-BuOH) or benzoquinone (BQ) respectively scavengers of 'OH and O2". Figure 7 shows that the MO photodegradation was strongly inhibited when adding either BQ (10-3 M) or t-BuOH (40 ml/L).
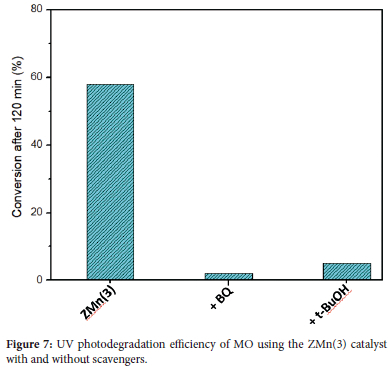
The Mn2+ cations create profound traps that act as recombination sites for the photogenerated electrons and holes and thus reduced the number of the resulting oxidizing radicals (O2'- and 'OH), involved in the dye degradation.28,29 This result can be supported by conducting photocurrent measurements for both samples (ZnO and ZMn(3)).
Photocurrent Measurements
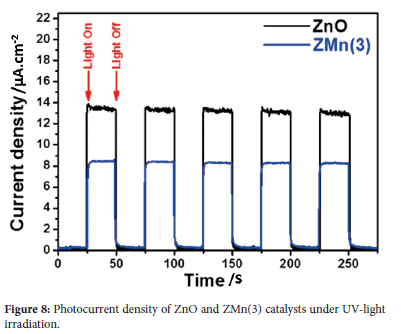
Figure 8 shows the measured photocurrent, recorded at room temperature by repeatedly switching on and offthe UV-light irradiation for both samples. Note that without irradiation, the photocurrent was very weak, whereas a reversible and stable photocurrent was obtained under UV-light irradiation. Compared to ZMn(3), the ZnO catalyst exhibits a ca. 1.58 fold higher photocurrent, suggesting that the charge separation is much more efficient in the ZnO sample than in ZMn(3). The reduction in the photocatalytic activity for ZMn(3) is related to the reduced number of the photogenerated electron-hole pairs which are involved in the photodegradation mechanism of the organic dye.
Electrical Properties
Electrical measurements have been performed to investigate the role of transition metal (Mn2+) ion doping in large band gap ZnO semiconductor nanocrystals. The sample ZMn(3) was chosen because it exhibits the most efficient photocatalytic activity among the doped ZMn nanostructures.
Impedance Analyses
Figure 9 (a and b) show complex plots of the imaginary component of impedance, Z", versus its real component Z' at different selected temperatures for ZnO and ZMn(3). As can be seen, simple semicircles were obtained, which may reveal the homogeneity and purity of both samples.30 Such behaviour of one arc formation means that conduction in the grain and the grain boundary cannot be separated, it takes place in the same process.31,32
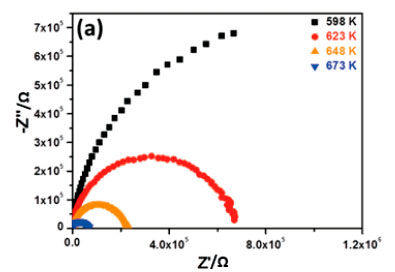
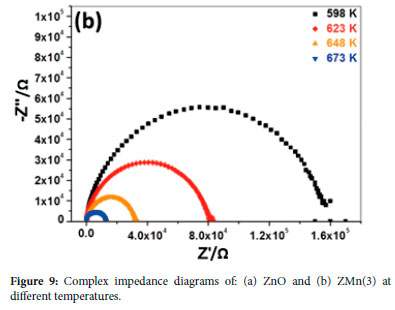
The resistance (R) values were determined at the intersection point of the extrapolated semicircles with the real axis. The results show that the resistances decrease with the increasing temperature which was consistent with a semiconducting behaviour, and which showed an activated mechanism of the conduction.33,34 It was observed that the resistance of ZMn(3) decreased more rapidly than that of ZnO in the temperature range of 598-673 K (Figure 9a and 9b).
Figure 10 (a and b) shows the real part of the impedance (Z') change with frequency at various temperatures for ZnO and ZMn(3).
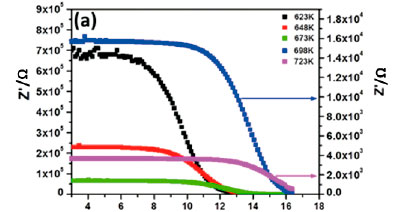
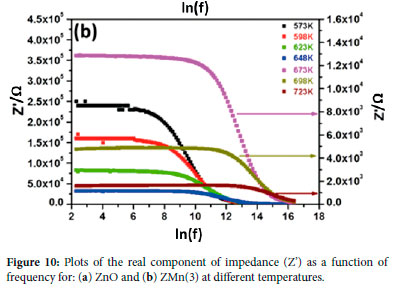
The curves of both samples display the same aspect. Indeed, in the lower frequency domain, Z' values were typically high at low temperatures and gradually decreased with increasing temperature which is followed by the rise in conductivity.35
In the higher-frequency range, the real parts Z' were merging regardless of the temperature, which suggested a possible release of space charge at higher temperatures' domain.36,37
The variation of the imaginary component Z" of impedance, as a function of frequency at selected temperatures for ZnO and ZMn(3), is displayed in Figure 11a and 11b, respectively.
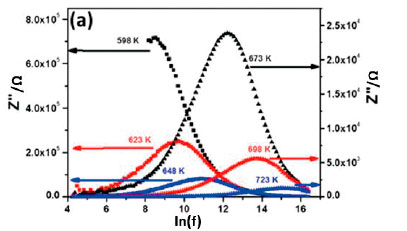
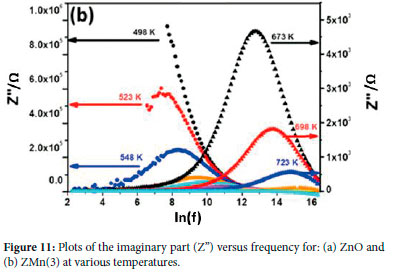
For a given temperature, Z" grew continuously with the increase of frequency till a maximum and next gradually decreased to form one peak. With the rise of temperature, the peak magnitude (Z"max) decreased and its maximum position (fmax) shifted towards higher frequency region. The occurrence of these peaks and the changes in their amplitude and position with temperature indicated a thermally activated relaxation phenomenon for both samples.38,39
Note that the appearance of peaks began to take place at a relatively lower temperature for ZMn(3) (523 K) but at a higher temperature for pure ZnO (598 K). It means that the relaxation process needed more thermal energy for undoped ZnO to occur as compared to ZMn(3).
Electrical Conductivity σdc
Undoped ZnO exhibits n-type conductivity because of its native point defects. Zinc interstitials (Zni) and oxygen vacancies (VO) are the main native defects that have been invoked as donors in ZnO.40,41 However, first-principle calculations, supported by optically detected electron paramagnetic resonance analyses on ZnO crystals of good quality, showed that Zni and VO cannot be the origins of the n-type conductivity in ZnO.42-44 The origin would be the unintended incorporation of impurities that operate as shallow donors, mainly the hydrogen, because most environments of synthesis and processing contain hydrogen.45,46 The dopants such as transition metals, intentionally injected in the ZnO lattice, can also act as shallow donors because they create energy levels close to the material-permitted energy bands and are, therefore, easily ionized.47,48
The electrical dc conductivity values σdc were calculated using the following relation:

where R is the resistance, and e and S denote the thickness and the surface area of the pellets respectively.
Figure 12 illustrates the change of σdc in the temperature domain 423-723 K for ZnO and ZMn(3). For both samples, σdc is relatively low and moderately increased between 423 and 600 K, as the number and mobility of charge carriers, were weak at this temperature region.49 Next, σdc increased rapidly in the range from 650 to 723 K, due to the rise of the charge carriers' number and mobility in that domain where oxygen vacancies and zinc interstitials are the most defects that act as donors.50
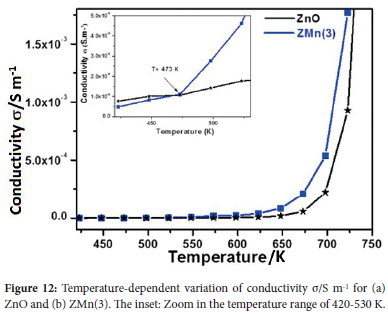
As can be seen from Figure 12, the ZMn(3) presented greater conductivities than ZnO in the high-temperature region; the sdc differences became wider with the rise of temperature. Similar behaviour of Mn-doped ZnO has been reported by Bouchoucha et al., when studying the variations of electrical conductivities adc of ZnO and ZnO: Mn(5%) in the range 498-773 K.51 Moreover, Choudhury et al. have investigated the conductivity σdc of Zn1-xMnxO (x = 0, 2, 5, 7, 10%), the measured σdc at 523 K increased from 1.74 x 10⁻⁴ to 2.50 x 10⁻³ Ω-1 m-1 with the increase of the Mn content.52
Zooming in the 423-520 K range, as illustrated in the inset of Figure 12, offers a better observation of the two curves' relative position. With the decreasing temperature, the conductivities of ZMn(3) get closer and closer to those of ZnO, and then ZMn(3)'s curve passed below that of ZnO for T < 473 K where ZMn(3) became less conductive than pure ZnO. This decrease in conductivity of ZMn(3) relative to ZnO, is in good conformity with previous works on the electrical conductivity performed at low temperatures and especially at ambient conditions (300 K). Belkhaoui et al. have reported electrical measurements at room temperature of ZnO: Mn (0, 1, 2, 3%) nanostructures prepared using a co-precipitation route. The sample resistances were found to increase with the Mn content and pure ZnO exhibited the greatest conductivity.53 Motevalizadeh et al. have reported that the resistivity at 300 K of pure ZnO thin film was less than those measured for all the Mn-doped films (5, 10, 15%) at the same temperature, indicating that undoped ZnO film was the most conductive sample.54
The activation energies (E) for conduction were determined considering a thermally activated process of Arrhenius type:

where S0 is the pre-logarithmic term and k is the Boltzmann constant.
Figure 13a and 13b illustrate the variation of ln(σdcT) vs inverse of absolute temperature 1000/T for ZnO and ZMn(3). For each sample, two almost linear portions, depending on different temperature ranges, were obtained.55,56 The activation energies E1 and E2 were calculated from the slopes of the linear parts and are related to the high (600-723 K) and the low-temperature region (423-600 K), respectively.
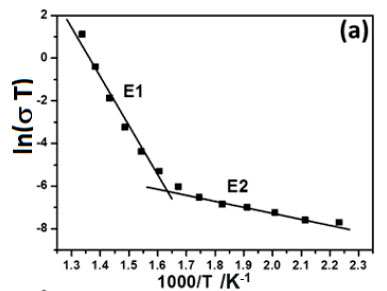
The obtained values of E1 and E2 for ZnO were 2.07 eV and 0.24 eV respectively; the activation energies in the case of ZMn(3) were E1 = 1.33 eV and E2 = 0.55 eV. For both samples, two distinct E1 and E2 values were obtained, suggesting two dominant conduction mechanisms.
Note that E1 was superior to E2 for each sample, indicating different donor levels located in the band gap of the semiconductor. The high activation energy E1 is related to a deep donor level, whereas the low one E2 corresponds to a shallow donor level.50 ZnO presented a high energy E1 of 2.07 eV which was superior to that of ZMn(3) (1.33 eV), while its low energy E2 (0.24 eV) was inferior to that of ZMn(3) (0.55 eV) which was consistent with the compared conductivity variations of the samples in the low and in the high-temperature ranges as previously discussed.
Focusing on the low temperatures domain, the decrease in conductivity of ZMn(3) (E2 = 0.55 eV) compared to ZnO (E2 = 0.24 eV) is a consequence of the increase of the energy barrier of ZMn(3), owing to Mn incorporation into the ZnO matrix. According to a previous study performed at room temperature, the decrease in conductivity of Mn-doped ZnO compared to ZnO was due to Mn that may act as a deep donor in ZnO and made the grain boundary and also the grain more resistive.32 This increase in ZMn(3) resistance in comparison with ZnO, at room temperature, helped to explain its lower photocatalytic activity. Indeed, the increase of the resistance led to a slowing down of the electrons and thus will affect the migration of the electrons and will reduce their number in perfect accordance with the photocurrent measurements.57
CONCLUSION
Mn-doped zinc oxide Zn(1-x)MnxO (x = 0, 1, 3, and 5%) nanocrystals were successfully prepared using a soft hydrothermal route. ZMn nanostructures absorbed more photons than pure ZnO in the UV and visible regions and their corresponding band gap decreased with the Mn content. Compared to pure ZnO, all ZMn nanocrystals exhibited lower photocatalytic activity showing an inhibiting effect after Mn doping. The photocurrent analyses and the electrical conductivity measurements were consistent with ZMn photocatalytic properties. The Mn doping may increase the crystal defects, creates new energy levels that act as recombination centres, and make the grain and the grain boundary more resistive.
This work is a contribution to the studies on the influence of Mn doping on the photocatalytic and physicochemical properties of ZnO, it deserves to be generalized to other transition metals with a similar electronic structure such as copper, nickel, or cobalt. The mechanism of the inhibiting or accelerating effect of transition metals doping on the photocatalytic activity of ZnO is still misunderstood and requires further experimental and theoretical investigations.
ACKNOWLEDGMENTS
The authors are very grateful to Professor Mouldi Zouaoui (Laboratoire de Physique des Matériaux, Faculté des Sciences de Bizerte, 7021 Jarzouna, Tunisie) for his help in acquiring TEM images.
SUPPLEMENTARY MATERIAL
Supplementary information for this article is provided in the online supplement.
ORCID IDS
Zaineb Hammami: https://orcid.org/0000-0001-9666-8571
Bilel Chouchene: https://orcid.org/0000-0003-3379-4153
Abdelhak Othmani: https://orcid.org/0000-0002-8186-4411
Tahar Ben Chaabane: https://orcid.org/0000-0002-0402-0450
Raphaël Schneider: https://orcid.org/0000-0002-6870-6902
REFERENCES
1. Natheer BM, Farqad RS, Kadhim RG, Um-Salama M. Synthesis, and characterization of zinc oxide nanoparticles via oxalate co-precipitation method. Mater. Lett. X 2022;13:100126. https://doi.org/10.1016/j.mlblux.2022.100126. [ Links ]
2. Hasnidawani JN, Azlina HN, Norita H, Bonnia NN, Ratim S, Ali ES. Synthesis of ZnO nanostructures using sol-gel method. Procedia Chem. 2016;19:211-216. https://doi.org/10.1016/j.proche.2016.03.095. [ Links ]
3. Wang M, Li AD, Kong J-Z, Gong Y-P, Zhao C, Tang Y-F, Wu D. Fabrication and characterization of ZnO nano-clips by the polyol-mediated process. Nanoscale Res. Lett. 2018;13:47. https://doi.org/10.1186/s11671-018-2458-9. [ Links ]
4. Zhou X, Liao L, Tian C. A novel route to ZnO nanorods with small diameters of 20 nm. Mater. Res. Bull. 2013;48(11):4769-4774. https://doi.org/10.1016/j.materresbull.2013.08.036. [ Links ]
5. Khalafi T, Buazar F, Ghanemi K. Phycosynthesis and enhanced photocatalytic activity of zinc oxide nanoparticles toward organosulfur pollutants. Sci. Rep. 2019;9:6866. https://doi.org/10.1038/s41598-019-43368-3. [ Links ]
6. Chouchene B, Ben Chaabane T, Balan L, Girot E, Mozet K, Medjahdi G, Schneider R. High-performance Ce-doped ZnO nanorods for sunlight-driven photocatalysis. Beilstein J. Nanotechnol. 2016;7:1338-1349. https://doi.org/10.3762/bjnano.7.125. [ Links ]
7. Pascariu P, Tudose IV, Suchea M, Koudoumas E, Fifere N, Airinei A. Preparation and characterization of Ni, Co-doped ZnO nanoparticles for photocatalytic applications. Appl. Surf. Sci. 2018;448:481-488. https://doi.org/10.1016/j.apsusc.2018.04.124. [ Links ]
8. Mittal M, Sharma M, Pandey OP. Fast and quick degradation properties of doped and capped ZnO nanoparticles under UV-Visible light radiations. Solar Energy. 2016;125:51-64. https://doi.org/10.1016/j.solener.2015.12.003. [ Links ]
9. Rekha K, Nirmala M, Nair MG, Anukaliani A, Structural, optical, photocatalytic and antibacterial activity of zinc oxide and manganese doped zinc oxide nanoparticles. Phys. B: Condens. Matter. 2010;405(15):3180-3185. https://doi.org/10.1016/j.physb.2010.04.042. [ Links ]
10. Gaurav A, Beura R, Kumar JS, Thangadurai P. Study on the effect ofcopper ion doping in zinc oxide nanomaterials for photocatalytic applications. Mater. Chem. Phys. 2019;230:162-171. https://doi.org/10.1016/j.matchemphys.2019.03.056. [ Links ]
11. Chanu LA, Singh WJ, Singh KJ, Devi KN. Effect of operational parameters on the photocatalytic degradation of Methylene blue dye solution using manganese doped ZnO nanoparticles. Results in Phys. 2019;12:1230-1237. https://doi.org/10.1016/j.rinp.2018.12.089. [ Links ]
12. Baylan E, Yildirim OA. Highly efficient photocatalytic activity of stable manganese-doped zinc oxide (Mn:ZnO) nanofibers via electrospinning method. Mater. Sci. Semicond. Proc. 2019;103:104621. https://doi.org/10.1016/j.mssp.2019.104621. [ Links ]
13. Singh J, Rathi A, Rawat M, Kumar V, Kim K-H. The effect of manganese doping on structural, optical, and photocatalytic activity of zinc oxide nanoparticles. Compos. Part B: Engineer. 2019;166:361-370. https://doi.org/10.1016/j.compositesb.2018.12.006. [ Links ]
14. Kaur J, Singhal S. Facile synthesis of ZnO and transition metal doped ZnO nanoparticles for the photocatalytic degradation of Methyl Orange. Ceram. Int. 2014;40(5):7417-7424. https://doi.org/10.1016/j.ceramint.2013.12.088. [ Links ]
15. Barick KC, Singh S, Aslam M, Bahadur D. Porosity and photocatalytic studies of transition metal doped ZnO nanoclusters. Micropor. Mesopor. Mater. 2010;134(1-3):195-202. https://doi.org/10.1016/j.micromeso.2010.05.026. [ Links ]
16. Kaftelen H, Ocakoglu K, Thomann R, Tu S, Weber S, Erdem E. EPR and photoluminescence spectroscopy studies on the defect structure of ZnO nanocrystals. Phys. Rev. B, 2012;86:014113. https://doi.org/10.1103/PhysRevB.86.014113. [ Links ]
17. Nassar MY, El-Moety EA, El-Shahat MF. Synthesis and characterization of a ZnMn2O4 nanostructure as a chemical nanosensor: a facile and new approach for colorimetric determination of omeprazole and lansoprazole drugs. RSC Adv. 2017;7:43798-43811. https://doi.org/10.1039/C7RA08010G. [ Links ]
18. Panigrahy B, Aslam M, Bahadur D. Aqueous Synthesis of Mn- and Co-Doped ZnO Nanorods. J. Phys. Chem. C. 2010;114(27):11758-11763. https://doi.org/10.1021/jp102163b. [ Links ]
19. Ma Q, Lv X, Wang Y, Chen J. Optical and photocatalytic properties of Mn-doped flower-like ZnO hierarchical structures. Opt. Mater. 2016;60:86-93. https://doi.org/10.1016/j.optmat.2016.07.014. [ Links ]
20. Putri NA, Fauzia V, Iwan S, Roza L, Umar AA, Budi S. Mn-doping-induced photocatalytic activity enhancement of ZnO nanorods prepared on glass substrates. Appl. Surf. Sci. 2018;439:285-297. https://doi.org/10.1016/j.apsusc.2017.12.246. [ Links ]
21. Chen L-C, Tien C-H, Fu C-S. Magneto-optical characteristics of Mn-doped ZnO films deposited by ultrasonic spray pyrolysis. Mater. Sci. Semicond. Proc. 2012;15(1):80-85. https://doi.org/10.1016/j.mssp.2011.04.003. [ Links ]
22. Khan MAM, Kumar S, Alhazaa AN, Al-Gawati MA. Modifications in structural, morphological, optical and photocatalytic properties of ZnO: Mn nanoparticles by sol-gel protocol. Mater. Sci. Semicond. Proc. 2018;87:134-141. https://doi.org/10.1016/j.mssp.2018.07.016. [ Links ]
23. Ullah R, Dutta J. Photocatalytic degradation of organic dyes with manganese-doped ZnO nanoparticles. J. Hazard. Mater. 2008;156(1-3):194-200. https://doi.org/10.1016/j.jhazmat.2007.12.033. [ Links ]
24. Panda N, Sahoo H, Mohapatra S. Decolourization of Methyl Orange using Fenton-like mesoporous Fe2O3-SiO2 composite. J. Hazard. Mater. 2011;185(1):359-365. https://doi.org/10.1016/j.jhazmat.2010.09.042. [ Links ]
25. Khezrianjoo S, Lee J, Kim K-H, Kumar V. Eco-toxicological and kinetic evaluation of TiO2 and ZnO nanophotocatalysts in degradation of organic Dye. Catalysts. 2019;9(10):871. https://doi.org/10.3390/catal9100871. [ Links ]
26. Gaya UI, Abdullah AH, Zainal Z, Hussein MZ. Photocatalytic treatment of 4-chlorophenol in aqueous ZnO suspensions: Intermediates, influence of dosage and inorganic anions. J. Hazard. Mater. 2009;168(1):57-63. https://doi.org/10.1016/j.jhazmat.2009.01.130. [ Links ]
27. Iliev V, Tomova D, Bilyarska L, Eliyas A, Petrov L. Photocatalytic properties of TiO2 modified with platinum and silver nanoparticles in the degradation of oxalic acid in aqueous solution. Appl. Catal. B: Environ. 2006;63(3-4):266-271. https://doi.org/10.1016/j.apcatb.2005.10.014. [ Links ]
28. Türkyilmaz SS, Güy N, Özacar M. Photocatalytic efficiencies of Ni, Mn, Fe and Ag-doped ZnO nanostructures synthesized by hydrothermal method: The synergistic/antagonistic effect between ZnO and metals. J. Photochem. Photobiol. A: Chem. 2017;341:39-50. https://doi.org/10.1016/j.jphotochem.2017.03.027. [ Links ]
29. Dodd A, McKinley A, Tsuzuki T, Saunders M. Tailoring the photocatalytic activity of nanoparticulate zinc oxide by transition metal oxide doping. Mater. Chem. Phys. 2009;114(1):382-386. https://doi.org/10.1016/j.matchemphys.2008.09.041. [ Links ]
30. Belkhaoui C, Lefi R, Mzabi N, Smaoui H. Synthesis, optical and electrical properties of Mn-doped ZnO nanoparticles. J. Mater. Sci: Mater. Electron. 2018;29:7020-7031. https://doi.org/10.1007/s10854-018-8689-9. [ Links ]
31. Zhou Z, Kato K, Komaki T, Yoshino M, Yukawa H, Morinaga M, Morita K. Effects of dopants and hydrogen on the electrical conductivity of ZnO. J. Europ. Ceram. Soc. 2004;24(1):139-146. https://doi.org/10.1016/S0955-2219(03)00336-4. [ Links ]
32. Jose J, Khadar MA. Impedance spectroscopic analysis of AC response of nanophase ZnO and ZnO-Al2O3 nanocomposites. Nanostruct. Mater. 1999;11(8):1091-1099. https://doi.org/10.1016/S0965-9773(99)00399-2. [ Links ]
33. Dhara A, Sain S, Das S, Pradhan SK. Microstructure, optical, dielectric and electrical characterizations of Mn-doped ZnO nanocrystals synthesized by mechanical alloying. Ceram. Int. 2018;44(6):7110-7121. https://doi.org/10.1016/j.ceramint.2018.01.151. [ Links ]
34. Yacoubi A, Chaabane TB. Annealing effect on structural, microstructural and electrical properties of ZnS nanoparticles synthesized in aqueous medium. J. Tun. Chem. Soc. 2016;18:31-37. [ Links ]
35. Thangavel R, Sabarinathan V, Ramasamy S, Kumar J. Investigations on the growth of Zinc Oxide crystals from molten hydrous KOH solution and on the impedance analysis of Zinc Oxide crystals. Mater. Lett. 2007;61(19-20):4090-4093. https://doi.org/10.1016/j.matlet.2007.01.025. [ Links ]
36. Benali A, Bejar M, Dhahri E, Graça MFP, Costa LC. Electrical conductivity and ac dielectric properties of La0.8Ca0.2-xPbxFeO3 (x = 0.05, 0.10 and 0.15) perovskite compounds. J. Alloys Compd. 2015.653:506-512. https://doi.org/10.1016/j.jallcom.2015.09.018. [ Links ]
37. Bharti C, Sinha TP. Structural and ac electrical properties of a newly synthesized single phase rare earth double perovskite oxide: Ba2CeNbO6. Phys. B: Condens. Matter. 2011;406(9):1827-1832. https://doi.org/10.1016/j.physb.2011.02.038. [ Links ]
38. Behera B, Nayak P, Choudhary RNP. Impedance spectroscopy study of NaBa2V5O15 ceramic. J. Alloys Compd. 2007;436(1-2):226-232. https://doi.org/10.1016/j.jallcom.2006.07.028. [ Links ]
39. Siddique MN, Ahmed A, Tripathi P. Electric transport and enhanced dielectric permittivity in pure and Al-doped NiO nanostructures. J. Alloys Compd. 2018;735:516-529. https://doi.org/10.1016/j.jallcom.2017.11.114. [ Links ]
40. Harrison SE. Conductivity and hall effect of ZnO at low temperatures. Phys. Rev. 1954;93:52-62. https://doi.org/10.1103/PhysRev.93.52. [ Links ]
41. Shimizu H, Sato W. Interactions of intrinsic defects formed in ZnO and their contribution to electric conductivity. J. Appl. Phys. 2019;126:125704. https://doi.org/10.1063/1.5120887. [ Links ]
42. Janotti A, Van de Walle CG. New insights into the role of native point defects in ZnO. J. Cryst. Growth. 2006;287(1):58-65. https://doi.org/10.1016/j.jcrysgro.2005.10.043. [ Links ]
43. Vlasenko LS, Watkins GD. Optical detection of electron paramagnetic resonance for intrinsic defects produced in ZnO by 2.5-MeV electron irradiation in situ at 4.2 K. Phys. Rev. B. 2005;72:035203. https://doi.org/10.1103/PhysRevB.72.035203. [ Links ]
44. Janotti A, Van de Walle CG. Native point defects in ZnO. Phys. Rev. B. 2007;76:165202. https://doi.org/10.1103/PhysRevB.76.165202. [ Links ]
45. Matsumura M. Experimental study on shallow and deep dopant properties at the interface of PtOx/ZnO Schottky diodes. Jpn. J. Appl. Phys. 2022;61:SD1031. [ Links ]
46. Janotti A, Van de Walle CG. Fundamentals of zinc oxide as a semiconductor. Rep. Prog. Phys. 2009;72:126501. https://doi.org/10.1088/0034-4885/72/12/126501. [ Links ]
47. Omar K, Ooi MDJ, Hassin MM. Investigation on dielectric constant of zinc oxide. Mod. Appl. Sci. 2009;3(2):110-116. https://doi.org/10.5539/mas.v3n2p110. [ Links ]
48. Tabib A, Sdiri N, Elhouichet H, Férid M. Investigations on electrical conductivity and dielectric properties of Na-doped ZnO synthesized from sol-gel method. J. Alloys Compd. 2015;622:687-694. https://doi.org/10.1016/j.jallcom.2014.10.092. [ Links ]
49. Hassanien AS, Akl AA. Electrical transport properties and Mott's parameters of chalcogenide cadmium sulphoselenide bulk glasses. J. Non-Cryst. Solids. 2016;432(Part B):471-479. https://doi.org/10.1016/j.jnoncrysol.2015.11.007. [ Links ]
50. Ziegler E, Heinrich A, Oppermann H, Stöver G. Electrical properties and non-stoichiometry in ZnO single crystals. Phys. Stat. Sol. (a). 1981;66(2):635-648. https://doi.org/10.1002/pssa.2210660228. [ Links ]
51. Bouchoucha I, Salem MB, Othmani A, Zouaoui M. Effect on the structural, optical and electrical properties of Mn-doped ZnO nanobelts synthesized via the hydrothermal method. Mod. Phys. Lett. B. 2020;34(16):2050177. https://doi.org/10.1142/S0217984920501778. [ Links ]
52. Choudhury S, Sain S, Mandal MK, Pradhan SK, Meikap AK. Investigation of dielectric and electrical behaviour of nanocrystalline Zn1-xMnxO (x=0 to 0.10) semiconductors synthesized by mechanical alloying. Physica E: Low-Dimens. Syst. Nanostruct. 2016;81:122-130. https://doi.org/10.1016/j.physe.2016.02.049. [ Links ]
53. Belkhaoui C, Mzabi N, Smaoui H. Investigations on structural, optical and dielectric properties of Mn-doped ZnO nanoparticles synthesized by co-precipitation method. Mater. Res. Bull. 2019;111:70-79. https://doi.org/10.1016/j.materresbull.2018.11.006. [ Links ]
54. Motevalizadeh L, Shohany BG, Abrishami ME. Effects of Mn-doping on electrical properties of ZnO thin films. Mod. Phys. Lett. B. 2016;30(04):1650024. https://doi.org/10.1142/S021798491650024X. [ Links ]
55. Hassen AB, Rhouma FIH, Daoudi M, Dhahri J, Zaidi M, Abdelmoula N. Influence of defect on the electrical and optical properties of A-site non-stoichiometry Ca067Laa22D011Ti(1_x)CrxO3_δ perovskite. RSC Adv. 2019;9:19285-19296. https://doi.org/10.1039/C9RA02815C. [ Links ]
56. De Godoy MPF, Gratens X, Chitta VA, Mesquita A, De Lima MM, Cantarero A, Rahman G, Morbec JM, De Carvalho HB. Defect induced room temperature ferromagnetism in high quality Co-doped ZnO bulk samples. J. Alloys Compd. 2021;859:157772. https://doi.org/10.1016/j.jallcom.2020.157772. [ Links ]
57. Maity R, Dutta A, Halder S, Shannigrahi S, Mandal K, Sinha TP. Enhanced photocatalytic activity, transport properties and electronic structure of Mn-doped GdFeO3 synthesized using the sol-gel process. Phys. Chem. Chem. Phys. 2021;23:16060-16076. https://doi.org/10.1039/D1CP00621E. [ Links ]
Received 9 November 2022
Revised 3 August 2023
Accepted 5 December 2023
* To whom correspondence should be addressed Email: taharbch@yahoo.com

