


Serviços Personalizados
Artigo
 Inglês (pdf)
 Artigo em XML
 Referências do artigo
Indicadores

Links relacionados
-
 Citado por Google
 -
 Similares em Google
Compartilhar

 Permalink
South African Journal of Chemistry
versão On-line ISSN 1996-840X
versão impressa ISSN 0379-4350
S.Afr.j.chem. (Online) vol.77 Durban 2023
http://dx.doi.org/10.17159/0379-4350/2023/v77a17
RESEARCH ARTICLE
A novel chromogenic agent for colorimetric estimation of copper in water and pharmaceutical tablets
Safwan M. Fraihat*
Department of Chemistry, School of Science, The University of Jordan, Amman-Jordan
ABSTRACT
The current study intends to develop a novel, simple and selective colorimetric method to identify the presence of copper on the basis of a newly-synthesized Schiff base prepared from the condensation of 1,3-phthalaldehyde with 2-aminophenol. The new chromogenic agent was studied using elemental analysis, IR, NMR, MS, and UV-VIS absorption. The new chelate produces a stable colored complex with Cu(II) ions with a 1:1 composition using the continuous variation method. The colored complex exhibited a strong absorption peak at 440 nm and this phenomenon empowers copper analysis to be conducted in natural water, and pharmaceutical solutions directly via the colorimetric method. The author analyzed and optimized all the factors that tend to influence the sensitivity of the method. Such factors include pH, time, the concentration of the ligand and temperature. The process, proposed in the study, was then evaluated in terms of precision, accuracy and selectivity. The study outcomes are as follows: linear dynamic range 0.8-22 ug mL-1; limit of quantitation 0.970 ug mL-1; and limit of detection 0.293 ug mL-1.
Keywords: copper, pharmaceutical, Schiff base, spectrophotometry, water
INTRODUCTION
Schiff bases are stable condensation derivative compounds between carbonyl-containing compounds like aldehydes and ketones and primary amino compounds forming an imine group is characterized by its stability and tendency to develop as complexes in association with various types of metal ions and exhibit biological activities.1-5 Schiff base metal complexes have many applications in catalysis 6 and the removal of toxic metals.7
Copper (Cu) plays a crucial role in most biological processes in human beings, for instance, nerve function, synthesis of hemoglobin, and bone structure.8 However, an elevated amount of copper untaken into a human being may result in severe health issues such as anemia and heart complications.9 Consequently, the monitoring of copper in different samples, especially water and pharmaceutical samples, is essential to achieve a healthy life for humans. This scenario mandates the development of a novel, efficient and simple method to determine the copper level in the solution under study. Various analytical methods have been proposed and validated in the literature to quantify the copper in multiple environmental samples, including AAS, ICP-OES, ICP-MS,10 AAS coupled with Extractive 11 and Electrochemical methods.12,13 Most of these methods are costly and in most cases, require pre-concentration steps to improve selectivity and sensitivity. Spectrophotometric methods are alternative cost-effective and simple methods. Many colorimetric methods were used to determine the quantity of Cu available in natural water and biological and pharmaceutical samples by using different chelates such as BTAS, 2,4-dinitro APTPT, DDT and Salophen.14-20
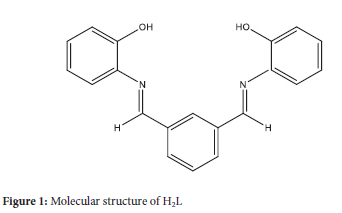
However, most of the developed methods used have some problems, such as a narrow pH range, the need for heating steps, the effect of interference from common ions, and the time of color development. So, there exists a mandate for the development of a simple method that is highly sensitive and works in a wide range ofpH and concentration. Further, the method shouldn't involve any heating or separation steps. Therefore, the current study deals with preparing a new chromogenic reagent with a molecular structure suggested in Figure 1. This compound was synthesized and characterized for its spectroscopic properties. The new compound forms an intensely colored complex with copper (II) ions in aqueous solutions. It is also utilized in the development of a convenient analytical method to quantify the level of Cu in water and the rest of the pharmaceutical samples. The proposed method was validated and tested for Cu(II) assay in water and tablet samples successfully.
MATERIALS AND METHODS
Instruments and apparatus
The pH meter (model 8521, Hanna, NY, USA) was used in this study to record the pH measurements. The author used CARY 100 BIO UV-VIS spectrophotometer (CA, USA) with 1-cm glass cells to arrive at the absorption outcomes. KBr disc was utilized to measure the Infrared (IR) spectra; Shimadzu IR Affinity FTIR spectrophotometer (Tokyo, Japan). The NMR, spectra of two components i.e., 1H and 13C NMR were determined with the help of (Model Avance DPX-500 spectrometer, Bruker, USA). Further, HRMS (High-Resolution Mass Spectra) was acquired using a Mass Spectrometer (Model APEX-IV, Bruker, USA), while the chemical shifts are portrayed in terms of (ppm).
Reagents and solutions
The author used analytical-grade chemicals with high purity. Isopthalaldehyde and 2-aminophenol were purchased from (Sigma, MO, USA), dihydrated copper chloride was obtained from (Across, Belgium), Absolute Ethanol and Acetonitrile used were from (BDH, London, UK).
A solution of the chelate (H2L) 200 |ig mL-1 was prepared using Acetonitrile., a stock solution of 500 |ig mL-1 CuCl2, then several dilutions were prepared in double distilled water as required.
A Buffer solution (Acetic acid/sodium acetate) of 0.1 M was prepared, and pH values were adjusted as needed.
Synthesis of ligand
Synthesis of ligand (H2L): The hot 1,3-phthalaldehyde (10 mmol) 50 mL of ethanol solution, was added gradually to 2-aminophenol (20 mmoL) in 50 mL ethanol. The blended mixture was left undisturbed under reflex for about four hours. Then, the solvent was allowed to evaporate until the separation of a yellow precipitate. Then, the solid produced was filtered, dried and made to undergo crystallization again with the help of ethanol. The resultant yellow product has a percentage yield of 78%.
Calibration procedure
A 10-mL graduated centrifuge glass tube was taken into which two solutions were added, i.e., 5.0 x 10⁻⁴ M H2IF in acetonitrile and acetate buffer (pH 4.8), each 1.0 mL. Then, 1.0 mL of different concentrations of aqueous copper chloride solution was added. Afterwards, the dilution of the mixture up to 5.0 mL was performed using acetonitrile. The combination was vortex stirred for about ten minutes at a temperature of 25 °C. In the end, the glass cuvettes were used to determine the absorbance values at 440 nm.
Application procedures
Analysis of water samples
The method proposed in this study was validated for Cu(II) ions analysis in tap water (Amman city) and river water (Zarka River). Standard copper solution (5.0 and 10 |ig mL-1) as a final concentration was spiked into real water samples obtained from tap water selected from different locations in Amman city-Jordan and the percent recoveries were determined.
Each water sample of 1000 mL volume was filtered (with Whatman No. 40) filter papers, then the samples were dried using a blend containing 2.0 mL of concentrated H2SO4 and 5.0 mL of conc. HNO3. Once the solution is cooled down, another 5.0 mL of nitric acid was added to the solution and then heated again. As soon as the solution became clear, neutralization of the solution was performed using dilute NH4OH. Afterwards, the solution was filtered and shifted to a flask with a suitable volume. Then, it was diluted to the mark using deionized water.21 After that certain aliquots of the solution were transferred and determined according to the calibration procedure.
Analysis of pharmaceutical samples
The author procured the commercial-scale pharmaceutical samples from the local markets, Amman-Jordan. From every preparation, 10 capsules were measured for their weight accurately. After grinding the capsule contents as a fine powder, it is dissolved in the mixture discussed earlier HNO3/H2SO4 (10:1) (50 mL:5 mL). Then, the solution was gently heated until is charred on the hot plate. Concentrated nitric acid is added to the solution in a drop-wise fashion and the solution is boiled until it turns out to be a colorless liquid. Then, the solution is added to water (5.0 mL) and evaporated to white fumes. Then, 0.1 M perchloric acid was added (5.0 mL) and diluted to an appropriate volume using the distilled water so as to get an absorbance value within the calibration linear range.
RESULTS AND DISCUSSION
The synthesized Schiffbase 2-((1))-2{2-[(1)-aza-3-2(2-hydroxyphenyl) vinyl]phenyl}-1-azavinyl)phenol) was prepared from the reaction of corresponding amine and dialdehyde (H2L).
Characterization of ligand (H2L): The percentage yield was 78%, melting point was 136 °C, elemental analysis was: 75%, H 5.1%, O 10.1%, N 8.8%.
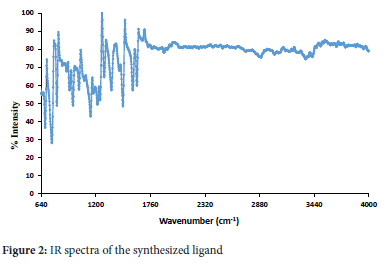
• Infrared: The peaks that were detected were as follow: 3335 v Asy(OH) : 3029 v ar(CH); 1615- 1575 v (C=N); 1553 v (C=C) cm-1 as shown in Figure 2.
• (1H-NMR) using (500 MHz, ppm, CDCl3) were: 8.8(s, 2H, OH), 8.10 (m, 2H, imine), (6.9-8.1) 12H, aromatic protons, as shown in Figure 3.
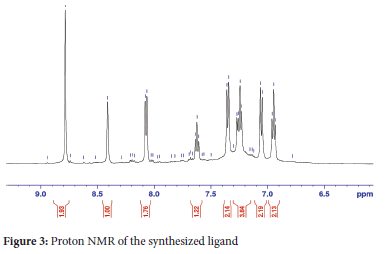
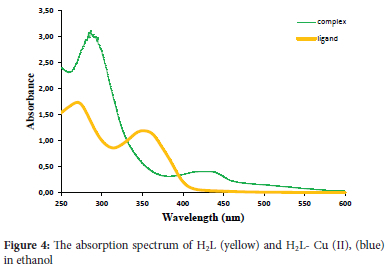
Figure 4 shows the UV spectra of Schiff base as well as the copper complex. Using ethanol as a solvent, two broad spectra were considered with maximum peaks in the range of ~360 and ~440 nm as a result of different transitions such as (tt-tt*) and (n-n*) correspondingly. In addition to these, the absorption spectra of the Cu-H2L complex show the appearance of a shifted peak to a longer wavelength at 440 nm. This infers the role played by azomethine group in the formation of metal complex.20
There was a sharp peak found at 1620 cm-1 in the infrared spectra of the H2L Schiff base due to the presence of the azomethine v(C=N) stretching vibration. Other IR peaks found at 3050, 1240 and 1455 cm-1 are attributed to v(OH), v(C-O) and S(OH) respectively. Mass Spectrometry (MS: ESI-MS (m/z, positive mode)): 317 (H2L-H+, 64%); 318 (H2L-H2+, 36%).
Based on the reaction between the (H2L) ligand and Cu (II) ions, a colored and stable complex is produced at room temperature. Figure 4 shows the absorption spectra of the ligand as well as the proposed complex. To conduct further analysis, the highest wavelength of the complex, i.e., 440 nm, was selected. All the variables that affect the sensitivity of the presented process were analyzed for the purpose of enhancing the absorbance and stability of the colored complex. These factors were studied using the univariate method as follows:
Effects of variables
Effect of the amount of the chelate
Different volumes of ligand (H2L) were added to a constant amount of Cu(II) ions (10.0 |ig mL-1) following the same procedure mentioned above, it was found that the maximum absorption of the colored product was obtained using 1.0 mL of ligand, and then this value was used as the optimum volume.
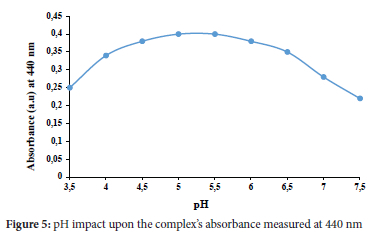
Effect of pH
The role of pH in impacting the stability of the complex produced is huge. So, it was studied using acetate buffer and adjusted with HCl/ NaOH solutions. The optimum pH was examined using different pH values of 0.1 M acetate buffer (3.5-7.5), as portrayed in Figure 5. The peak absorbance rate of the complex has obtained a pH of 5. The data was reproducible and reliable.
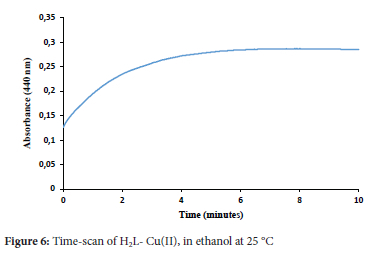
Effects of time and temperature
The absorbance of the copper complex was monitored with time at 25 °C, it was found that the absorbance became stable after about 5 minutes, as shown in Figure 6.
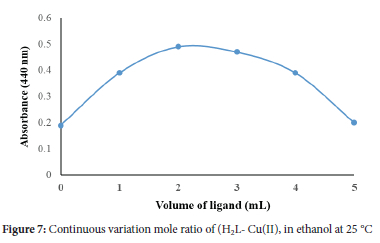
Stoichiometry of the copper complex
The continuous variation method was leveraged in this study to analyze the stoichiometry of the complex, in solution. The method is based on mixing different volumes of both metal and ligand solutions of 1.0 X 10⁻⁴ M at the optimized pH value, until the color of the solutions had developed. the absorbance values of the solutions were measured at 440 nm. The results obtained are shown in Figure 7. This reveals that, (1:1) stable complex is most likely formed between the Cu(II) ions ion and the chelate. The high molar absorptivity suggests charge transfer donation from Cu(II) ions to ligand.
Optimized structure
The optimized stable structure ofthe proposed chelate was investigated using Gaussian software22 as shown in Figure 8. The overall geometric optimization calculations were scanned with the help of Gaussian 6.0 software in line with the Density Functional Theory (DFT), with Lee-YangParr correlation functional (B3LYP) and 6-31G (d, p).23,24
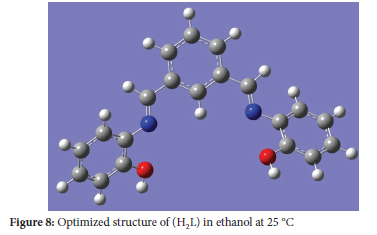
This result confirmed the formation of 1:1 copper-chelate stoichiometric ratio.25
Calibration results
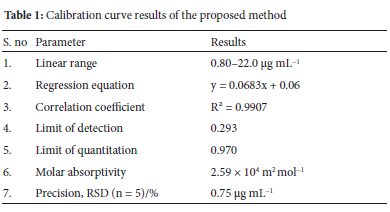
Based on applying optimization conditions, the calibration curve was obtained to quantify the copper (II). Here, Beer-Lambert's law was implemented along with the varying concentrations of Cu(II) ions. The obtained linear regression equation and the correlation coefficient were determined. The apparent molar absorptivity (e) was 2.59 X 10⁴ L mol-1cm-1. LOD (detection limit) was calculated using the formula (3Sa/b) whereas LOQ (quantification limit) was determined using (10Sa/b). Here, Sa corresponds to the SD of the response, whereas b denotes the slope of the calibration curve. The results are shown in Table 1.
Effect of different ions
The effects of different foreign ions such as Na+, K+, Ca+2 Mg+2 Cl-, NO3-, Br- ions, were studied on the determination of a 5.0 |igmL-1 Cu(II). the method of evaluating the interferences was based on the variation of the absorbance values more than 5%, it was found that the Na+, K+, Ca+2 Mg+2 Cl-, NO3-, Br- have no interfering effect more than 500 fold excess, other ions such as Zn, Fe Ag Mn show interferences around 100 fold excess. This effect of some transition metals may be minimized using some masking agents aiming at different interfering ions. It is clear that the interfering ions can be potentially found in environmental samples with tolerance ratio ranging from 100 to 500, therefore, it can be concluded that the developed method is fairly selective.
Applications to real water and pharmaceutical samples
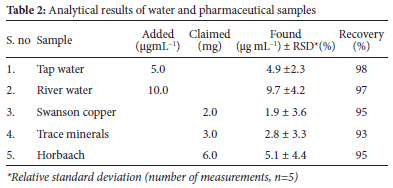
In order to validate the effectiveness of the method presented in this study, the amount of Cu(II) ions was quantified in two types of water samples (tap water and river water) and three different pharmaceutical vitamins. The results in Table 2 show that the spiked concentrations of Cu(II) ions (5.0 and 10.0 |ig mL-1) were quantitatively recovered using five replicates. The method was also applied for determination of Cu(II) ions values certified by the pharmaceutical vitamin manufacturers with different claimed levels (2.0, 3.0, and 6.0 mg). The relative standard deviation (RSD) was calculated by dividing the standard deviation of five measurements by the standard concentration of Cu(II) ions in real samples. RSD values of the Cu(II) ions were ranged less than 5% across the samples used, which explains why the method is quit precise. A relative error in the recovery studies was less than 5% which indicates that the applied method is quite accurate for the selected samples.25
CONCLUSION
In current research work, the author developed a novel, simple yet selective method to determine the Cu(II) through spectrophotometry using a novel ligand (H2L) chromogenic reagent. The complex formed has an intense color at room temperature without heating steps, which enables the determination of Cu(II) ions with low interference with other competing alkali metals, alkaline earths and transition metal ions. Moreover, the experimental findings open the door for future development of flow injection analysis and microextraction methods based on the new chromogenic reagent.
ACKNOWLEDGMENT
The author is thankful to the Department of Chemistry at the University of Jordan for its support.
CONFLICT OF INTEREST
The author declares no conflict of interest.
ORCID ID
Safwan Fraihat: https://orcid.org/0000-0002-6159-6720
REFERENCES
1. Wail A, Abbas AS, Al-Hamdani, Susan DA, Young G. Synthesis, characterization, and biological activity of Schiff bases metal complexes. J. Phys. Org. Chem. 2018;13. https://doi.org/10.1002/poc.3752 [ Links ]
2. Chellaian JD, Salin RS. Synthesis, characterization and biological studies of Schiff base metal complexes derived from 4-aminoantipyrine, acetamide and p-phenylenediamine. Inorg. Chem. Commun. 2020;119. https://doi.org/10.1016/j.inoche.2020.108087 [ Links ]
3. Abd El-halim HF, Omar MM, Mohamed GG. Synthesis, structural, thermal studies and biological activity of a tridentate Schiff base ligand and their transition metal complexes. Spec. Chim. Acta A. 2011;78. https://doi.org/10.1016/j.saa.2010.06.003 [ Links ]
4. Thahira B, Karen C, Tahir M, Fiona N, Rozita R, David J. Synthesis, characterization and biological activities of 3-methylbenzyl 2-(6-methyl pyridin-2-ylmethylene)hydrazine carbodithioate and its transition metal complexes. Tran. Metal Chem. 2010;35:871. https://doi.org/10.1007/s11243-010-9406-6 [ Links ]
5. Sabbah DA, AL-azaideh BA, Talib WH, Swiedan RH, AL-Zuheiri AM, Abu SG, Shraim S. New derivatives of sulfonylhydrazone as potential antitumor agents: Design, synthesis and cheminformatics evaluation. Acta Pharm. 2021;71:545. https://doi.org/10.2478/acph-2021-0043 [ Links ]
6. Gupta KC, Alekha K. Catalytic activities of Schiff base transition metal complexes. Coord. Chem. Rev. 2008;252:1420. https://doi.org/10.1016/j.ccr.2007.09.005 [ Links ]
7. Nelofer J, Rukhsana J, Rashad M. Synthesis, characterization and applications of new Schiff base as microbicidal agent and removal of heavy metals from water. Int. J. Env. Chem. 2019;101: 2510. https://doi.org/10.1080/03067319.2019.1694669 [ Links ]
8. Miroslava P, Jakub V, Katefina K, David V. Biological role of copper as an essential trace element in the human organism. Ceska Slov. Farm. 2018;67:143. [ Links ]
9. Paul B, Clement G, Anita K, Dwayne J. Heavy metals toxicity and the environment. Experientia Suppl. 2012; 101:133. https://doi.org/10.1007/978-3-7643-8340-4_6 [ Links ]
10. Mengting J, Hao Y, Bo L, Jiajia P, Dezheng Y. Review of the distribution and detection methods of heavy metals in the environment. Anal. Meth. 2020;48. [ Links ]
11. Ghadamali B, Mansour A, Chamjangali H, Shariati E, Motahare E, Bagherian A. Determination of copper(II) by flame atomic absorption spectrometry after its perconcentration by a highly selective and environmentally friendly dispersive liquid- liquid microextraction technique. J. Anal. Sci. & Tech. 2019;10. https://doi.org/10.1186/s40543-019-0164-6 [ Links ]
12. Bhargavi M, Swaminathan S, Uma M, John B. A review on detection of heavy metal ions in water-An electrochemical approach. Sens. & Actu. B: Chem. 2015;5:515. https://doi.org/0.1016/J.SNB.2015.02.122 [ Links ]
13. Dalibor M, Stankovic G, Mladen R, Jelena M, Ivan A, Marijana M, Dragan M. Determination of copper in water by anodic stripping voltammetry using Cu-DPABA-NA/GCE modified electrode Int. J. Elect. Sci. 2011; 6:5617. [ Links ]
14. Hashem EY, Seleim MM, El-Zohry AM. Spectrophotometric determination of copper(II) in pharmaceutical, biological and water samples by 4-(20 -benzothiazolylazo)-salicylic acid. J. Appl. Spec. 2011;78:586. https://doi.org/10.1080/17518253.2010.546370 [ Links ]
15. Kamble GS, Kolekar SS, Anuse MA. Synergistic extraction and spectrophotometric determination of copper (II) using 1-(2,4-dinitro aminophenyl)-4,4,6-trimethyl-1,4-dihydropyrimidine-2-thiol: Analysis of alloys, pharmaceuticals and biological samples. Spect. Chim. Acta A Mol. Bio. Spec. 2011;78:1455. https://doi.org/10.1016/j.saa.2011.01.027 [ Links ]
16. Uddin MN, Salam MA, Hossain MA. Spectrophotometric measurement of Cu(DDTC)2 for the simultaneous determination of zinc and copper. Chemosphere 2013;90:366. https://doi.org/10.1016/j.chemosphere.2012.07.029 [ Links ]
17. Uddin MN, Shah NM, Hossain MA, Islam MM. Copper and mercury in food, biological and pharmaceutical samples: Spectrophotometric estimation as Cu(DDTC)2 Amer. J. Anal. Chem. 2014;5:13. https://doi.10.4236/ajac.2014.513093 [ Links ]
18. Babayev K, Demir S, Andac M. A novel spectrophotometric method for the determination of copper ion by using a salophen ligand, N,N'-disalicylidene-2,3-diaminopyridine. J. Taib. Univ. Sci. 2017;11:808. https://doi.10.1016/j.jtusci.2017.02.001 [ Links ]
19. Sundaramurthy SL, Kannappan G, Gayathri M, Ganesh S. Synthesis, crystal structures, spectroscopic characterization and in vitro antidiabetic studies of new Schiff base Copper (II) complexes. J. Chem. Sci. 2016;128:1095. https://doi.org/10.1007/s12039-016-1099-8 [ Links ]
20. Salman S, Hamed A, Al-Saidi M. Spectrophotometric determination of trace concentrations of copper in waters using the chromogenic reagent 4-Amino-3-Mercapto-6-[2-(2-Thienyl)Vinyl]-1,2,4-Triazin-5(4H)-One: Synthesis, characterization, and analytical applications. Appl. Sci. 2020;10:3895. [ Links ]
21. Hashem EY, Seleim MM, Ahmed M. Environmental method for spectrophotometric determination of copper (II). Green Chem. Lett. and Rev. 2011;4. https://doi.org/10.1080/17518253.2010.546370 [ Links ]
22. (2009) Gaussian 09, Revision A.02. Gaussian, Inc., Wallingford. [ Links ]
23. Lee C, Yang W, Parr R.G. Development of the Colle-Salvetti correlation-energy formula into a functional of the electron densities. Phys. Rev. B Cond. Matt. 1988;37:785. https://doi.org/10.1103/physrevb.37.785 [ Links ]
24. Becke AD. Density-functional thermochemistry. The role of exact exchange. J. Chem. Phys. 1993;985648. https://doi.org/10.1063/L464913 [ Links ]
25. Ahmed MJ, Jahan I, Banoo S. A Simple spectrophotometric method for the determination of copper in industrial, environmental, biological and soil samples using 2,5-Dimercapto-1,3,4-thiadiazole. Anal. Sci., 2002; 18:805. https://doi.org/10.2116/analsci.18.805 [ Links ]
Received 21 March 2023
Revised 25 June 2023
Accepted 21 August 2023
* To whom correspondence should be addressed Email: s.fraihat@ju.edu.jo

