


Services on Demand
Article
 English (pdf)
 Article in xml format
 Article references
Indicators

Related links
-
 Cited by Google
 -
 Similars in Google
Share

 Permalink
South African Journal of Chemistry
On-line version ISSN 1996-840X
Print version ISSN 0379-4350
S.Afr.j.chem. (Online) vol.77 Durban 2023
http://dx.doi.org/10.17159/0379-4350/2023/v77a09
RESEARCH ARTICLE
Removal of heavy metals from aqueous solutions by adsorption using natural and ammonium carbonate modified kaolinite clays
John A. LawalI, *; Ezekiel O. OdebunmiII; Folahan A. AdekolaIII
IDepartment of Industrial Chemistry, Achievers University, Owo, Nigeria
IIDepartment of Chemistry, University of Ilorin, Ilorin, Nigeria
IIIDepartment of Industrial Chemistry, University of Ilorin, Ilorin, Nigeria
ABSTRACT
Natural kaolinite obtained from Share, Nigeria was treated with ammonium carbonate to enhance the adsorption capacity. The optimum operating conditions for the adsorption of metal ions on the natural clay (SK clay) were employed on the ammonium carbonate-treated clay (SK-AC clay). The adsorption data were analysed using adsorption isotherm and kinetic models. The statistical p-values were less than 0.05, indicating that the model terms are significant for the adsorption of the metal ions. The pseudo-second-order kinetic model best describes the metal ions adsorption mechanism. The activation energy values less than 40 kJ mol-1 obtained indicated physisorption. Langmuir adsorption isotherm model fitted the adsorption data for Fe2+, Zn2+ and Cr6+ ions while the Freundlich model fitted Pb2+ ions adsorption. Analysis of thermodynamic parameters shows the adsorption is spontaneous and endothermic. The ammonium carbonate-modified clay exhibited an increase in adsorption capacity from 10.74 to 13.60 mg g-1, 16.48 to 17.38 mg g-1 and 11. 96 to 13.8 mg g-1 for Fe2+, Pb2+ and Zn2+ ions while uptake of Cr6+ decreased from 8.75 to 7.25 mg g-1. The results showed that the adsorption of Fe2+, Pb2+ and Zn2+ ions onto kaolin-containing cowlesite can be enhanced by treating it with ammonium carbonate.
Keywords: adsorption, calcite, kaolinite, metal ions
INTRODUCTION
The increasing discharge of heavy metal-laden industrial wastewater into the environment without proper treatment is impacting negatively on aquatic animals, the environment and humans. Heavy metals are considered to be environmental hazards because they are toxic and not easily degradable.1-3 Metals such as iron, lead, chromium and zinc accumulated through the food chain are associated with health problems. For example, diseases such as hypertension, lethargy, neoplasia, and neurological disorder can be caused by excessive accumulation of iron.4-6 A high level of lead causes poisoning leading to brain damage, and dysfunction of the renal system, liver and central nervous system.7 High concentration of zinc poses health challenges such as anaemia, gastrointestinal disorder, skin dermatitis and nausea.8,9 In water, chromium exists in two stable oxidation states of +3 and +6 which differ in toxicity. Water-soluble Cr3+ is relatively non-toxic because it is less absorbed into the body tissue, while Cr6+ is toxic because it is highly absorbed into all cells of the body. Hence, accumulation of Cr6+ ion can cause respiratory distress, skin rashes, erythema of the face, duodenal ulcer and cancer.10,11
To eliminate heavy metals from wastewater before discharging into the environment, several methods have been developed and applied over the years. The conventional methods include precipitation/ neutralisation, membrane separation, solvent extraction, reverse osmosis, ion exchange, and adsorption.12 Chemical precipitation of copper ions from wastewater has successfully been carried out through a series of processes including decomposition reaction using calcium hydroxide, sedimentation at an adjusting pH range of 6-8 with 20% sulphuric acid and sedimentation using nickel and copper reagents.13 Removal of Zn2+, Ni2+ and Co2+ using a dynamic membrane prepared from electrospinning of chitosan and polyvinyl alcohol on polyester web has been investigated. From the results, removal efficiencies for the heavy metal ions and turbidity were over 90%.14 Thasneema et al. investigated liquid-liquid extraction of Zn2+, Pb2+ and Hg2+ using trihexyltetradecylphosphonium with three different ionic liquids which include chloride, dicyanamide and bis (trifluoromethyl sulfonyl) amide. The extraction efficiency obtained for the three ionic liquids was approximately 100% for all heavy metals. This removal efficiency was attributed to the hydrophobic nature of the ionic liquids.15 Removal of chromium from chromium-coating production wastewater has been carried out using commercial Sea Water High Rejection (SWHR) technique and polyamide thin film high rejection brackish water membrane denoted as SE, AG and SG model series. At optimum acidic pH of 3, a rejection efficiency greater than 91% was obtained for the membranes in the increasing order of AG > SWHR > SG > SE.16 Moosavirad et al. studied the efficiency of a commercial ion exchange resin (Dowex 50WX8) to remove heavy metal ions from industrial wastewater. The optimum parameters were a pH range of 4-6 and 200 mg resin at a 4.0 mLmin-1 flow rate. From the results, the absorption capacity obtained for Cu2+, Cd2+, Zn2+, Ni2+ and Pb2+ were 45, 50, 50, 40 and 60 mg g-1 respectively.17 Sodium hydroxide-modified kaolinite has been utilized for the adsorption of heavy metal-laden steel industrial wastewater found to contain Fe2+, Pb2+, Zn2+ and Cr6+ ions with concentrations of 309.0, 20.50, 40.40 and 10.90 mg L-1 for respectively.18 After four successive adsorption cycles, the metal ions concentration was removed at approximately 99.77%, 99.95%, 98.91% and 99.91% for Fe2+, Pb2+, Zn2+ and Cr6+ ions respectively. The main advantages of some of these techniques are compatibility with other techniques and selectivity. However, membrane separation and resin are considered expensive and are associated with fouling problems. Solvent extraction is ineffective at high metal concentrations, and chemical precipitation has poor settling ability.19
Compared to other techniques, the adsorption method is considered to be simple and more economically viable. To date, different adsorbents including activated carbon, carbon nanotubes, biological materials, agricultural waste, and clays have been used to remove heavy metals from aqueous solutions. Rodriguez et al. investigated the adsorption capacity of multi-walled and suspended carbon nanotubes for the adsorption of some heavy metals. The results showed that the adsorption of Cu2+, Mn2+ and Zn2+ on the multi-walled carbon nanotube increased six times more than the suspended carbon nanotubes with improved dispersion stability.20 The results for the adsorption of Cd2+ and Pb2+ on activated carbon produced from municipal organic solid waste have been found to be effective for the metal ions with removal efficiencies of 78% and 94% for Cd2+ and Pb2+ ions respectively.21 Adsorbent developed from magnetic Fe3O4 nanoparticles on hydrothermally treated fungi (Lucidum) spores has been found to remove Pb2+ ions from wastewater from a concentration of 5.0 ppm to 0.9 ppm. The results showed that the bio-hybrid adsorbent can be reused after acid regeneration treatment.22 Adsorption capacity and removal efficiency of Cu2+ and Ni2+ ions were studied on raw kaolinite and sulphuric acid-activated kaolinite. At the optimum conditions, the acid-activated kaolinite recorded higher adsorption capacity and percentage removal efficiency than the raw kaolinite, and the uptake of Cu2+ was greater than Ni2+ for both raw and acid-activated clay.23
Clay is a natural low-cost adsorbent that has been utilized in the adsorption of heavy metals from wastewater. The different types of clay minerals are determined basically by the two fundamental crystal sheets; the tetrahedral or silica and the octahedral or alumina sheets. Clay mineral layer structures are divided into two groups, 1:1 and 2:1 type, determined by the number of tetrahedral and octahedral sheets in the layer structure.24 Kaolinite, a type 1:1 layered structure (Al2Si2O5(OH)4) has been used for the removal of heavy metals from aqueous solutions.25 Most natural kaolinites are composed of other crystal minerals as impurities which can reduce the adsorption capacity of the clay. Such impurities include anorthite, a calcium-rich aluminosilicate mineral belonging to the plagioclase feldspar family, cowlesite, a low-silica zeolite with extra-framework cations,26 and quartz, a natural hydrophilic oxide-free silica mineral.27 Removal of these impurities or their conversion to an adsorbent can greatly improve the adsorption capacity of kaolinites.
This study was undertaken to enhance the adsorption capacity of kaolinite-containing cowlesite mineral by treating it with ammonium carbonate. The kinetics, isotherms and thermodynamics parameters for adsorption of Fe2+, Pb2+, Zn2+ and Cr6+ ions from aqueous solutions on the clay were also studied. The cowlesite portion of SK clay was converted to calcite using ammonium carbonate to enhance its adsorption capacity. Calcite is a stable polymorph of calcium carbonate which has been used for the adsorption of heavy metals.28-30 Synthesis of calcite from different materials has also been reported.31-33 Adekola et al. investigated the adsorption of Pb2+ ions with an initial concentration of 12.0 mg L-1 using natural and synthetic calcite. From the results, the synthetic calcite presented a higher adsorption capacity.34 The result for adsorption of Pb2+ and Cd2+ onto calcitic limestone with 40% calcite has been found have adsorption capacity in the order of Pb2+ > Cd2+ with removal efficiency of 40 mg g-1 and 1.3 mg g-1 for Pb2+ and Cd2+ respectively.35 Adsorption of heavy metals on kaolinite and calcite is well established. Hence, the conversion of a non-adsorbent mineral on SK-clay to calcite, results in a kaolinite-calcite matrix that will improve the adsorption capacity ofthe adsorbent. Operating parameters for the adsorption of the heavy metals include pH, adsorbent particle size, adsorbent concentration, agitation speed, initial metal ion concentration, and effect of ammonium carbonate modification. Statistical optimisation of the adsorption experiments based on the interaction of the parameters with contact time was designed and evaluated using Design-Expert software. The adsorption data obtained were analysed using different kinetic and adsorption isotherm models and the thermodynamic parameters were calculated. Relevant spectroscopic and microscopic techniques were used to characterise the SK and SK-AC clays respectively.
MATERIALS AND METHODS
Preparation of adsorbents
The clay sample (SK clay) was obtained from a deposit in Share, North of Bida basin, Kwara State, Nigeria. The clay sample collected was dried in the oven at 105 °C for one hour and pulverised. The grounded clay sample was soaked in deionised water for 24 hours and stirred. The pure clay particles in the slurry were sieved through a British Standard 63 μm sieve for separation from sand particles and other impurities of larger size. The filtrate obtained was allowed to settle for 3 hours to separate the silt from the clay. The clay particles in the supernatant solution were sedimented by centrifugation for 30 minutes at the speed of 3500 revolutions per minute (rpm). The water at the top layer was decanted and the sedimented clay particles dried in an oven at 105 °C for 1 hour.36
The following modified procedure was followed to modify SK clay with ammonium carbonate. A 20 g portion of 63 μm fraction of SK clay was added to a 0.5 L solution of 0.2 M ammonium carbonate in a conical flask. The mixture was stirred using a magnetic stirrer at the rate of 200 rpm, for 60 minutes at 27 °C. The slurry obtained was centrifuged at 3000 rpm for 30 minutes and the sediment was washed repeatedly with deionised water until a neutral pH was obtained and dried at 105 °C.36
Characterisation of adsorbents
X-Ray Diffractometry (XRD): The mineralogical characterisation of SK clay and SK-AC clay was carried out with X-Ray Diffractometer BRUKER, AXS D8 Advance (Bruker, Germany) using copper K radiation (λ K= 1.5406A) at measurement time of 0.5 sec/step in 2 theta range.
Fourier Transform Infrared Spectroscopy (FTIR): The IR spectral of < 2.0m sedimented particle size fractions of the SK clay and SK-AC were run on Bruker Tensor 27 Platinum ATR-FTIR (Bruker, Germany) operated in the range of 4000 - 400 cm-1.
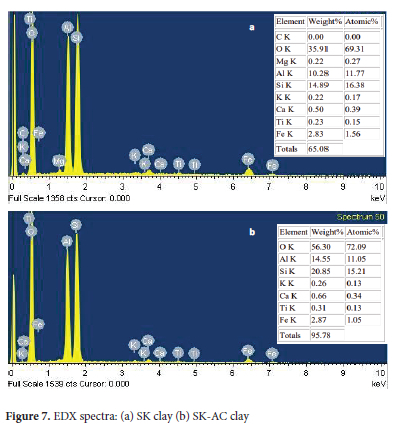
Scanning Electron Microscopy and Energy Dispersive X-ray (SEM-EDX): The morphological characterisation of the clay samples was carried out using TESCAN VEGA TS 5136LM Scanning Electron Microscope interphase with Electron Dispersive Spectrometer (ThermoFisher Scientific, USA) to observe the pore structure, shape, texture and elemental composition of the < 2.0m sedimented particle size fraction of the clay samples. Before SEM images were taken, the dried sample was sprinkled on a double-sided carbon tape, excess blown off, and coated with a thin film of gold to prevent surface charging and thermal damage by the electron beam. The EDX analysis of the samples was performed on the same instrument without coating
Surface Area Determination: The clay samples' surface area-pore volume-pore sizes were determined using Micrometrics Type Tristar II 3020 Surface Area Analyser (Micrometrics Instrument Corporation, USA). The dried samples were ground to powder and 0.43 g of the ground sample was outgassed at a pressure of 0.6 Pa first at 30 °C for 6 hours and further at 110 °C for 2 hours. The surface area-pore volume-pore sizes of the outgassed sample were measured by static adsorption of nitrogen at a temperature of -195.8 °C. The nitrogen adsorption/ desorption isotherm was automatically recorded by measuring the equilibrium pressure in the system after the introduction of a calibrated volume of nitrogen gas. The monolayer capacities of the adsorbate cross-section were then measured using the gas adsorption data based on the BET adsorption theory programmed on the system.
Adsorption experiments
The solutions of Fe2+, Pb2+, Zn2+, and Cr6+ ions were prepared from the metal salts (FeSO4.7H2O, Pb(NO3)2, ZnSO4.7H2O and K2Cr2O7) obtained from Sigma-Aldrich by dissolving the calculated amount of the salt in deionised water. An aqueous solution containing 100 mg L-1 of the single metal ion solution was contacted with SK clay in a water bath thermostated shaker for 240 minutes. Samples (5.0 mL) were withdrawn in triplicate using a syringe in the first 15 minutes and subsequently at time intervals of 30 minutes. The withdrawn samples were centrifuged at 3500 rpm for 15 minutes and the supernatant solutions were analysed using Atomic Absorption Spectrophotometer (Buck Scientific 210 VGP, USA).
The design of the two-factorial experiments using Response Surface Methodology (RSM); optimal (custom) was done using Design-Expert Version 10 software. The average value of the metal ions concentration obtained from AAS analysis was used to calculate the amount of metal ions adsorbed and entered into the software as response for the experimental runs. Analysis of Variance (ANOVA) was applied to determine the significance of the adsorption process. Notations A and B were used in the experimental runs to study the interactive effect of two factors: A for all operation parameters and B for contact time. The statistical significance of the coefficient in the regression function of the response was determined using probability (p) and Fisher (F-test) values.37,38
The influence of parameters (A) investigated for the adsorption includes pH of 2.0, 2.5, 3.0, 3.5, 4.0, 4.5, 5.0 and 5.5 for Fe2+, 2.0, 2.5, 3.0, 3.5, 4.0, 4.5 for Pb2+, 2.0, 3.0, 4.0, 5.0, 6.0 and 7.0 for Zn2+, and 2.0, 3.0, 4.0, 5.0, 6.0, 7.0, 8.0, 9.0 and 10.0 for and Cr6+ ions respectively. The stated pH ranges were used to avoid precipitation of the metals above pH of 5.5, 4.7, and 8.0 for Fe2+, Pb2+ and Zn2+ respectively.39 Adsorbent particle size of 63, 75, 150, 250 and 300 μm, adsorbent concentration (1.0, 2.0, 3.0, 4.0, 5.0 and 6.0 g L-1), agitation speed (150, 200, 250 and 300 rpm), initial metal ion concentration (25, 50, 100, 150 and 200 mg L-1) and temperature (303, 308, 313, 318, 323, 328 and 333 K). The effect of ammonium carbonate-treated (SK-AC) clay was investigated at optimum conditions of the above operational parameters.
A mass balance equation was used to determine the adsorption capacity of SK-clay:

where Co and Cx are the initial metal ions concentration and concentration at equilibrium (mg L-1), V is the volume of metal ion solution (L), m is the mass of adsorbent (g) and qx is the amount of metal ions in the adsorbent at equilibrium (mg g-1).
The percentage removal of heavy metal ions from the solution was calculated using the formula:

The data obtained from the adsorption of the metal ions were evaluated using the kinetic models presented in Table 1.40
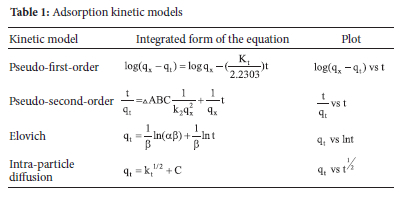
The kinetic parameters in Table 1 are denoted as follows: qt is the amount of metal ions adsorbed at time t (mg g-1), k1 is the pseudofirst-order rate constant (min-1), k2 is the pseudo-second-order rate constant (mg g-1 min-1), α is the Elovich rate of initial adsorption (g.min2 mg-1), β is the Elovich desorption constant (g.min mg-1), K is the rate constant at equilibrium and C is the intra-particle diffusion constant.
From the kinetic analysis of adsorption data, the activation energy (Ea) was determined using Arrhenius equation:41

where, A is Arrhenius factor, R is the ideal gas constant (8.314 J mol-1 K-1) and T is temperature in Kelvin (K).
The equilibrium adsorption data obtained from the results of initial metal ion concentrations were analysed using the adsorption isotherm models (Table 2).42
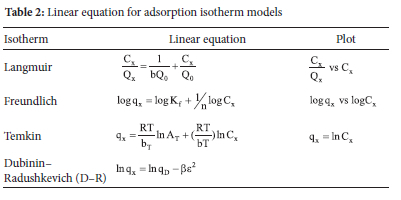
The isotherm parameters in Table 2 are denoted as follows: b is the Langmuir isotherm constant (dm3 mg-1), Qn is the maximum monolayer coverage capacities ofthe clay (mg g-1), KF is the Freundlich isotherm constant (mg g-1) (dm3 g-1), n is the adsorption capacity, At is the Temkin isotherm equilibrium binding constant corresponding to the maximum bonding energy (L g-1), bt is Temkin constant for the heat of adsorption (J mol-1), qm is D-R theoretical saturated capacity (mg g-1) and β is the D-R isotherm constant related to the degree of adsorption (kJmol-1).
The mean free energy E (kJ mol-1) of adsorption per molecule of the adsorbed metal ion was determined by using the D-R relationship

The thermodynamic parameters including Gibbs free energy change (ΔG), enthalpy change (ΔΗ) and entropy change (ΔS) were calculated using the following equations:
Vant't Hoff equation was used to calculate AH and AS:43

The values of AH and AS were obtained from the slope and intercept of the plot of lnK versus. The value of AG was calculated using the expression:44

To make the value of K dimensionless, its value was multiplied by the molecular weight and concentration of metal ion solution at a standard rate (Mole water per litre i.e., 1000 g divided by the molar mass of water).45
RESULTS AND DISCUSSION
Characterisation of SK clay and SK-AC clay
X-ray diffraction analysis
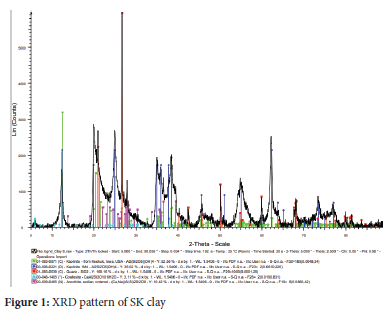
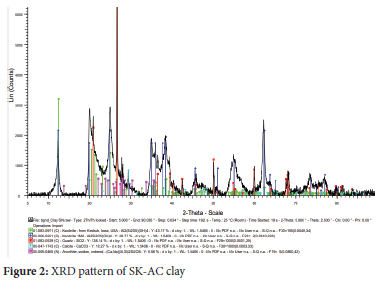
The reflection peaks of the SK-clay sample producing the kaolinite interlay spacing were predominantly observed at 12.5, 25.0, 35, 38.5 and 63.50 2θ with a percentage composition of 81.03% (Figure 1). The composition of free silica (quartz) was 4.39% at interlayer spacing reflection peaks of 21.0, 26.5 and 50.00 2θ. Similar diffraction patterns have been reported for kaolinite.46 Other minerals identified in the clay were anorthite (7.32%) at 14, 19, 22 and 280 2θ and cowlesite (7.26%) at 6.0, 11.5, 23.0 and 300 2θ respectively. The observed reflection peaks for these minerals are in agreement with the literature: anorthite, 13, 18, 22, 27.5, 300 2θ,47 and cowlesite, 23.3 and 30.00 2θ.48 The XRD pattern of SK-AC clay showed the appearance of calcite at 23, 29.5, 36, 43 and 47.50 2θ (Figure 2). The percentage composition of the minerals after treatment with ammonium carbonate was 88.10%, 4.13%, 4.62% and 3.15% for kaolin, calcite, quartz and anorthite respectively. The reaction of ammonium carbonate with cowlesite (CaAl2Si3O10.6H2O) present in SK clay resulted in the formation of calcite. This is made possible by the reaction of CO32- ions released as a result of the decomposition of (NH4)2CO3 with Ca2+ ions entrapped electrostatically in the cowlesite mineral. The ion entrapment method has been used to synthesize calcite49 and its synthesis using a carboxylate surface group has also been reported.50 Also, calcite has been synthesized from the reaction of sodium and potassium compounds with carbonates.51
Surface area parameter characterisation
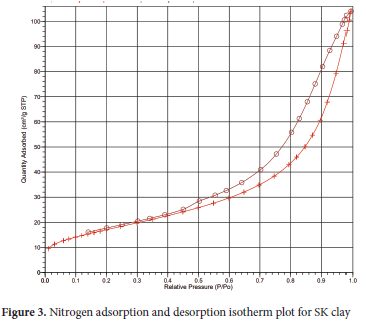
Surface area analysis of the clays was done using Brunauer- Emmett-Teller (BET), Langmuir and t-plot techniques, while surface areas of pores, pore volume and pore size distribution were determined using Barrett, Joyner and Halenda (BJH) technique.52,53 The adsorption-desorption isotherm intercalated curve (Figures 3 and 4) revealed the SK clay and SK-AC clay as mesoporous (type IV isotherm) with hysteresis loop pattern type H3 platelet-like clays. 54 The pore structure parameter results for SK clay (Table S1), showed a single point surface area of 60.21 m2 g-1 and BET surface area of 11.04 m2 g-1 respectively. The multilayer thickness on the pore surface area as obtained from the Langmuir surface area and t-plot were 153.60 and 65.63 m2 g-1 respectively. Similar surface area characterisation results for kaolinite clay have been reported.55
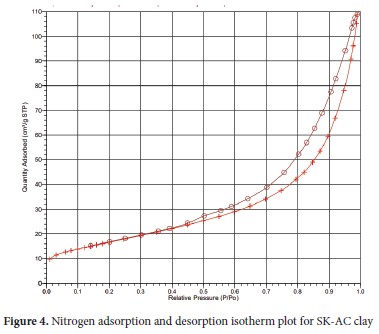
Variation in pore structure parameters of the clay as a result of treatment with ammonium carbonate was recorded. After the treatment, an increase in BET surface area from 11.04 to 14.0 m2 g-1 and a decrease in single point surface area from 60.22 to 58.76 m2 g-1 were obtained for SK-AC clay. BJH adsorption surface area of pores increased from 61.57 to 62.53 m2 g-1, while desorption surface area of the pores decreased from 75.51 to 72.60 m2 g-1. The Dubinin-Astakhov micro-pore surface and nanoparticle size equally increased from 87.16 to 89.15 m2 g-1 and 4,284.46 to 5,435.09 A respectively. The increase in these parameters indicates the ability of SK-AC to retain more adsorbed metal ions than the natural SK clay.
Fourier transform infrared spectroscopic analysis
The results of the FTIR analysis of SK clay and SK-AC are shown in Figure 5. The SK clay presented two intensive absorption bands at 3694.79 and 3646.66 cm-1, representing hydroxyl (OH) groups stretching of the dioctahedral layer and inner hydroxyl groups and a third weak peak observed at 3620.39 cm-1 is the layer-surface OH group. These spectra bands and the XRD results confirm the clay as Kaolin and are supported by the literature.56 The broad and weak absorption band at 3418.06 cm-1 is due to the stretching of the H-O-H vibration of adsorbed water, while the peak at 1634.34 cm-1 corresponds to deformation bands of water. The IR region of 1200 to 455 cm-1 is characterised by Si-O-Si stretching vibrations (1114.62 cm-1), Si-O stretching vibration (995.02 cm-1) and bending vibration absorption band of Al2-OH (909.68 cm-1). Peaks at 792.07 and 747.44 cm-1 correspond to Al-O and Si-O out of plane, while the absorption peaks at 522.13 and 455.73 cm-1 were assigned to Al-O-Si and Si-O-Si deformation respectively. Similar absorption bands for kaolin have been reported.57
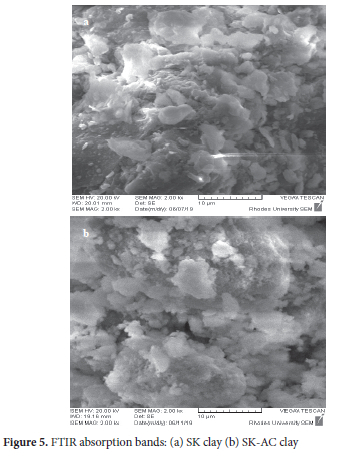
No major significant shifts in frequencies were observed in the OH groups stretching vibration at the octahedral surface, A-Al-OH and Si-O bending after treatment with ammonium carbonate. However, a variation in the H-O-H deformation band at 1633.21 cm-1 was observed and a weak band at 1434.80 cm-1 resulted from the vibration of C-O stretching of the carbonate.58
Scanning electron micrograph and electron dispersive x-ray analysis
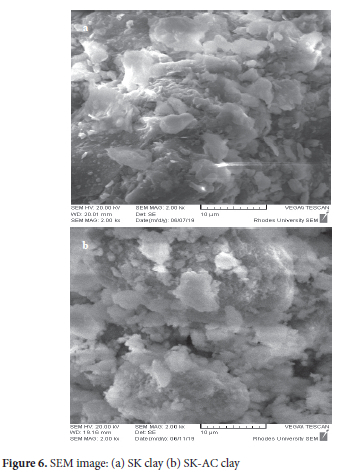
The micro-morphology image of the SK and SK-AC clay are shown in Figure 6. The SEM image reveals the structural orientation of SK clay as bulky flake-like particles of various sizes in dispersed form. Filmy particles of various sizes dominate the SK-AC clay. SEM images of kaolinite with thin-flaky layers and dispersed-orientated structures have been reported.59
The EDX analysis shows the predominant elements are aluminum, silicon, carbon and oxygen (Figure 7). Other minor elements detected were potassium, titanium, iron and magnesium. The elemental analysis result shows a signal difference in intensities of weight (%) for the elements after treatment with ammonium carbonate in the following manner. Carbon was detected in SK-AC (3.07%). O-SiO2 increased from 35.91% by weight in SK clay to 56.30% in SK-AC and S-SiO2 increased from 14.89% in SK-clay to 20.85% in SK-AC. Al-Al2O3 also recorded a substantial increase from 10.28% in SK clay to 14.55% in SK-AC clay. Only slight changes were recorded for elements such as titanium, magnesium, calcium and iron. EDX spectra of some kaolinite clays have been reported to contain silica and alumina in the range of 54.66 to 63.35% and 22.42 to 25.74% by mass respectively. 60,61
Adsorption results
Effect of pH
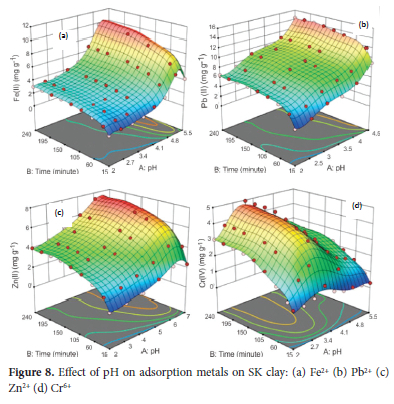
The experiment to investigate the effect of pH on the adsorption of the metal ions on the clay was performed at a pH range of 2.0 - 5.5, 2.0 - 4.5, 2 - 7 and 2 - 10 for Fe2+, Pb2+, Zn2+ and Cr6+ ions respectively. The average value of the metal ions obtained from AAS analysis was used to calculate the response (amount of metal ions adsorbed) for the experimental runs of 72 for Fe2+, 54 for Pb2+ and Zn2+ and 81 for Cr6* ions. The set pH range is to avoid precipitation of the metal hydroxides which occurs above the pH range highlighted above.60 Other parameters kept constant include particle size of 63 μm, adsorbent concentration of 4.0 g L-1, temperature of 313 K, agitation speed of 250 rpm and initial metal ion concentration of 100 mg L-1. The results for the adsorption of the metal ions (Figure 8), showed the adsorption capacity of SK-clay for Fe2+ significantly increased as the pH was increased from 2.0 to 5.0. The rate of adsorption of Fe2+ was observed to be rapid in the first 15 minutes and then increased gradually to 120 minutes. Adsorption at contact time above 120 minutes was characterized by stable uptake; an indication of near state of adsorption equilibrium till contact time of 240 minutes with optimum removal efficiency of 39.0% (9.75 mg g-1). An increase in pH from 5.0 to 5.5, resulted in a decrease in uptake. This can be attributed to the hydrolysis of Fe2+ at a pH above 5.0, hence preventing the migration of the metal ions from the solution into the adsorbent surface 62,63 The adsorption capacity for uptake of Pb2+ increased as the pH increased from 2.0 to 4.5 with an optimum adsorption efficiency of 57.4% (14.35 mg g-1) at 240 minutes. The rate of Pb2+ adsorption was rapid in the first 15 minutes of contact time. The adsorption then proceeds at a slow rate to reach a near state of equilibrium at 90 minutes with a stable or no significant increase from above 90 to 240 minutes. For the Zn2+ ions, an increase in adsorption was obtained as the pH increased from 2.0 to 6.0 with maximum adsorption of 29.3% (7.33 mg g-1) at contact time 240 minutes. The rate of removal was initially rapid from the starting to 60 minutes of contact and a near-steady state of equilibrium was obtained above 120 to 240 minutes. A decrease in the adsorption of Zn2+ at neutral pH of 7.0 was attributed to the formation of zinc hydroxide.64 The pH range of 2 to 10 was used for the adsorption of Cr6+ and optimum adsorption of 19.8% (4.95 mg g-1) was obtained at a pH of 5.0 after a contact time of 240 minutes. The rate of removal was fast within 15-30 minutes and then slightly increased to 150 minutes before equilibrium of adsorption was attained. High adsorption of Cr6+ on clays at a pH range of 4.0 to 6.0 was attributed to the binding of Cr6+ to the hydroxyl group of the clay in the anionic form (hydrochromate) at this pH range.65 A decrease in adsorption of the metal ions at very low pH can be attributed to the high concentration of H+ ions competing with the metal ions for adsorption on adsorbent active sites,66 while a decrease in adsorption at pH above 6.0 is due to the formation of hydroxide complexes.67 From the results, the maximum adsorption capacity was obtained at pH of 4.5 for Pb2+, 5.0 for Fe2+ and Cr6+ and 6.0 for Zn2+ ions respectively.
Effect of particle size
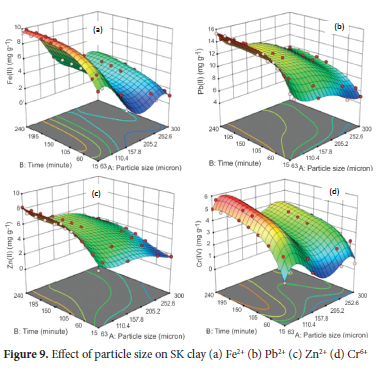
The effect of particle size on the adsorption of metal ions was performed at particle size of 63, 75, 150, 250 and 300 μm. The average value of the metal ions obtained from AAS analysis was used to calculate the response (amount of metal ions adsorbed) for 45 experimental runs for each of the metals ions. Parameters kept constant include optimum pH value of 4.5 for Pb2+, 5.0 for Fe2+ and Cr6+ and 6.0 for Zn2+ ions, adsorbent concentration of 4.0 g L-1, agitation speed of 250 rpm, initial metal ion concentration of 100 mg L-1 and temperature of 313 K. From the results (Figure 9), the maximum adsorption capacity for Pb2+(61.5%, 15.38 mg g-1) and Zn2+ (33.0%, 8.25 mg g-1) were obtained with an adsorbent particle size of 63 μm at 240 minutes. The maximum adsorption capacity for Fe2+ (39.0%, 9.75 mg g-1) and Cr6+ (22.5%, 5.625 mg g-1) were obtained with particle size 75 μm at 240 minutes. As the particle size increased from 75 to 300 μm, the adsorption of all the metal ions decreased drastically from 9.75 to 3.75 mg g-1 for Fe2+, 15.38 to 9.75 mg g-1 for Pb2+, 8.25 to 3.85 mg g-1 for Zn2+ and 5.625 to 4.5 mg g-1 for Cr6+ respectively. The 3D response surface pattern shows the adsorption of Fe2+, Pb2+ and Zn2+ is higher at particle size 63 μm while for Cr6+, the uptake is significant at a particle size of 63 and 75 μm respectively. Adsorption of the metal ions with particle sizes 63 and 75 μm was rapid in the first 15 minutes of contact time, followed by a gradual increase up to 120 minutes; above which was characterised by little or no significant increase. A larger particle size of 150 to 300 μm tends to attain adsorption equilibrium at a contact time of 60 minutes. Smaller particle size increases the surface area of the adsorbent for effective contact with adsorbate molecules.6
Effect of adsorbent concentration
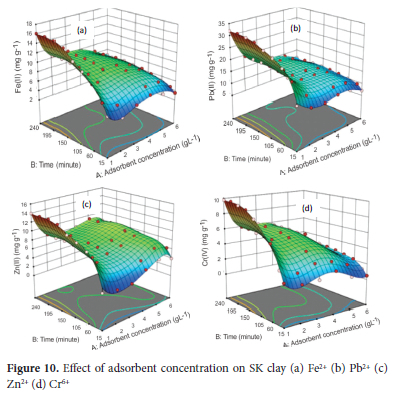
The effect of adsorbent concentration was determined using the optimum pH of 4.5 for Pb2+, 5.0 for Fe2+ and Cr6+ and 6.0 for Zn2+, with particle size of 63 μm for Pb2+ and Zn2+ and 75 μm for Fe2+ and Cr6+ ions, agitation speed at 250 rpm, initial metal ion concentration of 100 mg L-1 and temperature of 313 K. The average value of the metal ions obtained from AAS analysis was used to calculate the response (amount of metal ions adsorbed) for 54 experimental runs for each of the metals ions. From the results obtained (Figure 10), an increase in adsorbent concentration from 1.0 to 5.0 gL-1, increased the uptake of Fe2+ from 16.1% to 43% (16.1 - 8.6 mg g-1), Pb2+ from 32% to 71.3% (32.0 - 14.26 mg g-1) and Zn2+ from 14% to 46.3% (14.0 - 9.26 mg g-1) respectively after a contact time of240 minutes. Adsorption of Cr6+ ions increased from 9.8% (9.8 mg g-1) at 4.0 g L-1 to 22.5% (5.625 mg g-1) at 4.0 g L-1. Increasing the concentration of the adsorbent from 5.0 to 6.0 gL-1, led to a decrease in adsorption capacity for Fe2+ and Pb2+ to 41% (6.83 mg g-1) and 70% (11.67 mg g-1), while that for Zn2+ recorded a slight increase to 48% (8.0 mg g-1). For Cr6+, the uptake decreased from 22.5% at 4.0 g L-1 to 18% (3.0 mg g-1) at 6.0 g L-1. The 3D response surface plot showed the adsorption gradually increased as the time increased from 15 to 150 minutes. At a contact time of 180 minutes and above, the uptake of the metal ions tends to attain equilibrium with little or no significant increase in adsorption. From these results, 5.0 g L-1 was chosen as the most suitable adsorbent concentration for Fe2+, Pb2+ and Zn2+ ions respectively and 4.0 g L-1 for Cr6+ ions. The mass of adsorbate metal ion per unit mass of adsorbent decreasing with an increase in adsorbent weight can be attributed to a decrease in the adsorbate-adsorbent ratio as the concentration of the adsorbent increases.69
Effect of agitation speed
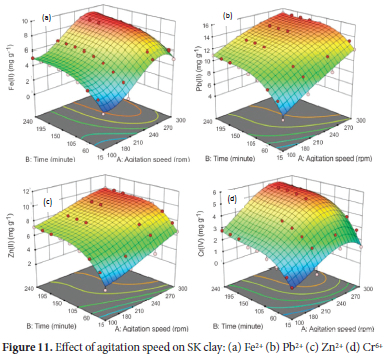
The effect of agitation speed in the range of 200 to 300 rpm was determined using the optimum pH of 4.5 for Pb2+, 5.0 for Fe2+ and Cr6+ and 6.0 for Zn2+, particle size of 63 μm for Pb2+ and Zn2+ and 75 μm for Fe2+ and Cr6+ ions, adsorbent concentration of 4.0 g L-1 for Cr6+ and 5.0 g L-1 for Fe2+, Zn2+ and Pb2+, initial metal ion concentration of 100 mg L-1 and temperature of 313 K. The average value of the metal ions obtained from AAS analysis was used to calculate the response (amount of metal ions adsorbed) for 36 experimental runs for each of the metals ions. The 3D response surface plots showing the adsorption pattern for the effect of agitation speed are shown in Figure 11. The maximum adsorption capacity for Fe2+ (44.3%, 8.86 mg g-1) and Cr6+ (22.5%, 5.625 mg g-1) were recorded at the speed of 250 rpm, while the maximum uptake for Pb2+ (75%, 15.0 mg g-1) and Zn2+ (50%, 10.0 mg g-1) was attained at an agitation speed of 300 rpm after a contact time of 240 minutes. The uptake of the metal ions increased rapidly to a near state of equilibrium at 120 minutes. Above this time, till contact time of 240 minutes recorded no significant increase in adsorption. The increase in adsorption capacity as the speed of agitation speed increases can be attributed to a reduction in the film boundary layer and an increase in the rate of diffusion of ions to the adsorbent surface.70 From the results, the maximum uptake of the metal ions was obtained at an agitation speed of 250 rpm for Fe2+ and Cr6+ and 300 rpm for Pb2+ and Zn2+ ions respectively.
Effect of initial metal ion concentration
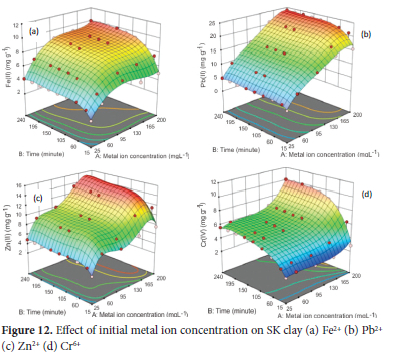
The effect of initial metal ion concentration (25 to 100 mgL-1) was determined using the optimum pH of 4.5 for Pb2+, 5.0 for Fe2+ and Cr6+ and 6.0 for Zn2+, particle size of 63 μm for Pb2+ and Zn2+ and 75 μm for Fe2+ and Cr6+ ions, adsorbent concentration of 4.0 gL-1 for Cr6+ and 5.0 g L-1 for Fe2+, Zn2+ and Pb2+, agitation speed of 250 rpm for Fe2+ and Cr6+ and 300 rpm for Pb2+ and Zn2+ and temperature of 313 K. The average value of the metal ions obtained from AAS analysis was used to calculate the response (amount of metal ions adsorbed) for 45 experimental runs for each of the metals ions. The results obtained are presented in Figure 12. As the initial metal concentration increased from 25 to 50 mg/L, the percentage adsorption of Fe2+ decreased from 84% (4.2 mg g-1) to 65% (6.58 mg g-1) at a contact time of 240 minutes. With further increase in initial metal ion concentration between 100 to 200 mgL-1, the percentage of metal ion adsorbed reduced significantly with an increase in adsorption capacity to 44.3% (8.86 mg g-1) at 100 mg L-1, 30% (9.18 mg g-1) at 150 mg L-1 and 25% (10 mg g-1) at 200 mg L-1. A similar result was obtained for the adsorption of Pb2+ ions. As the initial metal ion (Pb2+) concentration increased from 25 to 200 mg L-1, the percentage of Pb2+ adsorbed decreased with an increase in adsorption capacity: 98% (4.9 mg g-1), 94.4% (9.44 mg g-1), 76% (15.2 mg g-1), 69.5% (20.84 mg g-1) and 60% (24.0 mg g-1) at 25, 50, 100,150 and 200 mg L-1 at a contact time of 240 minutes. The adsorption capacity of 97.4% (4.87 mg g-1) and 88.5% (8.85 mg g-1) were recorded for Zn2+ at initial concentrations of 25 and 50 mg L-1. As concentration increased to 100, 150 and 200 mg L-1, the percentage adsorption drastically reduced to 50% (10.0 mg g-1), 44.47% (13.34 mg g-1) and 34.75% (13.9 mg g-1) respectively at a contact time of 240 minutes. Adsorption of Cr6+ recorded at 90%, (5.625 mg g-1) and 47.6%, (5.95 mg g-1) at the initial concentration of 25 and 50 mgL-1 and 24% (6.0 mg g-1), 18% (6.75 mg g-1) and 20.15% (10.08 mg g-1) for 100, 150 and 200 mg L-1 respectively at a contact time of 240 minutes. The decrease in the adsorption percentage of the metal ions from aqueous solutions and the increase in adsorption capacity as the initial concentration increased is in agreement with the literature.71 The 3D response surface pattern of adsorption of Fe2+ Pb2+ Zn2+ showed that their adsorption was rapid between 15 to 90 minutes and maintained a near-state adsorption equilibrium with no significant increase in adsorption till contact time of 240 minutes. Adsorption of Cr6+ ions increased rapidly up to 90 minutes and proceeded on a gradual increase to a contact time of 150 minutes to attain near state of equilibrium.
Effect of temperature
The effect of temperature in the range of 303 to 333 K was determined using the optimum pH of 4.5 for Pb2+, 5.0 for Fe2+ and Cr6+ and 6.0 for Zn2+, particle size of 63 μm for Pb2+ and Zn2+ and 75 μm for Fe2+ and Cr6+ ions, adsorbent concentration of 4.0 g L-1 for Cr6+ and 5.0 g L-1 for Fe2+, Zn2+ and Pb2+, agitation speed of 250 rpm for Fe2+ and Cr6+ and 300 rpm for Pb2+ and Zn2+ and initial metal ion concentration of 100 mg L-1. The average value of the metal ions obtained from AAS analysis was used to calculate the response (amount of metal ions adsorbed) for 63 experimental runs for each of the metals ions. From the results obtained (Figure 13), the adsorption of Fe2+ and Pb2+ increased with a maximum adsorption capacity of 53.7% (10.74 mg g-1) and 82.4% (16.48 mg g-1) at a contact time of 240 minutes as the temperature increased from 303 to 323 K. The maximum adsorption capacity for Zn2+ and Cr6+ recorded an increase as the temperature increased from 303 to 333 K, achieving 59.8% (11.96 mg g-1) and 35% (8.75 mg g-1) for Zn2+ and Cr6+ ions respectively at 240 minutes. An increase in temperature above 323 K, resulted in a decline in the uptake of both Fe2+ and Pb2+ ions. This observation was attributed to the desorption of the metal ions from the solid-liquid interface into the solution.72 The 3D graphs presented a pattern that shows a plateau which indicates low or no significant difference in the rate of adsorption in the temperature range of 318 to 328 K for Fe2+, 318 to 328 K for Pb2+ and 318 to 333 K for Zn2+ respectively. For Cr6+, the steep pattern signifies a rapid increase in the rate of adsorption on SK clay as the temperature was increased from 303 to 333 K. At the optimum temperature, the rate of adsorption of Fe2+ was rapid initial at contact time up to 90 minutes and then a slow steady increased as the contact time increased to 180 minutes where a near state adsorption equilibrium was attained. The uptake of Pb2+ and Zn2+ ions gradually increased as the contact time increased from 15 to 120 minutes. Contact time between 150 minutes to 240 minutes, recorded no significant increase in their adsorption.
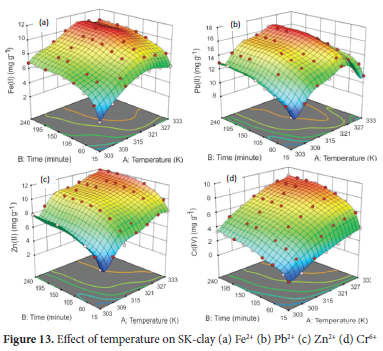
The rate of adsorption of Cr6+ions recorded a rapid increase up to the contact time of 90 minutes. Above the contact time of 90 minutes, recorded a low increase in uptake and the near state of equilibrium at 180 minutes with no further significant uptake till 240 minutes.
Adsorption of metal ions on ammonium carbonate treated clay (SK-AC)
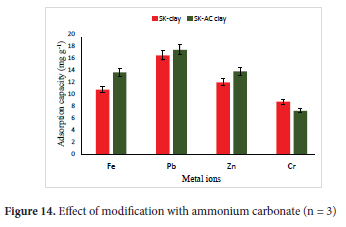
The optimum values of the experimental parameters obtained from the adsorption of the metal ions on SK clay were maintained at fixed values as follows: pH of 4.5 for Pb2+, 5.0 for Fe2+ and Cr6+ and 6.0 for Zn2+, particle size of 63 μm for Pb2+ and Zn2+ and 75 μm for Fe2+ and Cr6+ ions, adsorbent concentration of 4.0 g L-1 for Cr6+ and 5.0g L-1 for Fe2+, Zn2+ and Pb2+, agitation speed of 250 rpm for Fe2+ and Cr6+ and 300 rpm for Pb2+ and Zn2+, temperature of 328 K for Fe2+ and Pb2+ and 333 K for Zn2+ and Cr6+ and initial metal ion concentration of 100 mg L-1. The design of the experiments was done using Design-Expert Version 10 software based on one-factorial RSM; optimal (custom). Samples (5.0 mL) were withdrawn in triplicate (n = 3) using a syringe in the first 15 minutes and subsequently at time intervals of 30 minutes for 240 minutes. The average value of the metal ions obtained from AAS analysis was used to calculate the response (amount of metal ions adsorbed) for 9 experimental runs for each of the metals ions. The results for the optimum adsorption capacity for SK-AC in comparison with SK-clay are presented in Figure 14. The increase in adsorption observed after modification was from 53.7% (10.74 mg g-1) to 68% (13.6 mg g-1) for Fe2+ ions, 82.4% (16.48 mg g-1) to 86.9% (17.38 mg g-1) for Pb2+ ions and 59.8% (11.96 mg g-1) to 69% (13.8 mg g-1) for Zn2+ ions respectively after a contact time of 240 minutes. For the Cr6+ ions, a significant decrease in uptake from 35% (8.75 mg g-1) to 29.0% (7.25 mg g-1) was recorded at a contact time of 240 minutes. The high increase in adsorption capacity recorded with the SK-AC sample was attributed to the presence of calcite (4.13% of SK-AC) which resulted from the reaction of cowlesite present in SK clay with the ammonium carbonate. This observation was supported by the BET surface area and pore structure parameters of SK-AC clay. Calcite has been reported to be effective in the adsorption of heavy metals.73
Statistical analysis of data for measured responses
The statistical parameters obtained from analysis of variance (ANOVA) for adsorption of Fe2+, Pb2+, Zn2+ and Cr6+ ions on SK clay as a function of temperature and contact time (Section 3.2.6) are presented in Table 3. The experimental variables kept constant were optimum values of pH (4.5 for Pb2+, 5.0 for Fe2+ and Cr6+ and 6.0 for Zn2+), particle size values (63 μm for Pb2+ and Zn2+ and 75 μm for Fe2+ and Cr6+), adsorbent concentration (4.0 g L-1 for Cr6+ and 5.0 g L-1 for Fe2+, Zn2+ and Pb2+) and agitation speed (250 rpm for Fe2+ and Cr6+ and 300 rpm for Pb2+ and Zn2+) at initial metal ion concentration of 100 mg L-1.
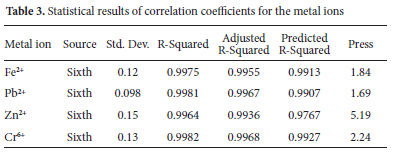
The polynomial equation in the sixth-degree model fits the response surface analysis of the metal ions adsorption. The observed R2 values (greater than 0.99) were in agreement with the predicted R2 and adjusted R2 values obtained for the metal ions with a difference of less than 0.2. These R2 values indicate that the model explained 0.99% of the variation in the original data and the experimental results perfectly fit the designs. The values for adequate precision, which measures the signal-to-noise ratio was 99.25, 112.012, 77.37 and 100.37 for Fe2+, Pb2+, Zn2+ and Cr6+ ions respectively. These values indicate sufficient signal for the model to navigate the design space. Signal-to-noise ratio value greater than 4 and an R2 above 0.8 are desirable for a good fit model.74 High F-values of 508.14, 699, 357.07 and 724.19 for Fe2+, Pb2+, Zn2+ and Cr6+ions, imply the model is significant for the adsorption of the metal ions at a 95% confidence level. The statistical p-values obtained were less than 0.05, indicating that the model terms are very significant.
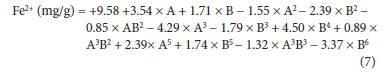
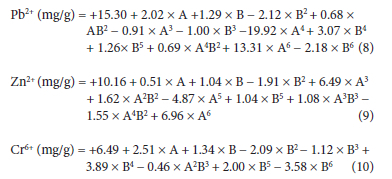
The empirical polynomial model equation (7-10) based on the response obtained for the significant terms of the 63 runs, A to B6 for the adsorption of the metal ions was used to fit the data. The interactive terms A and B are the coded level for temperature and time and this postulates the average result of changing one factor at a time from its low to high value. From the equations, the interactive terms showed how the response changed when the factors of temperature and time at optimum conditions of other variables were changed accordingly.
Kinetic modelling of adsorption data
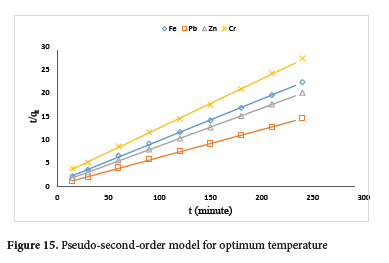
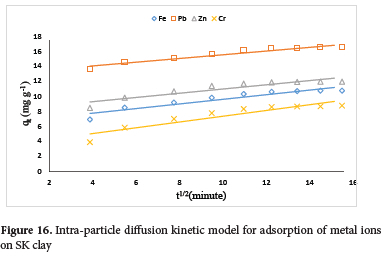
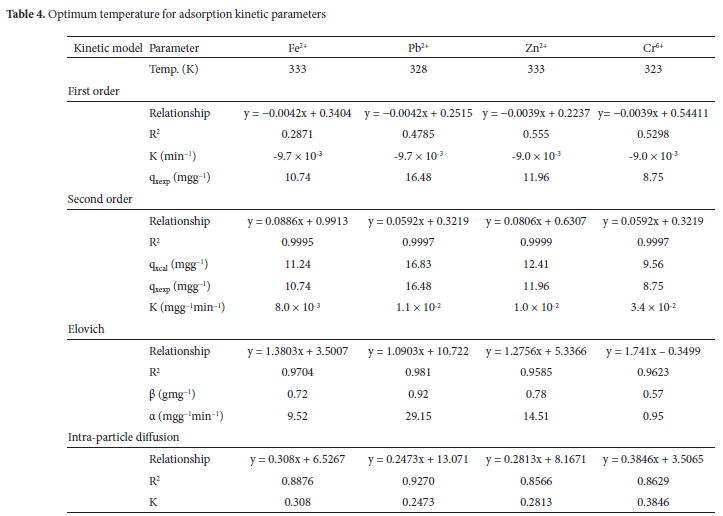
The adsorption data obtained from the effect of temperature were analysed using kinetic models including Pseudo first-order, Pseudo second-order, Elovich and Intra-particle diffusion (Figure S1-S4). The regression coefficient (R2) obtained, showed pseudo-second-order kinetic model best fit the adsorption data with R2 values greater than 0.999 for all the metal ions (Figure 15; Table 4). The experimental values obtained (qexp) show good agreement with the pseudo-second-order model predicted values (qcal). Data obtained from the Elovich kinetics model showed that Pb2+ ions recorded the highest desorption constant, β (0.92 g.min mg-1) and the highest rate of initial adsorption, α (29.15 g.min2 mg-1). The Plot for the intra-particle diffusion (Figure 16) is linear without passing through the origin. This is an indication that the rate-controlling step is particle diffusion and occurred simultaneously with film diffusion.75 From the results, the Pb2+ ion recorded the highest boundary layer thickness of 13.07.
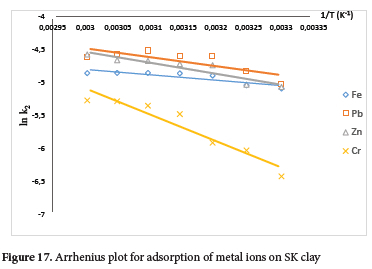
The activation energy (Ea) values for the metal ions were obtained from the slope of lnk2 against 1/T in the Arrhenius plot (Figure 17). And the Arrhenius data were obtained from the plot of the second-order rate constant (Figure S5). The activation energy values obtained were 6.79, 11.23, 13.82 and 33.21 kJ mol-1 for Fe2+, Pb2+, Zn2+ and Cr6+ ions respectively. These values which are less than 40 kJ mol-1, showed the mechanism of binding of the metal ions on the clay surface is physisorption.76
Isotherm modeling of the adsorption data
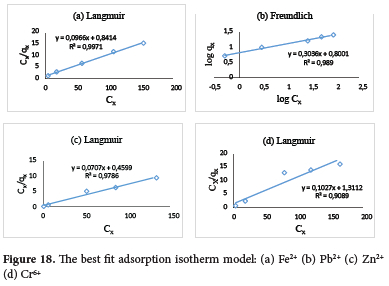
The adsorption equilibrium data obtained from the effect of initial metal ion concentration (section 3.2.5) for the metal ions were analysed using the following isotherm models: Langmuir, Freundlich, Temkin, Dubinin-Radushkevich (D-R) and Flory-Huggin (Figure S6-S10; Table S2). From the R2 values, the Langmuir isotherm model was found to best describe the adsorption process for Fe2+, Zn2+ and Cr6+ ions with R2 values of 0.9971, 0.9786, and 0.9089 respectively. While the Freundlich isotherm model fits the adsorption of Pb2+ with an R2 value of 0.9890 (Figure 18). From Langmuir isotherm model calculations, the monolayer adsorption capacity (Qn) for the metal ions is in the order of Pb2+ > Zn2+ > Fe2+ > Cr6+ with values of 24.94, 14.14, 10.35 and 9.74 mg g-1 respectively. The binding energy constant (b) is in the order of Zn2+ > Pb2+ > Fe2+ > Cr6+ with values of 0.15, 0.15, 0.12 and 0.07 dm3 mg-1 respectively. The Freundlich heterogeneity factor, 1/n for the metal ion are 0.50, 0.30, 0.75 and 0.095 for Fe2+, Pb2+, Zn2+ and Cr6+ respectively. The adsorption intensity was considered favourable as all 1/n values were less than 1. The KF relating to adsorption capacity calculated from the Freundlich isotherm equation was higher for Pb2+ ions, 6.31 (mg g-1)(dm3 g-1) than other metal ions and the decreasing order is Pb2+ > Zn2+ > Cr6+ > Fe2+. Calculations for the Temkin isotherm model show Cr6+ ion recorded the highest value for equilibrium binding constant, At (1343.43 L g-1), which corresponds to the maximum binding energy and bt, the constant related to the heat of adsorption (3191.40 J mol-1). Adsorption of Pb2+ ion recorded the lowest bt (625.94 J mol-1). The D-R theoretical saturated capacity (qm) value for the Pb2+ ion (16.95 mg g-1) was the highest. This corresponds to the high Qn value obtained from the Langmuir isotherm model. The mean free energy (E) values derived from the D-R constant, ß which defines the adsorption process were -15.68, -14.33, -14.36 and -15.32 kJ mol-1 for Fe2+, Pb2+, Zn2+ and Cr6+ ions respectively. This indicates that the adsorption process is spontaneous for all the metal ions.77
Determination of thermodynamic parameters
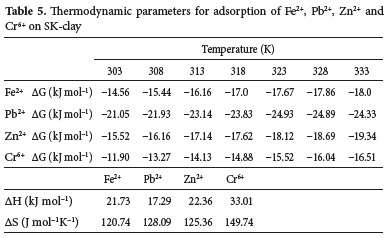
The AG values obtained for the metal ions were negative and this confirms their adsorption as spontaneous (feasible) in the following decreasing order of thermodynamic stability: Pb2+ > Zn2+ > Fe2+ > Cr6+ ions (Table 5). As the temperature increased from 303 to 333 K, AG values in the range of -14.56 to -18.0 kJ mol-1, -15.52 to -19.34 kJ mol-1 and -11.90 to -16.51 kJ mol-1 were obtained for Fe2+, Zn2+ and Cr6+ ions are respectively. The AG for Pb2+ ion ranged from -21.05 to -24.93 kJ mol-1 as the temperature increased from 303 to 323 K. Increase the temperature from 323 to 333 K, led to the value of AG becoming -24.33 kJ mol-1. This indicates that adsorption of Pb2+ is less favourable at temperatures above 323 K. Positive enthalpy (AH) values were obtained for all the metal ions and follows the decreasing order: Cr6+, 33.01 > Zn2+, 22.36 > Fe2+, 21.73 > Pb2+, 17.29 kJ mol-1. This shows that the adsorption of the metal ions was endothermic and their relatively lower values below 80 kJmol-1 suggest physisorption as the predominant mechanism. The AS value was positive for all the metal ions in the following decreasing order: Cr6+, 149.74 > Pb2+, 128.09 > Zn2+, 125.36 > Fe2+, 120.74 J mol-1 K-1. The results confirm their adsorption as entropy driven at the solid-liquid interface. Positive AS values for the adsorption of metal ions on kaolinite clay have been reported in the literature.77
CONCLUSION
This study has demonstrated that heavy metal ions adsorption capacity of kaolinite clay containing cowlesite mineral can be enhanced by treating it with ammonium carbonate. The ammonium carbonate decomposes leaving the carbonate ions to react with calcium ions in the cowlesite to form calcite. The formation of calcite-kaolinite improved the adsorption capacity of the clay. The optimum conditions of experimental parameters studied as functions of contact time for the adsorption of Fe2+, Pb2+, Zn2+, and Cr6+ ions on the natural clay were found to be as follows: pH (4.5 for Pb2+, 5.0 for Fe2+ and Cr6+ and 6.0 for Zn2+), particle size values (63 μm for Pb2+ and Zn2+ and 75 μm for Fe2+ and Cr6+), adsorbent concentration (4.0 g L-1 for Cr6+ and 5.0 g L-1 for Fe2+, Zn2+ and Pb2+), agitation speed (250 rpm for Fe2+ and Cr6+ and 300 rpm for Pb2+ and Zn2+) and temperature (328 K for Fe2+ and Pb2+ and 333 K for Zn2+ and Cr6+) at initial metal ion concentration of 100 mg L-1. The effect of contact time for all the parameters revealed that rapid adsorption of the metal ions takes place mostly in the first 60 to 90 minutes and then increased steadily to 120 or 150 minutes. Above these contact, time resulted in adsorption equilibrium with no further increase in the uptake of the metal ions. The application of the optimum conditions of the parameters on the ammonium-treated clay recorded an increase in adsorption of Fe2+, Pb2+and Zn2+ ions and a decrease in uptake of Cr6+ ions. The statistical analysis of the responses showed the significance of the parameters and their interaction with the adsorbed metal ions with p-values less than 0.005 and relatively high F-values at a 95% confidence level. The pseudo-second-order kinetic model best describes the binding mechanism of the metal ions on the adsorbent surface. The activation energy values were less than 40 kJ mol-1 and positive AH values of less than 80 kJ mol-1 showed the process is endothermic and suggested physisorption as the sole mechanism for the adsorption. The negative AG values obtained showed the adsorption of the metal ions is thermodynamically feasible. The relatively high positive AS values signified that the adsorption is entropy driven at the adsorbent-metal ions solutions interface. In conclusion, the present results indicate that the adsorption capacity of kaolin-containing cowlesite can be enhanced by treating it with ammonium carbonate.
ACKNOWLEDGEMENTS
The Department of Chemistry and Central Research Laboratory, University of Ilorin, Nigeria, are acknowledged for the provision of analytical grade reagents and Atomic Absorption Spectrophotometer for metal ions analysis.
CONFLICT OF INTEREST
The authors declared that there is no conflict of interests.
SUPPLENTARY MATERIAL
Supplementary information for this article is provided in the online supplement.
ORCID IDs
John A. Lawal: https://orcid.org/0000-0001-9433-3188
Ezekiel O. Odebunmi: https://orcid.org/0009-0000-5731-915X
Folahan A. Adekola: https://orcid.org/0000-0003-4411-669X
REFERENCES
1. Soares EV, Soares HMVM. Bioremediation of industrial effluents containing heavy metals using brewing cells of Saccharomyces cerevisiae as a green technology: a review. Environ Sci Poll Res. 2012;19:1066-1083. https://doi.org/10.1007/s11356-011-0671-5 [ Links ]
2. Kragovic M, Dakovic A, Markovic M, Krstic J, Gatta GD. Characterisation of lead sorption by the natural and Fe (III)- modified zeolite. Appl Surface Sci. 2013;283:764-774. https://doi.org/10.1016/j.apsusc.2013.07.016 [ Links ]
3. Lawal JA, Odebunmi EO, Adekola FA. Physicochemical analysis and heavy metal content of effluent discharge from a steel processing plant in Ilorin, Kwara State, Nigeria. Centrepoint J 2020a;26(1):67-78. [ Links ]
4. Chen G. Electrochemical technologies in wastewater treatment. Sep Purif Tech. 2004; 38(1): 11-41. https://doi.org/10.1016/j.seppur.2003.10.006 [ Links ]
5. Sarin P, Snoeyink VL, Bebee J, Jim KK, Beckett MA, Kriven WM, Clement JA. Iron release from corroded iron pipes in drinking water distribution systems. Water Res. 2004;38(5):1259-1269. https://doi.org/10.1016/j.watres.2003.11.022 [ Links ]
6. Jaishankar M, Tseten T, Anbalagan N, Mathew BB, Beeregowda KN. Toxicity, mechanism and health effects of some heavy metals. Interdiscip Toxicol. 2014;7(2):60-72. https://doi.org/10.2478%2Fintox-2014-0009 [ Links ]
7. Li J, Chen S, Sheng G, Hu J, Tan X, Wang X. Effect of surfactants on Pb(II) adsorption from aqueous solutions using oxidized multiwall carbon nanotubes. Chem Eng J. 2011;166(2):551-558. https://doi.org/10.1016/j.cej.2010.11.018 [ Links ]
8. Plum LM, Rink L, Haase H. The Essential Toxin: Impact of Zinc on Human Health. Int J Environ Res Pub Health. 2010;7(4):1342-1365. https://doi.org/10.3390%2Fijerph7041342 [ Links ]
9. Kounou GN, Nsami JN, Belibi DPB, Kouotou D, Tagne GM, Dina DD, Mbadcam JK. Adsorption of Zinc (II) ions from aqueous solution onto Kaolinite and Metakaolinite. Der Pharma Chemica. 2015;7(3):51-58. [ Links ]
10. Costa M. Toxicity and carcinogenicity of Cr(VI) in animal models and humans. Critical Rev Toxicol. 1997;27(5):431-442. https://doi.org/10.3109/10408449709078442 [ Links ]
11. Turan P, Dogan M, Alkan M. Uptake of trivalent chromium ions from aqueous solutions using kaolinite. J Hazard Mater. 2007;148:56-63. [ Links ]
12. Lawal JA, Anaun TE. An overview of characterization and treatment methods of wastewater from iron and steel industries. Achievers J Sci. 2022;4(1):152-163. [ Links ]
13. Wu R. Removal of heavy metal ions from industrial wastewater based on chemical precipitation method. Ekoloji. 2019;28(107):2443-2452. [ Links ]
14. Beni AA, Esmaeili A, Behjat Y. Invent of a simultaneous adsorption and separation process based on dynamic membrane for treatment Zn(II), Ni(II) and, Co(II) industrial wastewater. Arabian J Chem. 2021;14(7):103231. https://doi.org/10.1016/j.arabjc.2021.103231 [ Links ]
15. Thasneema KK, Dipin T, Thayyil MS, Sahu PK, Messali M, Rosalin T, Hadda TB. Removal of toxic heavy metals, phenolic compounds and textile dyes from industrial waste water using phosphonium based ionic liquids. J Molecular Liquids. 2021;323:114645. https://doi.org/10.1016/j.molliq.2020.114645 [ Links ]
16. Qimen A. Removal of chromium from wastewater by reverse osmosis. Russ. J. Phys. Chem. 2015;89:1238-1243. https://doi.org/10.1134/S0036024415070055 [ Links ]
17. Moosavirad SM, Sarikhani R, Shahsavani E, Mohammadi SZ. Removal of some heavy metals from inorganic industrial wastewaters by ion exchange method. J Water Chem Tech. 2015;37(4):191-199. https://doi.org/10.3103/s1063455x15040074 [ Links ]
18. Lawal JA, Odebunmi EO, Adekola FA. Adsorption of Heavy Metals from Steel Processing Effluent on Sodium Hydroxide Modified Nigerian Kaolinite. ChemSearch J. 2020;11(1):35-43. [ Links ]
19. Sinha SK, Sinha VK, Pandey SK, Tiwari A. A study on the wastewater treatment technology for steel industry: Recycle and Reuse. J Environ Res. 2014;3(4):309-315. [ Links ]
20. Rodriguez C, Briano S, Leiva E. Increased adsorption of heavy metal ions in multi-walled carbon nanotubes with improved dispersion stability. Molecules. 2020;25(14): 3106. https://doi.org/10.3390/molecules25143106 [ Links ]
21. Al-Malack MH, Basaleh AA. Adsorption of heavy metals using activated carbon produced from municipal organic solid waste. Desal Water Treat. 2016;57(51):24519-24531. https://doi.org/10.1080/19443994.2016.1144536 [ Links ]
22. Zhang Y, Yan K, Ji F, Zhang L. Enhanced removal of toxic heavy metals using swarming biohybrid adsorbents. Adv Funct Mater. 2018; 1806340. https://doi.org/10.1002/adfm.201806340 [ Links ]
23. Chai JB, Au PI, Mubarak NM, Khalid M, Ng WPQ, Jagadish P, Abdullah EC. Adsorption of heavy metal from industrial wastewater onto low-cost Malaysian kaolin clay-based adsorbent. Environmental Science and Pollution Research. 2020;27(12):13949-13962. https://doi.org/10.1007/s11356-020-07755-y [ Links ]
24. Zhu X, Zhu Z, Lei X, Yan C. Defects in structure as the sources of the surface charges of kaolinite. Appl Clay Sci. 2016;124-125:127-1363. https://doi.org/10.1016%2Fj.clay.2016.01.033 [ Links ]
25. Jiang M, Wang Q, Jin X, Chen Z. Removal of Pb(II) from aqueous solution using modified and unmodified kaolinite clay. J Hazard Mater. 2009;170(1):332-339. https://doi.org/10.1016/j.jhazmat.2009.04.092 [ Links ]
26. Koltsova TN. Zeolites of the Natrolite-Thomsonite Series. Inorg Mater. 2005;41(7):750-756. https://doi.org/10.1007/s10789-005-0203-0 [ Links ]
27. Huang P, Fuerstenau DW. The effect of the adsorption of lead and cadmium ions on the interfacial behaviour of quartz and talc. Colloidal Surf A: Physicochem Eng Aspects. 2001; 177(2-3):147-156. [ Links ]
28. Cave K, Talens-Alesson FI. Comparative effect of Mn(II) and Fe(III) as activators and inhibitors of the adsorption of other heavy metals on calcite: Colloid Surf A: Physicochem. Eng. Aspects. 2005;268(1-3):19-23. [ Links ]
29. Addadi L, Joester D, Nudelman F, Weiner S. Mollusk shell formation: a source of new concepts for understanding bio-mineralization processes. Chemistry: A Euro J. 2006;12:981-987. https://doi.org/10.1002/chem.200500980 [ Links ]
30. Du Y, Lian F, Zhu L. Biosorption of divalent Pb, Cd and Zn on aragonite and calcite mollusk shells. Environ Poll. 2011;159(7):1763-1768. https://doi.org/10.1016/j.envpol.2011.04.017 [ Links ]
31. Cheng X, Varona PL, Olszta MJ, Gower LB. Biomimetic synthesis of calcite films by a polymer-induced liquid-precursor (PILP) process. J Crystal Growth. 2007;307(2):395-404. https://doi.org/10.1016/j.jcrysgro.2007.07.006 [ Links ]
32. Belova DA, Lakshtanov LZ, Carneiro JF, Stipp SLS. Nickel adsorption on chalk and calcite. J Contamin Hydrology. 2014;170:1-9. https://doi.org/10.1016/j.jconhyd.2014.09.007 [ Links ]
33. Wang S, Feng Q, Javadpour F, Yang YB. Breakdown of mast mass transport of methane through calcite nanopores. The J. Physic Chem C. 2016;120(26):14260-14269. https://doi.org/10.1021/acs.jpcc.6b05511 [ Links ]
34. Adekola FA, Abdus-Salam N, Adegoke HI, Adesola AM, Adekeye JID. Removal of Pb(II) from aqueous solution by natural and synthetic calcites. Bull Chemi Soc Ethiopia. 2012;26(2):195-210. [ Links ]
35. Rangel-Porras G, Garcia-Magno JB, Gonzalez-Munoz MP. Lead and cadmium immobilization on calcitic limestone materials. Desalination. 2010;262:1-10. https://doi.org/10.1016/j.desal.2010.04.043 [ Links ]
36. Lawal JA, Odebunmi EO, Adekola FA. Adsorption of Fe(II), Pb(II), Zn(II) and Cr(VI) ions from aqueous solutions using natural, ammonium oxalate and sodium hydroxide modified kaolinite clay. Ife J Sci. 2020c;22(3):1-23. https://doi.org/10.4314/ijs.v22i3.1 [ Links ]
37. Makela M. Experimental design and response surface methodology in energy applications: A tutorial review. Energy Conversion Manag. 2017;151:630-640. https://doi.org/10.1016/j.enconman.2017.09.021 [ Links ]
38. Ucurum M. A study of removal ofPb heavy metal ions from aqueous solution using lignite and a new cheap adsorbent (lignite washing plant tailings). Fuel. 2009;88:1460-1465. https://doi.org/10.1016/j.fuel.2009.02.034 [ Links ]
39. Bernard E, Jimoh A, Odigure JO. Heavy metal removal from industrial wastewater by activated carbon prepared from Coconut shell. Res J Chem Sci. 2013;3(8):3-9. [ Links ]
40. Ho YS. Citation review of Lagergren kinetic rate equation on adsorption reactions. Scientometric. 2004;59:171-177. https://doi.org/10.1023/B:SCIE.0000013305.99473.cf [ Links ]
41. Erto A, Andreozzi R, Di-Natalea F, Lancia A, Musmarra D. Experimental and statistical analysis of trichloroethylene adsorption onto activated carbon. Chem Eng J. 2010;156:353-359. https://doi.org/10.1016/j.cej.2009.10.034 [ Links ]
42. Mahmoud MA. Kinetics and thermodynamics of aluminum oxide nano powder as adsorbent for Fe (III) from aqueous solution. Beni-Suef University J Basic Appl Sci. 2015;4(2):142-149. https://doi.org/10.1016/j.bjbas.2015.05.008 [ Links ]
43. Nethaji S, Sivasamy A, Mandal AB. Adsorption isotherms, kinetics and mechanism for the adsorption of cationic and anionic dyes onto carbonaceous particles prepared from Juglans regia shell biomass. Int J Environ Sci Technol. 2013;10:231-242. https://doi.org/10.1007/s13762-012-0112-0 [ Links ]
44. Anastopoulos I, Kyzas GZ. Are the thermodynamic parameters correctly estimated in liquid-phase adsorption phenomena? J Molecular Liquids. 2016;218:174-185. https://doi.org/10.1016%2Fj.molliq.2016.02.059 [ Links ]
45. Zhou X Zhou X. The unit problem in the thermodynamic calculation of adsorption using the Langmuir equation. Chem Eng Comm. 2014;201:1459-1467. https://doi.org/10.1080/00986445.2013.818541 [ Links ]
46. Panda AK, Mishra BG, Mishra DK, Singh RK. Effect of sulphuric acid treatment on the Physico-chemical characteristics of kaolin clay. Coll Surf A: Physicochem Eng Aspects. 2010;363(1-3):98-104. https://doi.org/10.1016/j.colsurfa.2010.04.022 [ Links ]
47. Sutcu M, Akkurt S. Utilization of recycled paper processing residues and clay of different sources for the production of porous anorthite ceramics. J Euro Ceramic Soc. 2010;30(8):1785-1793. https://doi.org/10.1016/j.jeurceramsoc.2010.01.038 [ Links ]
48. Vezzalini G, Artioli G, Quartieri S, Foy H. The crystal chemistry of cowlesite. Mineralogical Mag. 1992;56(385):575-579. [ Links ]
49. Rautary D, Sinha K, Shankar SS, Adyanthaya SD, Sastry M. Aqueous foams as templates for the synthesis of calcite crystal assemblies of spherical morphology. Chem Mater. 2004;16(7):1356-1361. https://doi.org/10.1021/cm035182l [ Links ]
50. Lu C, Qi L, Cong H, Wang X, Yang J, Yang L, Cao W. Synthesis of calcite single crystals with porous surface by templating of polymer latex particles. Chem Mater. 2005;17(20):5218-5224. https://doi.org/10.1021/CM0513029 [ Links ]
51. Forbes TZ, Radha AV, Navrotsky A. The energetics of nanophase calcite. Geochimica et Cosmochimica Acta. 2011;75(24):7893-7905. https://doi.org/10.1016/j.gca.2011.09.034 [ Links ]
52. Villarroel-Rocha J, Barrera D, Sapag K. Introducing a self-consistent test and the corresponding modification in the Barrett, Joyner and Halenda method for pore-size determination. Microporous and Mesoporous Mater. 2014;200:68-78. [ Links ]
53. Li J, Zhou S, Li Y, Ma Y, Yang Y, Li C. Effect of organic matter on pore structure of mature lacustrine organic-rich shale: A case study of the Triassic Yanchang shale, Ordos Basin, China. Fuel, 2016;185:421-431. [ Links ]
54. Lawal JA, Odeyemi OT, Anaun TE, Omotehinwa FH. Characterisation and potential industrial applications of kaolinite from Argungu, Kebbi State, Nigeria. Int J Scientific Eng Res. 2022;13(4):776-791. [ Links ]
55. Abukhadra MR, Bakry BM, Adlii A, Yakout SM, El-Zaidy ME. Facile conversion of kaolinite into clay nanotubes (KNTs) of enhanced adsorption properties for toxic heavy metals (Zn2+, Cd2+, Pb2+, and Cr6+) from water. J Hazard Mater. 2019;374:296-308. https://doi.org/10.1016/j.jhazmat.2019.04.047 [ Links ]
56. Vaculikova L, Plevova E. Identification of clay minerals and micas in sedimentary rocks. Acta Geodyn Geomater. 2005;2(2):163-171. [ Links ]
57. Fan Y, Zhang C, Wu J, Zhan J, Yang P. Composition and morphology of complicated copper oxalate powder. Transact Nonferrous Metals Soc China. 2010;20:165-170. https://doi.org/10.1016/S1003-6326%2809%2960115-1 [ Links ]
58. Al-Ghouti M, Khraisheh MAM, Ahmad MNM, Allen S. Thermodynamic behavior and the effect of temperature on the removal of dyes from aqueous solution using modified diatomite: A kinetic study. J Colloid Interface Sci. 2005;287:6-13. https://doi.org/10.1016/j.jcis.2005.02.002 [ Links ]
59. Rajkumar K, Ramanathan A, Behera N. Characterisation of clay minerals in the Sundarban mangroves River sediments by SEM/EDS. J Geological Soc India. 2012;80:429-434. [ Links ]
60. Folorunsho DO, Olubambi P, Borode JO. Characterisation and qualitative analysis of some Nigerian clay deposits for refractory applications. J Appl Chem. 2014;7(9):40-47. https://doi.org/10.9790/5736-7914047 [ Links ]
61. Taha GM. Utilization of low-cost waste material Bagasse fly ash in removing of Cu2+, Ni 2+, Zn2+ and Cr3 + from industrial waste water. Ground water monitor Remed. 2006;26(4):137-141. https://doi.org/10.1111/j.1745-6592.2006.00120.x [ Links ]
62. Cheng TW, Lee ML, Ko SM, Ueng TH, Yang SF. The heavy metal adsorption characteristics on metakaolin-base geopolymer. Appl Clay Sci. 2012;56:90-96. https://doi.org/10.1016/j.clay.2011.11.027 [ Links ]
63. Chai W, Huang Y, Su S, Han G, Liu J, Yijun CAO. Adsorption behavior of Zn(II) onto natural minerals in wastewater. A comparative study ofbentonite and kaolinite. Physicochem Probl Mineral Process. 2017;53(1):264v279. https://doi.org/10.5277/ppmp170122 [ Links ]
64. Bhattacharyya KG, Gupta SS. Adsorption of a few heavy metals on natural and modified kaolinite and montmorillonite: A review. Adv Colloid Interface Sci. 2008;140:114-131. https://doi.org/10.1016/jxis.2007.12.008 [ Links ]
65. Mnasri-Ghnimi S, Frini-Srasra N. Removal of heavy metals from aqueous solutions by adsorption using single and mixed pillared clays. Appl Clay Sci. 2019;179:105-151. https://doi.org/10.1016/jxlay.2019.105151 [ Links ]
66. Bhattacharyya KG, Gupta SS. Adsorption of Chromium (VI) from water by clays. Industrial Eng Chem Res. 2006;45:7232-7240. https://doi.org/10.1021/ie060586j [ Links ]
67. Dawodu FA, Akpomie KG. Simultaneous adsorption of Ni(II) and Mn(II) ions from aqueous solution unto a Nigerian kaolinite clay. J Mater Res. Technol. 2014;3(2):129-141. https://doi.org/10.1016/j.jmrt.2014.03.002 [ Links ]
68. Das B, Mondal NK. Bhaumik R, Roy P. Insight into adsorption equilibrium, kinetics and thermodynamics of lead onto alluvial soil. Int J Environ Sci. Technol. 2014;11:1101-1114. https://doi.org/10.1007/s13762-013-0279-z [ Links ]
69. Bingol D, Canbazoglu M, Aydogan S. Dissolution kinetics of malachite in ammonia/ammonium carbonate leaching. Hydrometallurgy. 2005;76:55-62. https://doi.org/10.1016/j.hydromet.2004.09.006 [ Links ]
70. Adebowale KO, Unuabonah EI, Olu-Owola BI. Kinetics and thermodynamic aspects of the adsorption of Pb2+ and Cd2+ ions on tripolyphosphate-modified kaolinite clay. Chem Eng J. 2008;136:99-107. https://doi.org/10.1016/j.cej.2007.03.012 [ Links ]
71. Sari A, Tuzen M, Citak D, Soylak M. Equilibrium, kinetic and thermodynamic studies of adsorption of Pb(II) from aqueous solution onto Turkish kaolinite clay. J Hazard Mater. 2007; 149(2):283-291. https://doi.org/10.1016/j.clay.2013.12.021 [ Links ]
72. Rangel-Porras G, Garcia-Magno JB, Gonzalez-Munoz MP. Lead and cadmium immobilization on calcitic limestone materials. Desalination. 2010;262:1-10. https://doi.org/10.1016/j.desal.2010.04.043 [ Links ]
73. Du Y, Lian F, Zhu L. Biosorption of divalent Pb, Cd and Zn on aragonite and calcite mollusk shells. Environ Pollut. 2011;159(7):1763-1768. https://doi.org/10.1016/j.envpol.2011.04.017 [ Links ]
74. Kalantari K, Ahmad M.B, Fard-Masoumi HR, Shameli K, Basri M, Khandanlou R. Rapid and high-capacity adsorption of heavy metals by Fe3O4/montmorillonite nanocomposite using response surface methodology: Preparation, characterisation, optimization, equilibrium isotherms, and adsorption kinetics study. J Taiwan Instit Chem Eng. 2014;49:192-198. https://doi.org/10.1016/j.jtice.2014.10.025 [ Links ]
75. Sen TK, Gomez D. Adsorption of zinc (Zn2+) from aqueous solution on natural bentonite. Desalination. 2011;267:286-294. https://doi.org/10.1016/j.desal.2010.09.041 [ Links ]
76. Inglezakis VJ, Zorpas AA. Heat of adsorption, adsorption energy and activation energy in adsorption and ion exchange systems. Desalination Water Treat. 2012;39(1-3):149-157. https://doi.org/10.1080/19443994.2012.669169 [ Links ]
77. Li Y, Yue QY, Gao BY. Effect of humic acid on the Cr(VI) adsorption onto kaolin. Applied Clay Science, 2010;48(3):481-484. https://doi.org/10.1016%2Fj.clay.2010.02.010 [ Links ]
Received 07 October 2022
Revised 29 March 2023
Accepted 02 May 2023
* To whom correspondence should be addressed Email: lawal.ja@achievers.edu.ng

