


Services on Demand
Article
 English (pdf)
 Article in xml format
 Article references
Indicators

Related links
-
 Cited by Google
 -
 Similars in Google
Share

 Permalink
South African Journal of Chemistry
On-line version ISSN 1996-840X
Print version ISSN 0379-4350
S.Afr.j.chem. (Online) vol.76 Durban 2022
http://dx.doi.org/10.17159/0379-4350/2021/v76a13
RESEARCH ARTICLE
Thermally regulated green living wall
Shawn GouwsI,*; Melissa GouwsII
IDepartment of Chemistry, Nelson Mandela University, Gqeberha, South Africa
IIInnoVenton, Nelson Mandela University, Gqeberha, South Africa
ABSTRACT
Green living walls can improve the aesthetic quality of a building and moderate the temperature within it. The purpose of this paper is to examine whether the green wall has any effect on the interior temperature of the building in the hot and cold months of the year. Temperatures on an outside wall as well as on research and control areas were monitored to capture temperature data for a one-year period that encompassed all seasons: sunny, cold and wet. The findings of this research contribute to the knowledge of the effects provided by green living walls in terms of cooling and heating, the influence on the proximity microclimatic conditions, and overall energy transfer. Heat flux of 20-100 W/m2 was found indicating an insulating effect that brings about cooling in the interior of the building. During summer months a cooling effect of 2-4 °C was observed, while the opposite effect was observed during winter in that the temperatures did not drop by much but provide a insulating effect of 2-3 °C higher than it was for the control area. Altogether, green living walls could be implemented to reduce and insulating interior living conditions and therefore reduce building energy demands.
Keywords: energy performance; energy saving; green living wall; heat flux; indoor-outdoor analysis temperature measurements
INTRODUCTION
Vertical green walls are classified in two groups: green facades where climbing plants are grown in soil at the base of the wall and living walls in which plants are grown in containers fixed to the wall. In this paper we will discuss our findings on green living wall facades.
Energy efficiency on buildings through green living walls can be an effective strategy to cool interiors in the summer and insulate in the winter.1 2 3 Much literature has demonstrated that the use of green living walls can reduce the heat effect on bare walls,4, 5 6 and improve thermal comfort inside the building.7, 8 Green living walls can also control air-pollution through filtration.9 Green living walls10 can also improve the aesthetic quality of a building and provide a possibly better cooling solution to the interior of the building than conventional cooling systems.9
Green living walls could be, both directly and indirectly installed, with vegetation that can effectively insulate and cool the building skin temperature to regulate interior cooling.10, 11, 12, 13 Direct green living walls are those where the plants grow directly on the wall, for example, a creeper like ivy; indirect green living wall14, 15 are those where the plants are planted near the wall and allowed to creep on a man-made structure. In the case of living wall systems,16 vegetation is grown in containers that adhere to the exterior walls of buildings.3 Living wall systems can improve the thermal efficiency of wall construction by offering extra thermal resistance to the exterior wall.17
The most important effect provided by green walls is shading the building, which is a clear benefit during the summer months.18, 19 Green walls can add benefits to energy performance and microclimate mitigation in urban areas,20, 21 and green living walls improve indoor comfort by regulating the temperature,22, 23 so reducing energy needs. The other important benefits of using green living wall applications are economic, social, and environmental in that they reduce greenhouse gases,24, 25 improve air quality,26 save energy through insulation,27 and enhance the overall architecture of the buildings. Living green wall systems can provide personal and social benefits in urban areas.3 The cost-benefit analysis has shown that, once the initial installation cost has been met, vertical walls can be sustained easily through maintenance and proper irrigation.11, 3
The research aimed to 1) study the technical feasibility of the potential manufacturing of the wall tile; 2) develop a formula for mixing ingredients to produce a wall tile of strength, weight (to adhere to the wall), and visual appeal (monotone, no white or yellow marks); 3) fix these tiles in a suitable position facing full sun; 4) plant in the cups suitable plants that could adapt to a small environment and be waterwise, but provide a could cooling effect once grown; 5) place thermocouples around the outside wall of research, inside in the research room and in the control room; 6) monitor the temperature over a one-year period that included data from all four seasons; 7) interpret and calculate the heat flux for a summer month and winter month to observe the cooling or insulating effect over time.
MATERIALS AND METHODS
The case study was performed in the city of Gqeberha (Port Elizabeth) at Nelson Mandela University, situated at latitude 34.00° S, and longitude 25.671° E. A back building consisting of a storage area adjacent to an open office area of approximately 12 m2 each was utilized. The tiles were fixed to the north-facing wall for the best solar energy absorption.
The aim of this research was to determine the temperature heat flux 28, 29 observed on a living vertical wall and the cooling or isolating effect inside the building. This was achieved by connecting various thermocouples to the outside surface of the wall where the tiles containing the plants were situated. A thermocouple measuring device was placed inside the building connected to the green wall tiles, and a further thermocouple measuring device was placed in a control area adjacent to the test room where the outside wall was only plastered. These temperature measurements provided the data to draw profiles on a monthly basis for the full period of the year, showing the heat flux over summer and winter seasons.
The research described in this paper will deal with the production of wall tiles designed to contain plants by studying the components in various mixtures to determine strength and endurance of a wall tile equipped with a cup-like fixture to hold a plant. Once the flexure strength test reveals the correct components necessary to produce the wall tiles, the tiles are fitted to an outer wall. Plants are planted in the cups and thermocouples fitted to measure temperature.
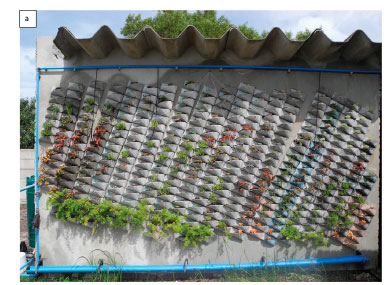
The wall tile is a robust, vertical garden tile with a cup to hold soil and plants. Like a normal wall tile, they have a flat surface at the back to adhere to a cemented wall. A test wall was prepared to test the thermal effect of green living wall. Plants chosen for this project because of their hardiness and adaptability in a coastal environment were Echeveria prolifia, Echeveria secunda, Sedeveria hummelii, Crassula muscosa, and Crassula pudescens. The Crassula plants provide a very pleasing hanging effect and additional cooling.
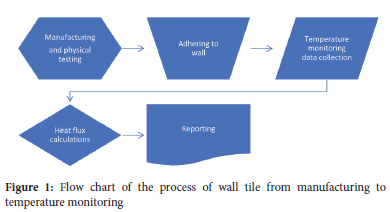
The wall tile was manufactured from cement, sand, a plasticizer, and calcium chloride. The normal cement-sand combinations were used and combined with the plasticizer and calcium chloride. The plasticizer provides extra strength to the final tile product and the calcium chloride hardens the cement and assists in a quicker curing process. Figure 1 shows a flow chart of the process that was followed in realizing this project.
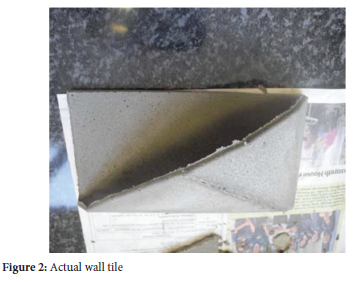
The basic cement formula for one tile was as follows: cement 200 g, sand 200 g, calcium chloride 10 g, PVC glue 45 mL, and water 75 mL. The mixture was mixed well together and poured into specially made mould and left overnight to dry. The tiles weigh on average about 500 g. The tile dimensions on the flat surface (96 x 197 mm) with a cup cavity of 200 mL. The drainage between tiles was through a small orifice at the tip of the cup to form a dripping point for water into the next tile. Figure 2 picture of the actual tile.
After the curing process, rectangular test samples were selected and sent for flexure strength testing (Hounsfield, Serial Nr: 0199, China) to determine the strength and breaking point of the cement formula. In this test, a rectangular or flat cross-section of the specimen was placed on two parallel supporting pins. The loading force was applied in the middle by means of a loading pin. The supporting and loading pins were mounted in a way that allowed their free rotation about the following:
• axis parallel to the pin axis
• axis parallel to the specimen axis
This configuration provided uniform loading of the specimen and prevented friction between the specimen and the supporting pins (Figure 3).
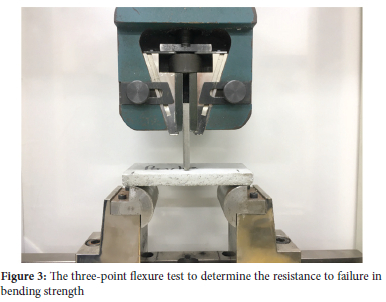
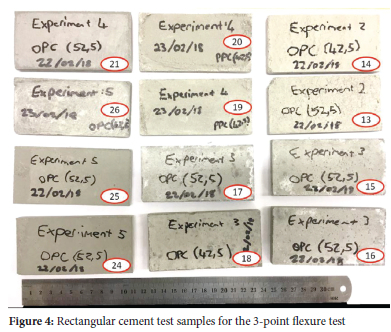
Figure 4 shows the rectangular cement tiles that were made for the 3-point flexure strength testing. The sample area dimensions for rectangular ceramic tile for the flexure study were: length, width, height = 110 x 55 x 10 mm
The cement cup tiles were prepared in-house from Portland cement (strength 42.5 and 52.5 N), a plasticizer (to provide strength and elasticity), calcium carbonate (to harden the cement), sand and water. After thorough mixing, this mixture was cast into molds and cured for 10-12 hours.. Table 1 summarizes the results obtained from the flexure testing.
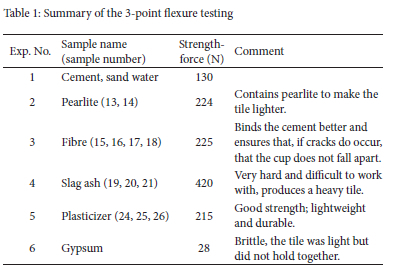
Batch samples 3 and 5 in Table 2 were chosen for the green wall façade, based on their strength consistency over 200 N and their light weight to adhere to the wall.
The test wall was plastered to ensure a smooth surface for fixing the wall tiles. The walls were 3 m in height and 6 m in width. The tiles covered 6 m2 area and were fixed to the wall using a tile adhesive. Four LogTag30 thermocouples (Model: Trel-8, -80 oC to 40 oC, ST10 type sensor, China) were placed strategically on the wall and in the flower cavities of the tile to measure the temperature on a 24-hour cycle for 12 months. The readings were recorded over a monthly period and downloaded using LogTag analyzer 3 software to analyse and construct temperature profiles. A LogTag device with an internal sensor was placed in the research area and one in a control environment to measure the temperature inside the buildings.
The tiles were fixed to the north-facing wall for the best solar energy absorption. This provided good sunlight throughout the day so that the plants (Echeveria prolifia, Echeveria secunda, Sedeveria hummelii, Crassula muscosa, and Crassula pudescens) could grow in good sunny conditions. All the plants in the cups were irrigated for 20 min twice a day (early morning and late afternoon) at a pump rate of 1.0 m3/h to ensure good growth. Around 300 L per session was dispenced over the 6 m2 as fine mist spray. The plants chosen were of hardy nature but if plants died, they were replaced. These plants did not need pruning but were planted in groups to form an aesthetic picture on the wall surface.
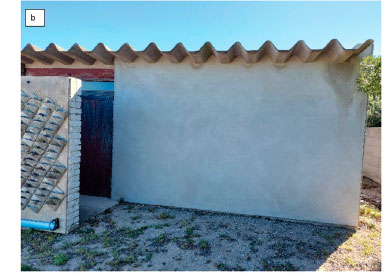
Since this is a coastal city, there is a fair amount of humidity during the spring and summer months. The winters are not severe, although cold nights of 0-2 °C have been reported. Generally, the experiments were conducted under different temperature and humidity conditions to determine the impact of green façades on thermal regulation. Figure 4a shows the thermocouple points from where the measurements for the temperature study were taken. The sensors were place in random around the testing area to ensure the maximum data was captured. The lower thermo couples were placed 1 m above ground level and the upper thermocouples 1m below the roof tiles to ensure we measured the solar effect of the sun on the green living wall. Figure 4b shows the control testing room wall, and Figure 4c shows diagrams (not to scale) of the two adjacent rooms, illustrating the position of the thermocouples on the outside testing area and the sensors inside in the research and the control room were place on a table near the outside wall. This was to capture the interior wall temperature needed for the calculation of the heat flux.
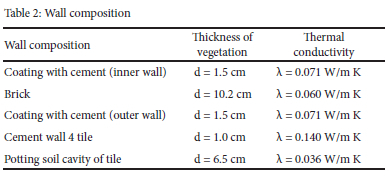
The insulation of the green wall is provided by different layers of air cavities formed between the leaves of the plants and the tile-cup cavity of the tiles. The temperature is further reduced as the heat moves through the tile-adhesive-plaster and then finally through the brick wall to the interior of the building. This thermal conductivity was measured by placing various thermocouples on the outside and inside walls. In general, the parameters for the insulation materials are expressed in U, R or \ values. These parameters are related by the following expression:
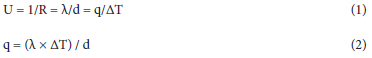
where U is the heat transfer coefficient (1) (W/m2 K), R is the heat resistance coefficient (m2 K/W), \ is the thermal conductivity (W/m K), d the thickness of the vegetation (m), q is the heat flux (2) (W/m2), and AT is the temperature difference between the outside green wall and the research or control area (K). Table 1 provides information on the wall composition used to fix the wall tile on for this research study.
Heat flux is determined from the sum of the thermal conductivity as per Table 2 multiplied by the temperature difference observed between the outside measurement and the interior measurement divided by the sum of the thickness of the plant material, tile, wall exterior plaster, brick and interior plastered wall.
Green living walls need regular watering hence a reliable irrigation system needs to be installed to ensure that timeous watering is performed through a timer-controlled irrigation system. The timer was set to water the wall for 25 minutes twice daily, once in the morning and once in the evening to ensure that a good dose of water was provided. Green wall monitoring was performed by the insertion of four thermocouples as illustrated in Figure 5c to measure the temperature on the green living wall at various positions, top left (T1), left bottom (T2), top right (T3), and right bottom (T4) directly outside the research area. One thermocouple was placed in the research test area and one thermocouple was placed in the control area.

RESULTS AND DISCUSSION
The temperature at this coastal city in South Africa fluctuates between 2-15 °C during the winter months and 18-32 °C during the summer months. The solar radiation in Gqeberha (South Africa) varies between 230 and 950 W/m2, depending on the weather.
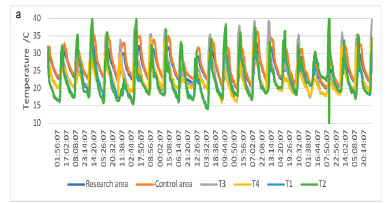
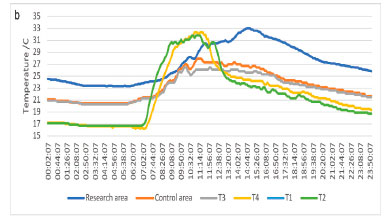
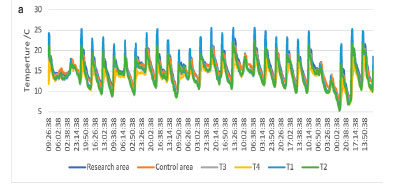
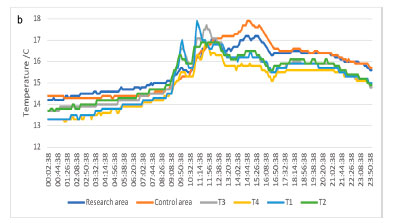
Figure 6a shows a period of one month (December 2018). The temperature profile taken directly from the LogTag Analyzer 3 software shows temperature fluctuations of the thermocouples on the outside façade at various positions, as previously indicated in Figure 5c, as well as the temperatures measured inside the buildings in the research area and the other in an adjacent room that indicates the control or benchmark temperature that is anticipated without the cooling effect of the green wall façade. Figure 6b shows an expanded view of a section of a day to illustrate the temperatures observed between these respective thermocouple positions. A significant difference of 2-5 °C between the thermocouple inside the research area and those on the outside is evident. Another significant difference was observed between the research and the control environment. This confirms that the possibility exists of cooling down the interior of the building by placing a green façade of living plants on the outside to absorb the heat and provide a cooling effect inside.30
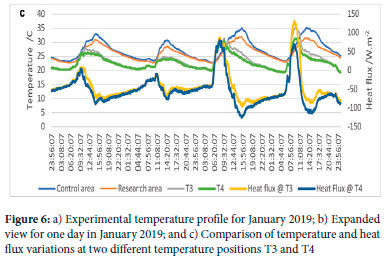
Heat flux (q) can be defined as the rate of heat energy transferred through a given surface (W); heat flux density (9) is the heat flux per area (W/m2). This measurement can be useful in determining the amount of heat that passes through the wall or the amount of solar energy transferred to a given area.17 When water evaporates from a surface, a negative latent heat flux is evident, while a positive sensible heat flux means heat flows from the atmosphere to the surface. In Figure 6c, the heat flux is plotted against two days of measurement during the summer month of January 2019. A positive heat flux of 20-100 Wm2 was observed, indicating solar energy flowing from the atmosphere to the green façade. However, once it penetrated the green living wall, the heat flux was reduced to almost 0-10 W/m2 , indicating that a cooling effect occurred and hence a drop in temperature between the outside wall and the interior of 2-4 °C. This indicates an insulator effect that resulted in a cooler interior.
During the winter months, the opposite effect was observed: the green façade living wall acted as an insulator, absorbing the solar rays of the sun, resulting in a warmer interior. The day temperatures on the outer green façade increased 12-25 °C while the night temperature fell to between 0-3 °C. The temperature and an expanded view of a winter profile are shown in Figures 7a and b below. A maximum interior temperature of 20 °C was observed in the research area compared to the control area where the temperature measured was 18 °C or below.
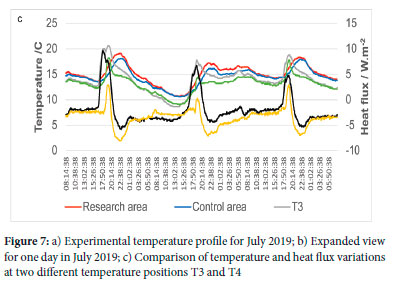
The heat flux calculated for this period was considerably lower than that in summer, with a heat flux range of 4-6 W/m2 which implies that no heating or cooling penetrated the wall, and the insulated green wall provided a warmer interior. Figure 6c shows the graphs obtained for the heat flux observed during a winter month.
Figure 8 shows the temperature fluctuations observed during the summer and winter months and their deviation from the control. The average bar graph for the summer temperatures shows a temperature variance of 0-8 °C compared to the winter months, with an average temperature fluctuation between 0-4 °C. These fluctuations are due to the absorption of the solar energy on the exterior wall, providing a cooling or insulating effect to the interior.
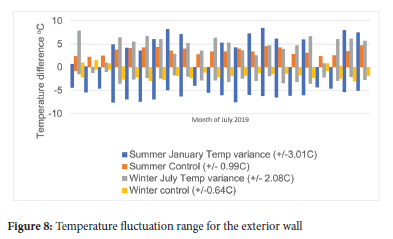
Thermal insulation on green walls proved to act as an all-season insulator, with a minimum heat loss during winter and a positive reduction in heat, leading to a cooling effect, in the summer months.
CONCLUSIONS
his paper presents part of an experimental work performed on a green living wall. For this project, various cement mixtures were prepared containing cement, sand, and water as a benchmark. Other materials were added, such as titanium oxide for a white tile, calcium chloride to harden the tile, fibre and slag-ash to enhance strength and durability. Plasticizers provided some elasticity and better mixture bonding.
The three-point flexure test provided substantial evidence of which cement mixture would be more than adequate and would have the desired strength and porosity to be used in the wall cup-tile manufacturing process. Strengths of over 200 N force were considered and two mixtures, one containing the plasticizer and the other a fibrous material, were used in the casting process. Once enough of these tiles were manufactured, they were then fixed to the research wall façade and equipped with suitable plants and irrigation, as described above. Four thermocouples were installed on the outside of the green living wall, one thermocouple was placed in the research area and one thermocouple was placed in an adjacent control room. The temperatures were measured and captured by means of LogTags for 30 days over a period of one year. The temperature profiles showed a significant decrease in temperature between the outside wall surface and the interior wall of 2-6 °C compared to the control area, during the summer months. This temperature difference observed in terms of heat loss measured as heat flux, gave an energy loss value of 3-8 W/m2 per day, indicating that evaporation occurred through the green living wall and provided a cooling effect inside.
During the winter months the smaller evaporation heat loss of 0.5-2.5 W/m2 per day resulted in a warmer interior, proving that the green living wall acted as a thermal insulator. The data are valuable; the cup-tiles, used on large surfaces, can be decorative and provide both a cooling or heating effect that can be beneficial as green thermal energy rather than conventional heating or cooling systems. Further research could be done to perform more detailed temperature monitoring systems to have a better and deeper understanding about the different heat flux variations such as latent heat (evaporation heat flux) in comparison to sensible heat (radiation and convection heat flux) on the wall surface and through the wall dimensions.
ACKNOWLEDGEMENTS
The authors would like to thank InnoVenton staff for their support during this project. Thank you to Amy van Gend (eNtsa, Nelson Mandela University) for the 3-point flexure analysis, and the Technology Innovation Agency (TIA) for financial support to carry out this research project.
SUPPORTING INFORMATION
Data availability
Supplementary information for this article is provided in the online supplement. All data generated or analyzed during this study are included in this published article.
Symbols and abbreviations
A area of measured wall (m2)
d overall thickness of the tile and brick (m)
d1 thickness of coating with cement (inner wall) (m)
d2 thickness of layer of brick (m)
d3 thickness of coating with cement (outer wall) (m)
d4 thickness of cement wall tile (m)
d5 thickness of potting soil cavity of tile (m)
λ1 thermal conductivity of coating with cement (inner wall) (W/m K)
λ2 thermal conductivity of layer of brick (W/m K)
λ3 thermal conductivity of coating with cement (outer wall) (W/m K)
λ4 thermal conductivity of cement wall tile (W/m K)
λ5 thermal conductivity of potting soil cavity of tile (W/m K)
q heat flux (W/m2)
R heat resistance coefficient (m2 K/W)
T absolute temperature (K)
U heat transfer coefficient (W/m2 K)
ΔT temperature difference (°C)
φ heat flux per area (W/m2)
DISCLOSURE STATEMENT
The authors report there are no competing interests to declare.
AUTHOR CONTRIBUTIONS
SG: Conceptualization, Methodology, Software, Original draft preparation, Supervision.
MG: Data capture, Monitoring and Reporting, Validation, Reviewing and Editing.
ORCID IDs
Shawn Gouws: https://orcid.org/0000-0001-7387-695x
Melissa Gouws: https://orcid.org/0000-0002-0380-5491
REFERENCES
1 Larsen SF, Filippín C, Lesino G. Thermal simulation of a double skin façade with plants. Energy Procedia. 2014; 57:1763-1772. https://doi.org/10.1016/j.egypro.2014.10.165 [ Links ]
2 Perini K, Ottelé M, Fraaij ALA, Haas EM, Raiteri R. Vertical greening systems and the effect on air flow and temperature on the building envelope. Build Environ. 2011; 46(11):2287-2294. https://doi.org/10.1016/j.buildenv.2011.05.009 [ Links ]
3 Perini K. Rosasco P. Cost-benefit analysis for green facades and living wall systems. Build Environ. 2013; 70:110-121. https://doi.org/10.1016/j.buildenv.2013.08.012 [ Links ]
4 Nadia S, Noureddine S, Hichem N, Djamila D. Experimental study of thermal performance and the contribution of plant-covered walls to the thermal behaviour of building. Energy Procedia. 2013; 36:995-1001. http://dx.doi.org/10.1016/j.egypro.2013.07.113. [ Links ]
5 Widiastuti R, Zaini J, Caesarendra W, Kokogiannakis G, Suhailian SNNB. Thermal insulation effect of green façades based on calculation of heat transfer and long wave infrared radiative exchange. Measurement. 2022; 188:110555. https://doi.org/10.1016/j.measurement.2021.110555 [ Links ]
6 Djedjig R, Belarbi R, Bozonnet E. Experimental study of green walls impacts on buildings in summer and winter under an oceanic climate. Energy Build. 2017; 150:403-411. https://doi.org/10.1016/j.enbuild.2017.06.032 [ Links ]
7 Wong N H, Kwang Tan AY, Yok Tan P, Wong NC. Energy simulation of vertical greenery systems. Energy Build. 2009; 41:1401-1408. https://doi.org/10.1016/j.enbuild.2009.08.010 [ Links ]
8 Charoenkit S, Yiemwattana S. Living walls and their contribution to improved thermal comfort and carbon emission reduction: a review. Build Environ. 2016; 105: 82-94. https://doi.org/10.1016/j.buildenv.2016.05.031 [ Links ]
9 Getter KL, Rowe DB. The role of extensive green roofs in sustainable development. Hort Science. 2006; 41(5):1276-1285. https://doi.org/10.21273/HORTSCI.41.5.1276 [ Links ]
10 Susorova I, Angulo M, Bahrami P, Stephens B. A model of vegetated exterior façades for evaluation of wall thermal performance. Build Environ. 2013; 67:1-13. https://doi.org/10.1016/j.buildenv.2013.04.027 [ Links ]
11 Wong I, Baldwin AN. Investigating the potential of applying vertical green walls to high-rise residential buildings for energy-saving in subtropical region. Build Environ. 2016; 97:34-39. https://doi.org/10.1016/j.buildenv.2015.11.028 [ Links ]
12 Radic M, Brkovic Dodig M, Auer T. Green Facades and living walls - A review establishing the classification of the construction types and mapping benefits. Sustainability. 2019; 11(17):4579. https://doi.org/10.3390/su11174579 [ Links ]
13 Roehr D, Laurenz J. Living skins: Environmental benefits of green envelopes in the city context WIT Trans. Ecol Environ. 2008; 113:149158. https://doi.org/10.2495/ARC080151 [ Links ]
14 Loh S. Living Walls-A Way to Green the Built Environment. In Environment Design Guide. Australian Institute of Architects: Brisbane, Australia. 2008; 1-7. https://www.jstor.org/stable/26149051 [ Links ]
15 Safikhani T, Abdullah AM, Ossen DR. Baharvand M. A review of energy characteristic of vertical greenery systems. Renew Sustain Energy Rev. 2014; 40:450-462. https://doi.org/10.1016/j.rser.2014.07.166 [ Links ]
16 Manso M, Castro-Gomes J. Green wall systems: A review of their characteristics. Renew. Sustain. Energy Rev. 2015; 41:863-871. https://doi.org/10.1016/j.rser.2014.07.203 [ Links ]
17 Fox M, Morewood J, Murphy T, Lunt P, Goodhew S. Living wall systems for improved thermal performance of existing buildings. Build Environ. 2022; 207:108491. https://doi.org/10.1016/j.buildenv.2021.108491 [ Links ]
18 Stec WJ, Van Paassen AHC, Maziarz A. Modelling the double skin façade with plants. Energy Build. 2005; 37:419-427. https://doi.org/10.1016/j.enbuild.2004.08.008 [ Links ]
19 Yin H, Kong F, Middel A, Dronova I, Xu H, James P, Cooling effect of direct green facades during hot summer days: an observational study in Nanjing, China using TPR and 3DPC data. Build Environ. 2017; 116: 195206. https://doi.org/10.1016/j.buildenv.2017.02.020 [ Links ]
20 Sun Y, Zhang X, Ren G, Zwiers FW, Hu T. Contribution of urbanization to warming in China. Nat Clim Change. 2016; 6:706-9. https://doi.org/10.1038/nclimate2956 [ Links ]
21 Pielke RA. Land use and climate change. Science. 2005; 310 (5754):1625-1626. https://doi.org/10.1126/science.1120529 [ Links ]
22 Assimakopoulos M N, De Masi R F, de Rossi F, Papadaki D, Ruggiero S. Green wall design approach towards energy performance and indoor comfort improvement: A case study in Athens. Sustainability. 2020; 12 (9):3772. https://doi.org/10.3390/su12093772 [ Links ]
23 Sheweka S, Magdy AN, The living walls as an approach for a healthy urban Environment. Energy Procedia. 2011; 6: 592-599. https://doi.org/10.1016/j.egypro.2011.05.068 [ Links ]
24 Karimi K, Farrokhzad M, Roshan G, Aghdasi M. Evaluation of effects of a green wall as a sustainable approach on reducing energy use in temperate and humid areas. Energy Build. 2022; 262:112014. https://doi.org/10.1016/j.enbuild.2022.112014 [ Links ]
25 Benjamin K S, Griffiths S, Kim J, Bazilian M. Climate change and industrial F-gases: A critical and systematic review of developments, sociotechnical systems and policy options for reducing synthetic greenhouse gas emissions. Renew Sustain Energy Rev. 2021; 141:110759. https://doi.org/10.1016/j.rser.2021.110759 [ Links ]
26 Paull N, Krix D, Torpy F, Irga P. Can green walls reduce outdoor ambient particulate matter, noise pollution and temperature. Int J Environ Res Publ Health. 2020; 17:5084. https://doi.org/10.3390/ijerph17145084 [ Links ]
27 Bass B, Baskaran B. Evaluating Rooftop and Vertical Gardens as an Adaptation Strategy for Urban Areas. https://www.nps.gov/tps/sustainability/greendocs/bass.pdf [ Links ]
28 Blanco I, Convertino F, Schettini E, Vox G, Energy analysis of a green façade in summer: an experimental test in Mediterranean climate conditions. Energy Build. 2021; 245: 111076. https://doi.org/10.1016/J.ENBUILD.2021.111076 [ Links ]
29 Sudimac B, Bratislav I, Muncan V, Andelkovic AS. Heat flux transmission assessment of a vegetation wall influence on the building envelope thermal conductivity in Belgrade climate. J Clean Prod. 2019; 223: 907-916. https://doi.org/10.1016/j.jclepro.2019.02.087 [ Links ]
30 LogTag manufactures, https://logtagrecorders.com [ Links ]
Received 28 April 2022
Revised 03 August 2022
Accepted 04 August 2022
* To whom correspondence should be addressed: Email: gouws@mandela.ac.za

