


Serviços Personalizados
Artigo
 Inglês (pdf)
 Artigo em XML
 Referências do artigo
Indicadores

Links relacionados
-
 Citado por Google
 -
 Similares em Google
Compartilhar

 Permalink
South African Journal of Chemistry
versão On-line ISSN 1996-840X
versão impressa ISSN 0379-4350
S.Afr.j.chem. (Online) vol.76 Durban 2022
http://dx.doi.org/10.17159/0379-4350/2022/v76a10
RESEARCH ARTICLE
Potentiometrie and spectroscopic study of isoniazid - an anti-tubercular drug
Dauda K TolulopeI; Graham E JacksonI; Mino R CairaI; Ahmed N HammoudaI, III
IDepartment of Chemistry, University of Cape Town, Cape Town, South Africa
IIDepartment of Chemistry, Bells University of Technology, Ota Ogun State, Nigeria
IIIDepartment of Chemistry, Faculty of Science, University of Benghazi, Benghazi, Libya
ABSTRACT
The copper, nickel and zinc complexes of isoniazid (ISO, isonicotinic acid hydrazide), an anti-tubercular drug, have been investigated to determine whether these metal-ions improve the permeability and bioavailability of the drug. Since such properties of isonazid depend on its solution speciation, the latter was investigated by determining the equilibrium constants for the reaction of H+, Cu(II), Ni(II) and Zn(II) with isonazid in aqueous solution at 25.00 ± 0.01 °C and 0.15 M (NaCl), using glass electrode potentiometry. The structure of the copper complex of isoniazid was investigated using ultraviolet-visible spectroscopy. The results support the structures postulated from the potentiometric data. This study also considered membrane permeability using a Franz cell and octanol/water distribution coefficients. Distribution coefficient studies showed that ISO and its metal complexes are hydrophilic. The incorporation of a metal-ion improves the hydrophilicity of the ligand. The presence of a metal ion greatly enhanced the permeation of ISO through an artificial membrane in the order Cu(II) > Ni(II) > Zn(II) > ISO at pH 2 and Zn(II) > Ni(II) > ISO > Cu(II) at pH 4.
Keywords: permeability, potentiometric, speciation, spectroscopy, tuberculosis
INTRODUCTION
Tuberculosis (TB) is a global health problem that results in 1.4 million deaths annually.1 It is the leading cause of death by a single treatable infectious disease, killing approximately 4000 people per day worldwide. The burden of TB is particularly high in Africa, which accounts for 25% of cases with South Africa responsible for 14.4% of the case reported in 2020.1
In developing countries, TB is a leading cause of death.2 An important associated problem is an alarming increase in drug-resistant microbial strains (MDR-TB) that makes it difficult to effectively control the disease. To further complicate matters, drug-drug interactions between TB medicines and anti-HIV treatments or other chronic illness medications such as those used in patients with diabetes should also be considered.3-7 For these reasons, innovation in TB drug discovery and evolving strategies to develop new agents with better performance is a current health priority.8 The prime goal of anti-tuberculosis treatment includes the rapid killing of actively multiplying bacilli, prevention of acquired drug resistance, and sterilisation of infected host tissue to prevent clinical relapse. One approach to obtaining new anti-mycobacterial drugs is the development of new molecules by modifying old drugs with the aim of improving their anti-mycobacterial activity and obtaining better resistance profiles, bioavailability and tolerability, among others.9
The first-line anti-TB drugs, usually administered at the onset of the disease, are antibiotics, isoniazid, rifampicin, streptomycin and pyrazinamide.10 For latent TB, isoniazid is used independently. However, with active TB, rifampicin, streptomycin and pyrazinamide are co-administered. Isoniazid is a prodrug activated by a catalyse-peroxidase enzyme in M. tuberculosis. Upon activation, isoniazid inhibits the synthesis of mycolic acids, an essential component of the bacterial cell wall. These drugs are effective, but the problem is that the bacterium often develops drug resistance because of spontaneous genetic mutations involving the molecular targets of the drugs.11 The single-drug-resistant (SDR) and multi-drug resistant strains of M. tuberculosis have led to the use of second-line drugs, namely ciprofloxacin, ethionamide, kanamycin and p-aminosalicylic acid.12 These drugs also, unfortunately, have adverse side effects. Hence there is a need for new or modified drugs which can overcome bacterial resistance and at the same time have fewer side effects.
This research aims to investigate the use of metal complexes to improve the membrane permeability of isoniazid relative to the parent drug and hence increase its bioavailability. Since the solubility and hence permeability and bioavailability of the drugs depend on their solution speciation, the equilibrium constants for the reaction of H+, Cu(II), Ni(II) and Zn(II) with the ligand were measured in an aqueous solution at 25.00 ± 0.01 °C and ionic strength of 0.15 M (NaCl) using glass electrode potentiometry. The structures of the complexes in solution were studied using UV-Vis spectroscopy. The lipophilicity and hydrophilicity of the complexes were measured using octanol/ water distribution coefficients. The permeability of metal complexes was assessed using Franz cell diffusion measurements.
MATERIALS AND METHODS
All solutions for potentiometry were prepared in glass distilled water which had been boiled to remove dissolved carbon dioxide. Recrystallised NaCl was used as a background electrolyte to maintain a constant ionic strength of 0.15 M. All other reagents were commercially available and of analytical grade. These were used without purification. NaOH stock solutions were prepared from Merck Titrisol ampoules and standardised by titrating with potassium hydrogen phthalate (KHP) using a standard method of Vogel.13 HCl solutions were prepared from 0.01M HCl Merck Titrisol ampoule. The standarisation of the NaOH and the HCl solutions were cross-checked by titration against each other. The carbonate contamination of the sodium hydroxide titrant solutions was checked by acid-base titration using the Gran method.13
All pH measurements were carried out at 25 °C and a stable ionic strength of 0.15 M (NaCl) using an 848 Titrino plus. The Nernstian slope of the glass electrode, which varied from 57.13 to 58.27, was calibrated with a set ofpH buffers.14,15 The data from acid/base titrations were used to calculate the electrode response intercept, E0, and the ion product of water, pK, Under these conditions, the ionisation constant of water was determined to be 13.73 log units.
Isonazid (99.0% pure)was purchased from Sigma-Aldrich (South Africa) and used without further purification. Solutions of the ligand (0.01 M) were freshly prepared in 0.01 M HCl. The metal solutions were prepared by dissolving NiCl2.6H2O, CuCl2.2H2O and ZnCl2 in boiled out glass distilled water to yield 0.01 M solutions. The solutions were standardised against 0.01 mol dm-3 EDTA. The protonation constants of the ligand were calculated from data recorded during titrations of acidified solutions of isoniazid against a standardised solution of NaOH. For the metal formation constants, data from titrations of solution mixtures of isoniazid and metal against NaOH were used. The M:L molar ratios varied between 1:1 and 1:2.
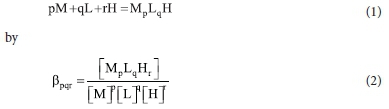
The data were analysed using the ESTA suite of computer programs.16 The protonation constants of the ligand and the overall metal formation constants are defined for the equilibrium:
UV-Vis spectra were recorded on a Hewlett Packard 8452A Diode Array spectrophotometer. Spectra of Cu(II) and isoniazid were recorded in the region 300-800 nm as a function of pH. Small amounts of 0.1 M NaOH or HCl were used to adjust the pH during the titration.
The distribution coefficients of the pure drug and those of its metal complexes were determined using the shake flask method. The organic phase, 1-octanol, was pre-saturated with water.17 A 0.1 mM solution of the drug was prepared in deionised water. 5 cm3 of the solution was dispersed into ten glass vials. The pH of the solution was adjusted using 0.100 M NaOH.18,19 Then 5 cm3 of 1-octanol (99%) was added to each vial, and the mixture was shaken for 5 minutes at a constant temperature of 25 ± 0.1 °C. After standing, 2 cm3 of each phase was removed, and the drug concentrations were determined spectrophotometrically. Each experiment was repeated three times. For measurement of the distribution coefficients of the metal complexes, an analogous procedure was used with solutions containing metal and drug in a 1:1 molar ratio. The distribution coefficient, log Dorg/aq, was calculated using:

The permeability coefficient (Kp) is the velocity of the drug passing through the membrane in cm h-1. The equation below gives the relation between permeability coefficient and steady-state flux:
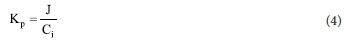
where J is the amount of permeant crossing the membrane at a constant rate (mg cm-2 h-1), Ci is the concentration of a ligand in the donor phase. The amount of permeant crossing the membrane J can be expressed as:
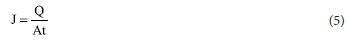
where Q (mg) is the quantity of ligand/complex transported through the membrane in time t (h), and A is the area of exposed membrane in cm2.The steady-state flux J dictates the rate and ease with which the permeant crosses a membrane under specified conditions. It is a dynamic property expressed in the unit of area per time (h).20 The temperature is kept constant. The magnitude of the diffusion coefficient depends on the properties of the drugs, the diffusion medium and the interaction between them. The diffusion coefficient is an important parameter indicative of diffusion mobility.
The receiver cell was filled with 20 cm3 of 0.02 M HCl. The ligand/ complex solutions (0.002 M) were prepared in 0.02 M HCl, and a 20 cm3 sample at either pH 2.0 or 4.0 was placed in the donor phase compartment with a semi-permeable membrane used as a barrier between the two compartments. The experiment was carried out at pH 2.0 and 4.0 to mimic the acidic condition of the stomach of black South Africans,21 who bear a high burden of TB. The artificial membrane was prepared using a filter paper (Whatman, 2.54 cm2 disc and thickness 0.002 cm), which was submerged in Cerasome 9005 and dried for a few minutes at room temperature. To determine the quantity of lipid absorbed, the membrane was weighed before and after soaking in Cerasome 9005. The available diffusion area between the cells was 0.6217 cm2. The medium was magnetically stirred for uniform drug distribution and was maintained at a temperature of 25 °C; samples were removed at different times. During the experiment, both cells were covered to prevent evaporation. The ligand concentration in each phase was determined spectrophotometrically at 265 nm. Measurements were done in triplicate over a 56-hour period. Results are expressed as mean ± SE.
Two formation functions, ZM-bar and QM-bar, were used to visualise and analyse the potentiometric data. The average number of ligands bound to the metal ion, ZM-bar, is given by: 22-24

where TL and TM are the total concentrations of ligand and metal, respectively, and the free-ligand concentration, [L], is given by
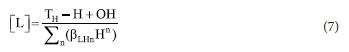
ZM-bar is plotted as a function of the negative logarithm of the free ligand concentration (pL). This function is strictly only defined for simple, mononuclear complexation, as no account is taken of any deprotonation reactions. Even so, it is useful for visualising the experimental data as deviations of the function from ideal behaviour indicate what species are formed in solution. Thus, if the ZM-bar bends backwards, the formation of MLH-n species is indicated. The disadvantage of this function is that the free ligand concentration can become negative (a physical impossibility but mathematically possible given the assumptions in calculating pL) if the concentration of the hydroxyl species is too large.
For this reason, the QM-b ar function is also used. While this function is not as easy to interpret as ZM-bar, it has the advantage that it is plotted against the measured pH and not some derived function. QM-bar is the average number of protons released due to complexation. When compared with the number of protons on the ligand (n-bar) at a particular pH, the stoichiometry of the predominant species can be estimated.
Qm-bar and n-bar are given by
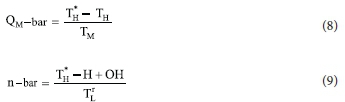
where TH is the total proton concentration and T*H is the calculated total concentration of protons that would be necessary to give rise to the observed pH in the absence of metal ions or rather if no complexation took place.
RESULTS AND DISCUSSION
Potentiometry
The overall protonation constants of isoniazid (ISO) are given in Table 1. The measured values of 3.67 and 10.95 correspond to the stepwise protonation of the pyridine nitrogen and the hydrazide groups, respectively. These values are in good agreement with the literature. They are close to the pKa values of pyridine (3.8) and hydrazide (10.8),25 and lower than that of acetyl hydrazide (11.86).26
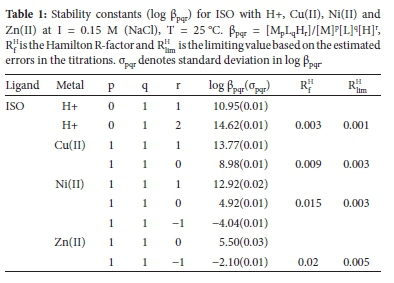
Figure 1 shows the complex formation (ZM-bar), and Figure 2 shows the deprotonation (QM-bar) curves for the Cu(II), Ni(II) and Zn(II)-ISO systems. In the Cu(II)-ISO system, neither the ZM-bar function nor the QM-bar function starts at zero in the acidic solution, indicating that some complexation had already taken place at the start of the titration. At pH 3.5 in the QM-bar curves and at -log[L] of 9.8, the ZM-bar curves have a hump, indicating the formation of a protonated species. A log p110 of 6.52 has been reported in the literature for the [Cu(ISO)]2+ complex at 30 °C and I= 0.10 M NaClO4.25 Our value of 8.98 is much higher than this. However, the previous study did not consider the formation of the protonated species. The value of log β111 = 14.57, reported for formic hydrazide,26 is in good agreement with our value of 13.77.
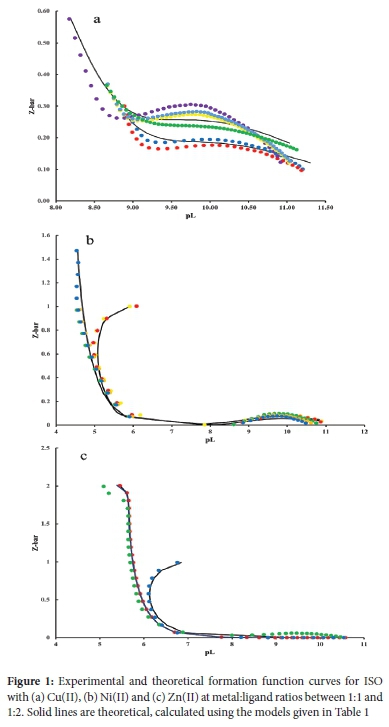
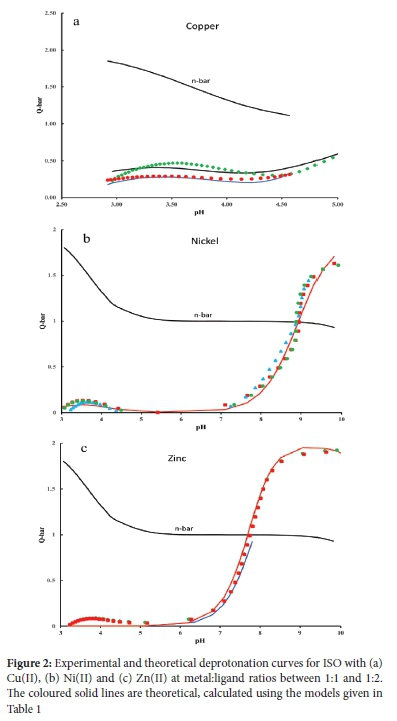
The formation curves for the Ni(II)/ISO system are very different from the ones obtained with Cu(II). The main reason for this is the pH. In the case of Ni(II), the titration could be continued to pH 11, whereas with Cu(II), precipitation occurred above pH 5. Using acetyl hydrazine or formic hydrazine, precipitation appeared earlier at pH 3.53 and 2.14-2.48, respectively.26 For Ni(II), classic formation functions were obtained. The hump at -log[L] =10 indicates the presence of a protonated species, while the fanning back at -log[L] = 4.9 indicates hydroxy species formation. The formation function of the Zn(II)/ISO system is similar to that of Ni(II) except that no protonated species is formed. Stability constants for these complexes are given in Table 1. A log β110 of 5.11 has been reported in the literature for the [Ni(ISO)]2+ complex and 5.71 for [Zn(ISO)]2+ at 30 °C and I = 0.10 M NaClO4.27 These are in good agreement with our values of 4.92 and 5.50. However, in our experiments, additional protonated species were identified, which are important at low pH values, which are encountered in the stomach.
The reproducibility of repeat titrations and excellent agreement at the different metal to ligand ratios between the theoretical and experimental formation and deprotonation function curves gives confidence to the result. The Hamilton factor indicates that the models are a good description of the equilibria occurring in solution.
The log (3110 value for [Cu(ISO)]2+ is 8.98; this is much higher than the stability constants of [Cu(II)(NH3)]2+ (4.8), [Cu(II)(pyridine)]2+ (2.49), and [Cu(II)(benzyhydrazide)]2+ (1.73), suggesting that the ligand is not monodentate.25 Similarly, the log (3110 values for pyridine complexation with Ni(II) is 1.87.25 These values are much lower than the values obtained in this study, indicating that the coordination for CuL and NiL is not via the pyridine nitrogen. The log β110 values are similar to those of ethylenediamine; [Cu(II)(en)]2+ (10.5), [Ni(en)]2+ (6.97) and [Zn(en)]2+ (5.59), suggesting that the ligand is bidentate. Thus, we suggest that the metal ion is coordinated, as shown in Figure 3. Note that, according to the HSAB theory, the coordination by an oxygen atom would decrease the stability of the Cu(II) and Ni(II) complexes but increase the stability of the Zn(II) complex of ISO relative to ethylenediamine.
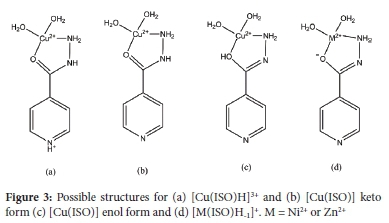
In the proposed structure for the metal complexes of ISO, the Cu(II) is coordinated to the isoniazid carbonyl oxygen and hydrazide amino nitrogen atoms. In the MLH species, the pyridine is protonated (Figure 3a). The coordination geometry is a five-membered chelate ring. If these structures are correct, deprotonation of the pyridinium cation of MLH to form ML (Figure 3b or c) should have a pKasimilar to that of pyridine. The equilibrium constant for the deprotonation of [Cu(ISO) H]3+ is (log βMLH - log βML (13.77 - 8.98) = 4.79), which is similar to the pKa of pyridine (5.21).28 Two isomers are presented for [Cu(ISO)]2+ as the hydrazine could coordinate in the enol or keto form.
Ni(II) and Zn(II) also form hydroxyl species. Here, the calculated pKa values (log βML - log βMLH-1) for the deprotonation of ML to form MLH-1 were 8.96 and 7.60 for Ni(II) and Zn(II), respectively. The value of 8.96 is 0.9 log units lower than the first hydrolysis constant of Ni(II) ( 9.86).29 Similarly, the pKa of [Zn(ISO)]2+ is 1.57 log units lower than the first hydrolysis constant of Zn(II) (9.17), which suggests that a coordinated water molecule is being deprotonated to form MLH-1. However, hydrazide can exist in a keto or enol form, and it has been suggested that the enol form predominates in an alkaline medium. Thus, it is possible that the proton is lost from the coordinated enol form of isoniazid (Figure 3d).
The structures presented in Figure 3 are supported by the electronic spectra of [Cu(ISO)H]3+ and [Cu(ISO)]2+ (supplementary data). As the pH of the solution increases from 2 to 4, the absorption band shifts to a shorter wavelength with an increase in intensity. The values of λmax and emax for CuLH and CuL are estimated to be 746 nm and 43 dm3 mol-1 cm-1. This λmax value is the same as that of [Cu(NH3)(OH2)5]2+ (745 nm). Similar values have also been reported for Cu(II) complexes of L-3,4-dihydroxyphenylalanine and S-DL-hydroxylysine.30,31 The fact that the two ISO species have the same λmax is consistent with the two species having the same coordination to Cu(II). Also, the value of λmax suggests coordination by a single nitrogen. Since a carbonyl gives rise to the same d-orbital splitting as a coordinated water molecule, it is not possible to tell if the carbonyl is coordinated or not.
Distribution coefficients
Lipophilicity of an organic compound is frequently described with reference to the distribution coefficient.32-34 The octanol:water system has been widely used as a model of the lipid phases as it mimics the lipid membrane/water systems found in the body.35Figure 4 shows the distribution coefficients, log Doct/aq of ISO as a function of pH. In order to understand the trend in the distribution coefficient, Figure 4 also has the percentage formation of each isoniazid species present in the solution.


Figure 4a shows that in the pH range 3.77-9.36, the predominant species in solution is IsoH+ and so a log Doct/aq of -0.61 can be assigned to this species. This value compares well with the literature value of -0.67.36 Note that at pH 2, the log Doct/aq of the ISO H22+ is only -1.4.
The distribution coefficient curve and the speciation graph for the Cu, Ni and Zn-ISO systems are plotted as a function of pH in Figures 4b, 4c, and 4d, respectively. It is evident that complexes of ISO are more soluble in water than in 1-octanol since the log Doct/aq values were negative.37
For the Cu/ISO system, at pH 2.2, log Doct/aq is -1.3 and increases to -0.6 at pH 3.7, when 60% of the ISO is complexed as [Cu(ISO)H]3+. From pH 3.7 to 4.8, log Doct/aq remained at -0.6 while [Cu(ISO)H]3+ is converted to [CuQSO)]2+ suggesting that the two species have similar distribution coefficients.
The variation in the distribution coefficient of isoniazid with pH in the presence of Ni(II) is shown in Figure 4c. At pH 2, none of the Ni(II) is complexed, and the distribution coefficient is that of ISOH22+. As the pH is raised (pH 4-6), the ISO complexes to the Ni(II) forming [Ni(ISO)H]3+ with a log Doct/aq of -0.75. At pH 8, [Ni(ISO)]2+ and [Ni(ISO)H-1]+ start to form and log Doct/aq increases slightly to -0.68.
For the Zn(II)/ISO system, the speciation graph (Figure 4d) shows the existence of four ligand species, [(ISO)H+ [(ISO)], [Zn(ISO)]2+ and [Zn(ISO)H-1]+ in the pH range 2.2 to 10.2. In the pH range 2-5, no Zn(II) complexation occurs, and the distribution curve is that of the free ligand. Above pH 5, Zn(II) complexes start to form, and the distribution coefficient drops slightly to -0.85.
Permeability
Figure 5 shows a plot of the amount of ISO diffusing through an artificial membrane as a function of time. The steady-state flux was calculated from the gradient, and the permeability coefficient (Kp) was obtained from the relationship between the flux and the initial concentration of ISO added to the donor phase. The variation in K for the different metal systems is shown in Figure 5b.
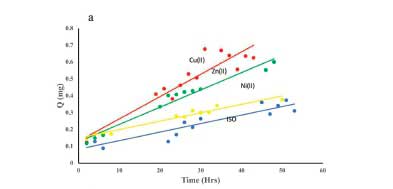
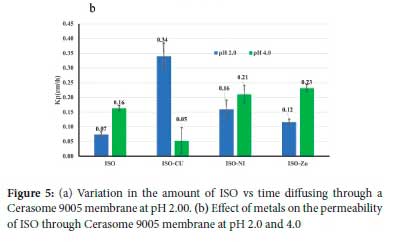
ISO has a molecular weight of 137.14 g mol-1 and is ideally suited for passive diffusion through bio-membranes.37 The permeability of ISO through porcine skin has been reported as 0.033 ± 0.006 cm h-1.38 In our experiment, the permeability coefficient was 0.068 ± 0.009 cm h-1, which is higher, but this is expected for an artificial membrane.39 From Figure 5, it is clear that the metal ions can promote the passage of ISO through the membrane. The permeability is in the order Cu(II) > Ni(II) > Zn(II), with enhancement factors of 5.8, 2.9 and 2.1 for Cu(II), Ni(II) and Zn(II), respectively. These experiments were performed at pH 2 and 4 as ISO is absorbed in the stomach, and this is the typical pH range found in rural black South African subjects.21 For Ni(II) and Zn(II), Kp increases with pH, but for Cu(II) it decreases. The most probable reason for this decrease precipitation, as in the potentiometry experiments, the Cu complex is precipitated at pH 5. It is interesting to note that there was no correlation between the distribution coefficient and the permeability coefficient. This absence of correlation has been noted before and attributed to the importance of solvation of the charged complexes.
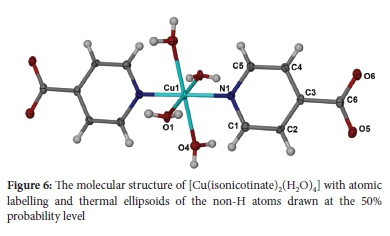
Solid-state studies
Since isoniazid is normally administered in tablet form, attempts were made to prepare solid samples of the metal complexes. To this end, the solvothermal method was used, a blue crystalline product being obtained for Cu(II). Elemental analysis, spectroscopic analysis and single-crystal analysis showed the product to be [Cu(isonicotinate)2(H2O)4]. The structure shown in Figure 6 was the same as the previously reported structure of hydrated copper(II) isonicotinate,40 with the Cu(II) coordinated to the pyridyl nitrogen. During the synthetic procedure, in the presence of Cu(II), the hydrazide hydrolysed to the acid. An analogous hydrolytic reaction was reported when pyridine-2-carboxamide underwent prolonged reflux in water in the presence of Cu(II) ions.41 Full details of these solid-state aspects will be published elsewhere.
CONCLUSION
This study shows that the two measurable acid dissociation constants of 3.67 and 10.95 for isoniazid correspond to the protonation of the pyridine nitrogen and the hydrazide group, respectively. The equilibrium constant for the deprotonation of Cu(ISO)H (log (3MLH - log (3ML = 13.77 - 8.98) is 4.79. This value is similar to the pKa of pyridine (5.21), which suggests that the pyridinium cation is deprotonated to form ML from MLH.
The log (3 value of 8.98 for CuISO is quite close to the log (3 of [Cu(II)(en)]2+ (10.5), suggesting that the ligand has a similar binding mode. Ni(II) forms a relatively stable complex with ISO, but the stability is lower than that of Cu(II). Trends in the equilibrium constant are in accordance with the Irving-Williams stability series. According to the spectroscopic study, the λmax obtained for CuLH is similar to that of [Cu(NH3)(OH2)]2+ (745 nm). This similarity suggests that the hydrazide amino nitrogen atom of ISO is coordinated to the copper and that the pyridine nitrogen is protonated, which agrees with the potentiometric results. It was observed that the log Doct/aq values were all negative, suggesting that the complexes are hydrophilic. The variation of the distribution coefficients with pH is consistent with the metal complex speciation.
The presence of Cu(II), Ni(II) and Zn(II) greatly enhanced the permeation of ISO through an artificial membrane in the order Cu(II) > Zn(II) > Ni(II) at pH 2 and Zn(II) > Ni(II) > Cu(II) at pH 4. For Ni(II) and Zn(II), increasing the pH increased the permeation rate. It is interesting to note that Caon et al. have advocated the transdermal administration of isoniazid.38 Our permeation rates for the Zn(II) and Ni(II) complexes of isoniazid are higher than those of Caon et al. So it would be interesting to see if administration of these metal complexes through the skin is a viable option. Statistical analysis of the results showed no correlation between the logarithm of distribution and permeability coefficients. This absence of correlation implies that log K is a better measure than log Doct/aq of the bioavailability of metal complexes of ISO.
ACKNOWLEDGEMENT
The authors thank the University of Cape Town, the Faculty of Science and the National Research Foundation (NRF) for financial support.
SUPPLEMENTARY MATERIAL
Supplementary information for this article is provided in the online supplement.
ORCID IDs
Dauda Tolupe - https://orcid.org/0000-0001-9774-7351
Graham Jackson - https://orcid.org/0000-0002-4243-5470
Mino Caira - https://orcid.org/0000-0002-7802-2600
Ahmed Hammouda - https://orcid.org/0000-0002-7816-0261
REFERENCES
1. WHO [World Health Organization]. Global tuberculosis report, Geneva: Switzerland.:2020, https://www.who.int/publications/i/item/9789240013131. [ Links ]
2. Zaman K. Tuberculosis: a global problem. J Health Popul Nutr. 2010;28(2):111-113. https://doi.org/10.3329/jhpn.v28i2.4879. [ Links ]
3. Koul A, Arnoult E, Lounis N, Guillemont J, Andries K. The challenge of new drug discovery for tuberculosis. Nature. 2011;465(7331):483-490. https://doi.org/10.1038/nature09657. [ Links ]
4. Mukadi YD, Maher D, Harries A. Tuberculosis case fatality rate in high HIV prevalence populations in sub-Sahara Africa. AIDS. 2001;15(2):143-152. https://doi.org/10.1097/00002030-200101260-00002. [ Links ]
5. Stevenson CR, Forouhi NG, Roglic G, Williams BG, Lauer JA, Dye C, Unwin N. Diabetes and tuberculosis: the impact of the diabetes epidemic on tuberculosis incidence. BMC Public Health. 2007;7(1):234-241. https://doi.org/10.1186/1471-2458-7-234. [ Links ]
6. Alisjahbana B, Sahiratmadja E, Nelwan EJ, Purwa AM, Ahmad Y, Ottenhoff THM, Nelwan RHH, Parwati I, van der Meer JWM, van Crevel R. The effect of type 2 diabetes mellitus on the presentation and treatment response of pulmonary tuberculosis. Clin Infect Dis. 2007;45(4):428-435. https://doi.org/10.1086/519841. [ Links ]
7. Jeon CY, Murray MB. Diabetes mellitus increases the risk of active tuberculosis, a systematic review of 13 observational studies. PLoS Med. 2008;5(7):e152. https://doi.org/10.1371/journal.pmed.0050152. [ Links ]
8. Lourenco MCS, Ferreira ML, de Souza MVN, Peralta MA, Vasconcelos TR, Henriques MGO. Synthesis and anti-mycobacterial activity of (E)-N-(monosubstituted benzylidene isonicotinohydrazide derivatives. Eur J Med Chem. 2008;43(6):1344-1347. https://doi.org/10.1016/j.ejmech.2007.08.003. [ Links ]
9. Wolff ME. Burger's Medicinal Chemistry and Drug Discovery. Vol. 2. Laguna Beach: John Wiley & Sons; 1996. [ Links ]
10. Maccari R, Ottana R, Monforte F, Vigorita MG. In vitro anti-mycobacterial activities of 2-monosubstituted isonicotinohydrazides and their cyanoborane adducts. Antimicrob Agents Chemother. 2002;46(2):294-299. https://doi.org/10.1128/AAC.46.2.294-299.2002. [ Links ]
11. Arbex MA, Varella Mde C, Siqueira HR, Mello FA. Antituberculosis drugs: drug interactions, adverse effects, and use in special situations. Part 1: first-line drugs. J Bras Pneumol. 2010;36:626-640. https://doi.org/10.1590/S1806-37132010000500016. [ Links ]
12. Niederweis M, Danilchanka O, Huff J, Hoffmann C, Engelhardt H. Mycobacterial outer membranes: in search of proteins. Trends Microbiol. 2010;18(3):109-116. https://doi.org/10.1016/j.tim.2009.12.005. [ Links ]
13. Vogel AI. Vogels Textbook of Quantitative Inorganic Analysis. 4th ed. London: Longman Group; 1978. [ Links ]
14. Guilbault GG, Kramer DN, Goldberg P. The application of modified Nernstian equations to the electrochemical determination of enzyme kinetics. J Phys Chem. 1963;67(9):1747-1749. https://doi.org/10.1021/j100803a002. [ Links ]
15. Rossotti JC, Rossotti H. Potentiometric titrations using Gran plots. J Chem Educ. 1965;42(7):375-378. https://doi.org/10.1021/ed042p375. [ Links ]
16. Kevin PMM, Murray B. ESTA: Equilibrium simulation for titration analysis. Cardiff: University of Wales Institute of Science and Technology (UWIST).1984. [ Links ]
17. Leo A, Hansch C, Elkins D. Partition coefficient and their uses. Chem Rev. 1971;71(6):525-616. https://doi.org/10.1021/cr60274a001. [ Links ]
18. Xiang TX, Anderson BD. The relationship between permeant size and permeability in lipid layer membrane. J Membr Biol. 1994;140(2):111-122. https://doi.org/10.1007/BF00232899. [ Links ]
19. Zvimba JN, Jackson GE. Copper chelating anti-inflammatory agents; N1-(2-aminoethyl)-N2-(pyridin-2-ylmethyl)-ethane-1,2-diamine and N-(2-(2-amino-ethylamino) ethyl) picolinamide: An in vitro and in vivo study. J Inorg Biochem. 2007;101(1):148-158. https://doi.org/10.1016/j.jinorgbio.2006.09.006. [ Links ]
20. Hansch C, Leo A, Hoekman D. Exploring QSAR Hydrophobic, Electronic and Steric Constants. Washington (D.C.): ACS; 1995. [ Links ]
21. Sammon AM, Ndebia EJ, Umapathy E, Iputo JE. 24-Hour measurement of gastric pH in rural South Africa. Gastroenterol Res Pract. 2015;2015:658106. https://doi.org/10.1155/2015/658106. [ Links ]
22. Jackson GE, Mkhhonta L, Voye A, Kelly M. Design of copper-based antiinflammatory drugs. J Inorg Biochem. 2000;79(1-4):147-152. https://doi.org/10.1016/S0162-0134(99)00171-3. [ Links ]
23. Odisitse S, Jackson GE, Govender T, Kruger HG, Singh A. Chemical speciation of copper(II) diaminediamide derivative of pentacycloundecane - a potential anti-inflammatory agent. Dalton Trans. 2007;11(11):1140-1149. https://doi.org/10.1039/B614878E [ Links ]
24. May PM, Murray K, Williams DR. The use of glass electrodes for the determination of formation constant. III Optimization of titration data: the esta library of computer programs. Talanta. 1988;35(11):825-830. https://doi.org/10.1016/0039-9140(88)80197-8. [ Links ]
25. Pettit LD, Powell HKJ. Stability constant database. York: Academic Software. 1993. [ Links ]
26. Wozniczka M. E. S.-Pietek and J. Jezierska, B. Pasternak, J. G.-Sobczynska, A. Kufelnicki, The complexing properties of oxalodihydrazide, acethydrazide and formic hydrazide with Cu(II) in aqueous solution. Chim. Acta. 2017;455:659-665. [ Links ]
27. Magare BK, Farooqui MN, Shelke RS, Ubale MB. Interaction of some anti tuberculosis drugs with transition metal ions. Orient J Chem. 2009;25:387-390. [ Links ]
28. Linnell RH. Dissociation constants of 2-substituted pyridines. J Org Chem. 1960;25(2):290. https://doi.org/10.1021/jo01072a623. [ Links ]
29. Baes CF, Mesmer RE. The hydrolysis of cations. New York: Wiley-Interscience Publication; 1976. [ Links ]
30. Oza T. Nickel complexes of 1,10-phenanthroline and 2,2'-bipyridyl with strong intermolecular interactions. Cryst Res Technol. 1988;23(3):385-391. https://doi.org/10.1002/crat.2170230319. [ Links ]
31. Daniele PG, Ostacoli G, Zerbinati O. Thermodynamic and spectrophotometric study of copper (II) L-dopa complexes in aqueous solution. Ann Chim. 1990;80:89-99. [ Links ]
32. Swarbrick MJ, Cammarata A. Physical Pharmacy. 3rd ed. New Delhi: Lippincott. Williams and Wilkins; 2001. p. 3303. [ Links ]
33. Krishnaiah YSR, Satyanarana V, Karthikeyan RS. Effect of the solvent system on the in vitropermeability of nicardipine hydrochloride through excised rat epidermis. J Pharm Pharm Sci. 2002;5:124-130. [ Links ]
34. Hersey A, Hill AP, Hyde RM, Livingstone DJ. Principle of methods selection in partition studies. Quant Struct-Act Relationsh. 1989;8(4):288-296. https://doi.org/10.1002/qsar.19890080405. [ Links ]
35. Hansch C, Leo AJ. Substituents Constants for Correlation Analysis in Chemistry and Biology. New York: Wiley-Interscience; 1979. [ Links ]
36. Anon. Isoniazid. Tuberculosis 2008;88(2):112-116. https://doi.org/10.1016/S1472-9792(08)70011-8. [ Links ]
37. Xiang TX, Anderson BD. The relationship between permeant size and permeability in lipid bilayer membranes. J Membr Biol. 1994;140(2):111-122. https://doi.org/10.1007/BF00232899. [ Links ]
38. Caon T, Campos CEM, Simoes CMO, Silva MAS. Novel perspectives in the tuberculosis treatment: administration of isoniazid through the skin. Int J Pharm. 2015;494(1):463-470. https://doi.org/10.1016/j.ijpharm.2015.08.067. [ Links ]
39. Zhu C, Jiang L, Chen TM, Hwang KK. A comparative study of artificial membrane permeability assay for high throughput profiling of drug absorption potential. Eur J Med Chem. 2002;37(5):399-407. https://doi.org/10.1016/S0223-5234(02)01360-0. [ Links ]
40. Waizump K, Takuno M, Fukushinma N, Masuda HJ. Structures of pyridine carboxylate complexes of cobalt(II) and copper(II). Coord Chem. 1998;44:269-279. https://doi.org/10.1080/00958979808023079. [ Links ]
41. Vaskova Z, Padêlkovâ Z, Mazur M, Valigura D, Moncol J. Synthesis, properties and crystal structures of nitrobenzoatocopper(II) complexes with pyrazinecarboxamide. Trans Met Chem (Weinh). 2011;36(8):883-889. https://doi.org/10.1007/s11243-011-9545-4. [ Links ]
Received 29 September 2020
Revised 12 January 2022
Accepted 12 January 2022
* To whom correspondence should be addressed: Email: graham.jackson@uct.ac.za
Supplementary Data
The supplementary data is available in pdf: [Supplementary data]

