


Services on Demand
Article
 English (pdf)
 Article in xml format
 Article references
Indicators

Related links
-
 Cited by Google
 -
 Similars in Google
Share

 Permalink
South African Journal of Chemistry
On-line version ISSN 1996-840X
Print version ISSN 0379-4350
S.Afr.j.chem. (Online) vol.74 Durban 2021
http://dx.doi.org/10.17159/0379-4350/2021/v74a4
RESEARCH ARTICLE
The Thermal Agitated Phase Transitions on the Ti32 Nanocluster: a Molecular Dynamics Simulation Study
Tshegofatso M. PhaahlaI; Alexey A. SokolII; Charles R.A. CatlowI, II; Scott M. WoodleyII; Phuti E. NgoepeI; Hasani R. ChaukeI, *
IMaterials Modelling Centre, University of Limpopo, Private Bag X1106, Sovenga, 0727, South Africa
IIUniversity College London, Kathleen Lonsdale Materials Chemistry, Department of Chemistry, 20 Gordon Street, London WC1H 0AJ, United Kingdom
ABSTRACT
Molecular dynamics simulations were performed to investigate the stability with respect to increasing the simulated temperature from 300 to 2400 K of an isolated cluster composed of 32 titanium atoms. The interatomic interactions were modelled using Gupta potentials as implemented within the classical molecular dynamics simulation software DL_POLY. The radial distribution functions (RDF), diffusion coefficient, and density profiles were examined to study the structural changes as a function of temperature. It was found that the Ti32 nanocluster exhibits temperature structural transition. The icosahedron and pentagonal bi-pyramid structures were found to be the most dominant building block fragments. Deformation of the nanocluster was also measured by diffusion coefficient, and it was found that the Ti32 are mobile above the bulk melting point. The phase transitions from solid to liquid have been identified by a simple jump in the total energy curve, with the predicted melting temperature near the bulk melting point (1941.15 K). As expected, the RDF's and density profile peaks decrease with increasing temperature.
Keywords: Molecular dynamics, titanium cluster, radial distribution functions, diffusion coefficient, mean square displacement.
1. Introduction
Transition metal nanoclusters have attracted extensive investigation over the past decades due to their unique properties, which lie somewhere between those of bulk and single-particle species.1 They have many fascinating potential uses, including quantum computers or quantum dots, light-emitting diodes, chemical sensors and photochemical applications such as flat-panel displays.2-3
Supported nanoclusters are also widely used in catalysis as a large percentage of a nanocluster's metal atoms lie on the surface, and the configurations and electronic properties of surface atoms may differ substantially from those of the bulk.4 Moreover, the thermodynamics and other properties near the melting points of metallic nanoclusters are typically very different from those observed for corresponding bulk phases, thus also driving both theoretical and experimental interest in nanoclusters.5-9
For many years, theoretical studies have been used to predict structural properties and reactivity of nanoclusters or nano-particles, including the reduced heats of formation,10,11 surface premelting,12 size dependence of melting temperatures,13 and solid-liquid like phases.6,14 These predictions on the behaviour of the nanoclusters have also been confirmed using experiments.15,16 It was further reported that the melting point strongly depends on the cluster size. However, clusters of smaller sizes do not show pronounced melting temperatures.15 Moreover, classical molecular dynamics (MD) simulation17 was found to be both a reliable and a standard approach used to study the phase transition of the materials. The interest in applying this approach was to gain insight into the thermal stability and melting behaviour of clusters.
Employing MD, Wang et al.18and Cleveland et al.19investigated the melting behaviour of clusters and nanowires, focusing first on the melting temperature, thermal stability and mechanical properties during the melting process; secondly, on the structural evolutions and mechanical properties during heating; and thirdly on the variation of structural characteristics and size effects with temperature. Cleveland et al.19reported a low temperature structural solid-solid transition, from the optimal structural motif to icosahedral structures, as a precursor to melting. Compared to the bulk phase, they predicted a lower melting temperature for nanoclusters. Moreover, a much earlier investigation of Borel20 reported that the melting temperature decreases with decreasing diameter of the nanoclusters. Similarly, Wang et al.18found a structural transition within titanium nanowires below the melting point.
In addition to identifying the melting temperature of nanoclusters, some of the main findings include the broadening of the melting transition and the appearance of a characteristic S-shaped loop in the caloric curve.21,22,23 Other studies used the potential energy distribution of atoms in nanoclusters to explain many phenomena related to the phase transition of nano-clusters. Lee et al.13found a new type of premelting mechanism in the Pd19 nanocluster. However, Breaux et al.24,25reported that Gan+ nanoclusters (n = 17, 20, 30-50, 55) melt at temperatures ranging from 500-800 K and bulk Ga melting at a mere 303 K.
We have previously investigated the structural evolution of Tin (n = 2-32) ground state nanoclusters and the evolution of their electronic structure.26 The ground state configurations were predicted using an evolutionary algorithm to find low energy local minima on the energy landscape defined by interatomic potentials. The atomic configurations were subsequently refined using an electronic structure approach.
The chosen global optimization was implemented within the Knowledge Led Master Code (KLMC),27 which calls external codes GULP28 and FHI-aims29 in order to evaluate the energy and locally optimize the configurations.
This study focuses on the characteristics of ground-state configuration predicted for the Ti32 nanocluster using molecular dynamic simulation. Ti32 nanocluster is formed by four interpenetrating pentagonal fragments.26 It was also revealed that the 32 atom titanium nanocluster resembles a low-temperature hcp a-Ti. This structure was deduced from the predicted binding energy data as the cluster evolved towards the bulk system. In the next section, we outline the technique employed to simulate the melting behaviour of the Ti32 nanocluster. In section 3, we discuss the effect of temperature on the electronic and structural evolution of the 32-atom titanium nanocluster.
2. Methodology
The initial atomic configuration was taken from our previous study,26 where a genetic algorithm was employed to predict the ground state for Ti32. The energy landscape explored in our earlier work is defined by a combination of a Born-Mayer two-body and Embedded atom method (EAM) interatomic potentials.26 To properly simulate the thermodynamic properties of the Ti32 nanocluster, the EAM and the Born-Mayer interatomic potentials reported by Lazauskas el al.26were incorporated together to express the total internal energy of pure metals in terms of Gupta potentials.30 Based on the second moment approximation of tight-binding theory, the Gupta potential and ion-ion interaction are described by an electronic band and a repulsive term. The total potential of system N atoms located at positions is expressed as follows:
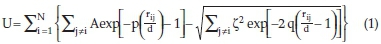
where the first term represents repulsive many-body and the second term represents the attractive many-body. In this approach, both terms are introduced in the exponential form,31 where d is the first-neighbour distance, Ç is an affective overlap integral between the electronic orbitals of the neighbouring atom, q and p control the decay of the exponential function related to bulk elastic constants.32 The MD simulations (heating/melting process) were performed in the NVT canonical ensemble. The nanocluster was confined in a cubic unit cell (at fixed lattice parameter, a=b=c = 50 A) with periodic boundary conditions applied in the x, y, z directions implemented within DL_POLY software.33
The temperature T was controlled by the Nose Hoover thermostat34 with a relaxation time of 0.001 ps. The time integration of the equation of motion was performed using the velocity Verlet leapfrog algorithm.33 The interatomic interactions were truncated at the cutoff radius of 4 A.
One independent MD run was performed for 23 fixed temperatures, with 300 K as our lowest chosen temperature and 2400 K our highest. A run time of 300 ps was employed to equilibrate the cluster before collecting data for 600 ps.
3. Results and Discussion
3.1. Temperature Effect on the Ti32 Nanocluster
The minimum energy cluster for Ti32 is presented in Fig. 1. The snapshots of the thermally agitated Ti32 nanocluster are analyzed in detail to gain more insights regarding structural transition as a function of temperature (T). Note that the (Ti32) nanocluster shows various geometrical configurations as the temperature is increased. The dominant configurations are a triangular bi-pyramid (Ti5), an octahedron (Ti6), a pentagonal bi-pyramid (Ti7), an icosahedron (Ti13) and interpenetrating icosahedra (Ti19), as shown in Fig. 1.
The temperature dependence of the equilibrium cluster structure for Ti32 is shown in Fig. 2 (see supplementary information). It was found that the configurational transitions involve distortion or displacement of atoms in the Ti32 nanocluster as the temperature increases. The distortion of the Ti32 nanocluster becomes more frequent from lower temperatures and increasingly severe with increasing temperature. The structural transients are shown in different colour coding as the structure of T32 nanocluster changes as a function of temperature.
The initial configuration starts as interpenetrating icosahedra, where one of the icosahedra is replaced with an icositetrahedra geometry. The transient at 300 K has two interpenetrating icosahedral units (maroon) with two pentagonal bi-pyramids (green and blue). As the temperature increases, the atomic displacement about the initial positions increases and leads to a change in the morphology of the nanocluster at 400 K to a Ti19 unit (red) interpenetrating with two pentagonal bi-pyramids, Ti7 (blue and lime-green), added on the sides of the Ti19. This change may be attributed to atoms in a solid that undergo vibrations about the equilibrium position, leading to distortions of crystal nanocluster.35 The transition of the nanocluster at 500 K is observed to have Ti20 (blue) polyhedron interpenetrating with icosahedron (gold), triangular bi-pyramid (violet) and an atom (red) connecting the triangular pyramidal and icosahedral units or nanoclusters. At 600 K, the nanocluster transitions to a Ti19 (gold) polyhedron interpenetrating with a Z13 Frank Casper polyhedron Ti14 (blue) and a triangular bi-pyramid (lime-green). The effect of thermal agitation at 700 K changes the Ti32 morphology into two interpenetrating Ti19 (gold and blue) poly-hedra with a triangular unit connected to the Ti19 polyhedron described by the blue colour. At 800 K, the two Z12 Frank Kasper polyhedral Ti13 (green and blue) form the transient unit interconnected to pentagonal bi-pyramid (lime-green), triangular unit (violet) and an atom (red). The Ti13 nanocluster (maroon) was observed to coexist with four pentagonal bi-pyramids (blue, green, and gold) at 900 K. Two interpenetrating icosahedra (lime-green and blue) complemented by tetra-capped atoms (violet and maroon) on the sides are found to be the transient for 1000 K. The transition occurring at 1100 K leads to two icosa-hedra connected by dimers (black and lime-green).
Furthermore, for higher thermal agitation, these fragmentation patterns reveal the existence of a stable building block, namely an icosahedron, or interpenetrating pentagonal bi-pyramid. At 1200, the coexistence of three-pentagonal bi-pyramid (blue, black and maroon) and triangular unit connecting all the penta-shaped units or nanoclusters with a dimer (lime-green) connecting the blue, maroon and black penta-shaped units. The transient observed for 1300 Kcomprises two icosahedral polyhedra (blue and lime-green) connected by six atoms. However, at 1400 K, the two interpenetrating icosahedra (blue and green) are found to coexist with a triangular bi-pyramid unit as well as a complementing dimer connecting the other fragments.
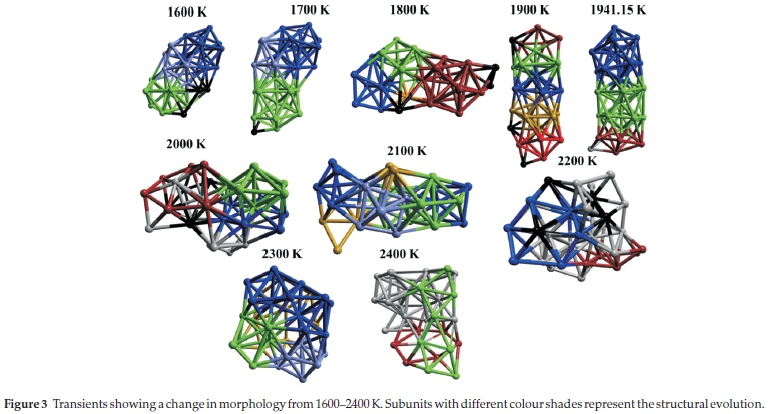
The structural transformation precursor at 1500 K is found to be two icosahedral fragments (lime-green and blue) connected by the hexagonal ring (violet, lime-green and black) or triangular bi-pyramid (violet) with an atom (black) connecting the icosahedra and triangular bi-pyramid. Furthermore, the structural transition for 1600 K, shown in Fig. 3 (see supplementary information), is noted to be two icosahedral isomers connected by triangular bi-pyramid shaped nanocluster (violet) and triangular unit (black). At 1700 K, two interpenetrating icosahedra (blue and violet) capped on top of one of the icosahedral configurations (lime-green) with an atom (black) was observed. The transient for 1800 K is found to be the icosahedron (maroon) bi-pentagonal bi-pyramid (blue and green) with tetra-coordinated capping atoms (black) completing the structure. At 1900 K, the nanocluster transitions into three interpenetrating icosahedra capped by an atom (black), which can also be seen as four interpenetrating pentagonal bi-pyramids (lime-green, gold, blue and red) with a triangular unit (maroon) capping the top of the pentagonal bi-pyramid (lime-green) and three further single complementing atoms (black). However, at 1941.15 K, which is the melting temperature for bulk titanium,36,37 the structural transition is observed to have two interpenetrating icosahedra (blue and green) capped by a pentagonal bi-pyramid (maroon) with one (grey) capping atom completing the structure. At 2000 K, three hexagonal rings (black, blue and red) coexisting with pentagonal bi-pyramid (lime-green) and additional atoms (grey) were observed.
This transition did not follow the same pattern with icosa-hedral dominated configurations, and the behaviour might be attributed to the configuration having a higher symmetry structure. Furthermore, at 2100 K, five octahedral isomers (lime-green, blue and violet) coexisting with eight atoms (gold and green) were observed. The 2200 K structural transition is observed to be two interpenetrating hexagonal rings (blue and black) coexisting with a pentagonal ring (maroon) and the surrounding atoms (grey). The same is observed where the nanocluster did not follow the pentagonal dominated pattern. At 2300 K and 2400 K, the thermal agitated structural transitions are to hexagonal and pentagonal shaped unit dominated configurations (blue, lime-green, violet and gold), whereas 2400 K forms a hexagonal ring (maroon) and triangular unit dominated transition. As discussed below, above 2000 K, there is appreciable atomic mobility confirming the molten state.
3.1.1. Heating and Cooling for Ti32 Cluster
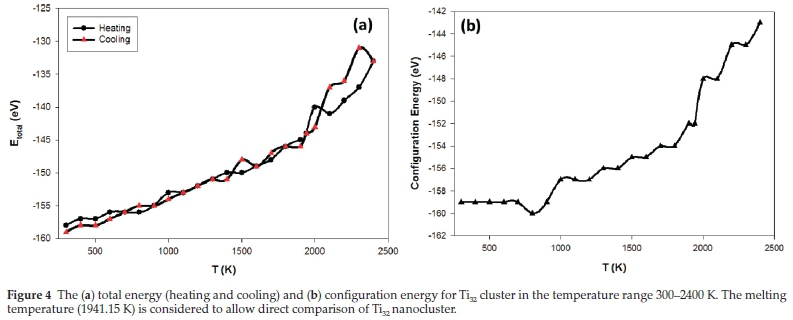
The melting transition of the cluster from a rigid or solid form in which atoms merely oscillate about the equilibrium structure to a liquid or fluid form characterized by atoms leaving their equilibrium basins and finding new ones with new equilibrium positions is spread over a range of temperatures from 300-2400 K. Figure 4a shows the energy varying smoothly with temperature up to 2000 K where it depicts a jump in the total energy closer to the melting temperature of bulk Ti. Thus, this behaviour may be ascribed to a solid-liquid phase transition that is in excellent agreement with the melting point of bulk Ti (1941.15 K).36 This positive deviation from linearity in the total energy may be attributed to the tendency of the nanocluster undergoing surface melting.38
The most striking feature of these results is that the maximum in the total energy occurs at a temperature above the bulk melting point. In addition, there have been theoretical reports that small nanoclusters have elevated melting temperatures.39,40
Upon cooling, the cluster undergoes a liquid-solid transition. The nanocluster energies become lower from 600-300 K, 1000 K, 1400 K, 1900 K and 2000 K, suggesting the formation of a new stable configuration. There are cooling energies higher than heating energies observed at 800 K, 1500 K, 1700 K, 2100 K, 2200 K and 2300 K, respectively, suggesting the transition to less stable configurations. The solid-liquid and liquid-solid transition have similar energies at 700 K, 900 K, 1100-1300 K, 1600 K, 1800 K and 1941.15 K suggesting similar configurations. A weak hysteresis was observed at 2000 K, suggesting a phase change accompanied by the formation of new geometry. The melting-quenching cycle discloses that it is easier for the nanocluster to go from the solid-liquid phase than the liquid-solid phase, as observed from the total energy data.
In the case of the configuration energy in Fig. 4b, it is observed that at temperatures 300-700 K, the energy is constant, followed by a dip at 800 K, which results in a lower energy nanocluster compared to other temperatures. However, a sudden jump in the energy from 800-1000 K, is followed by the linear increase from 1000-1200 K. Furthermore, a stepwise increase in energies at temperatures from 1300-2300 K is observed, with an abrupt jump in the energy at 1941.15 K that is higher than other temperatures (1900 Kand 2000 K). The abrupt jump maybe attributed to the phase transition of the nanocluster from a solid phase to a liquid phase.
3.1.2. The Diffusion Coefficient for Ti32
Figure 5 shows the diffusivity, which was calculated from the means square displacement at increasing temperature. The figure depicts no movement of atoms at temperatures lower than 1941.15 K, where the diffusivity reverts to zero. At 2000 K, the atoms appear to have a noticeable movement followed by a diffusivity jump at 2100 K, which might indicate the transition of the nanocluster from solid phase to liquid phase.
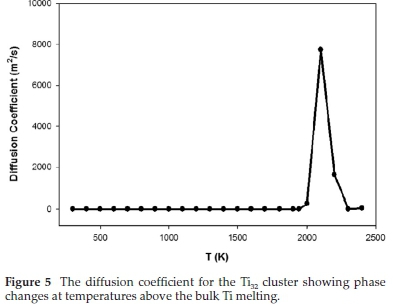
These observed transitions are justifiable since the melting temperature for Ti bulk is 1941.15 K which is closer to 2100 K. It is also noticed that as the cluster changes its shape, the diffusivity reverts to zero until the melting temperature is reached. This behaviour may be due to nanocluster transforming into a liquid phase and consequently resulting in surface melting. Similar behaviour was noted for Pd-Pt clusters.35 Their transition temperature was observed to be in the temperature range 800-1200 K, corresponding to the surface melting stage.
However, both Pd and Pt diffusion coefficients tended to increase with temperature whilst a decline is observed in this study. The decline behaviour might be due to differences in atomic sizes and the number of atoms in the cluster.
3.1.3. Radial Distribution Function and Density Profiles for the Ti32 Cluster
In Fig. 6a, the RDFs and the atomic distribution curves against temperature are shown. The 300 K peak shows that the nanocluster has a well-ordered structure.
However, as the temperature increases, the peaks become broader and decrease, indicating a phase change. The reduction in the probability of the peaks may be ascribed to nanocluster changing phases or fragments, which at some point will transition from a solid phase to a liquid phase at an elevated temperature near or above the melting point. This observation is in line with previous reports.41,42 The reduction in the sharpness of the peaks is indicative of the reduced crystallinity of the nanocluster, which results in the production of new configurations. Thus, representing the evolution of the nanocluster during heating.
In the case of the density profile plot (Fig. 6b), the atomic distribution of Ti32 nanocluster along the axis at different temperatures shows various trends. At lower temperatures, the distinct peaks indicate the solid-like features, where atoms have higher distribution at a certain distance from the centre. This plot depicts overlap of the peaks at 300 K and 800 K. suggesting that the nanocluster is still in its solid form. However, from 1400-1941.15 K, the peaks are observed to decrease and overlap, indicating minor thermally agitated changes in the system, i.e. the nanocluster is still in a solid phase.
Furthermore, it becomes easier to observe the changes along the Z (A) axis. As the temperature increases, the peaks become broader, decreasing the peak size due to uniformly distributed atoms in the liquid phase at elevated temperatures. Moreover, at 2000 K, which is beyond the bulk melting temperature, atomic distribution becomes extensively shorter, and the new peaks emerging allude to a liquid phase formation.
4. Summary and Conclusion
The molecular dynamics (MD) simulations were carried out to investigate the characteristics of the ground state configuration predicted for the Ti32 nanocluster. The thermal agitation shows the dominance of icosahedra, and pentagonal bipyramid geometries below 2000 K. As the temperature increases, the ordering of configurations or isomers changes are noticeable by a change in the morphology of the cluster at 400 K. We also observed a jump in the potential energy at 2000 K which is closer to the melting temperature of bulk Ti suggesting a transition from a solid phase to a liquid phase. The maxima in the potential energy occur at a temperature above bulk melting. However, upon cooling, the nanocluster is mostly solid below the melting temperature. We notice a weak hysteresis at 2000 K due to the structural changes as we cool the temperature.
As a consequence, the cooling transition occurs close to the melting temperature with the nanocluster, which is equivalent to the initial one. The diffusion coefficient results suggest no movement of atoms at temperatures below 1941.15 K; thus, the diffusivity reverts to zero. A noticeable vibration is observed above 2000 K, resulting in a jump in diffusivity at 2100 K. The RDFs shows the peaks decreasing with increasing temperature, and the density profiles reveal the melting temperature behaviour beyond bulk melting temperature, where atomic distribution becomes broader and shorter, and the new peaks emerging.
Acknowledgements
The work was carried out at the Materials Modelling Centre, the University of Limpopo, in collaboration with the University College London, the UCL Faraday high performance computing and the Centre for High-Performance Computing (CHPC) in South Africa. We also acknowledge the support from the South African Research Chair Initiative of the Department of Science and Technology, the National Research Foundation and the Royal Society Advanced Fellowship Newton Grant (NA140447).
Supplementary Material
Supplementary information is provided in the online supplement.
ORCID iDs
IM. Phaahla: orcid.org/0000-0002-0878-2532
A.A. Sokol: orcid.org/0000-0003-0178-1147
C.R.A. Catlow: orcid.org/0000-0002-1341-1541
SM. Woodley: orcid.org/0000-0003-3418-9043
P.E. Ngoepe: orcid.org/0000-0003-0523-5602
H.R. Chauke: orcid.org/0000-0003-2603-5941
References
1 J.D. Aiken III, Y Lin, R.G. Finke and J. Mol, A perspective on nanocluster catalysis: polyoxoanion and (n-C4H9)4N+ stabilized Ir(0)~300 nanocluster 'soluble heterogeneous catalysts', J. Mol. Catai. A: Chem., 1996,114, 29-51. [ Links ]
2 U. Simon, G. Schon and G. Schmid, The application of Au55 clusters as quantum dots, Angew. Chem. Int. Ed. Engl., 1993, 32, 250-254. [ Links ]
3 V.L. Colvin, M.C. Schlamp and A.P. Alivisatos, Light-emitting diodes made from cadmium selenide nanocrystals and a semiconducting polymer, Nature, 1994, 370, 354. [ Links ]
4 R. Pool, Clusters: Strange morsels of matter: when metals or semiconductors are shrunk down to clumps only 10 or 100 atoms in size, they become a "totally new class of materials" with potentially valuable applications, Science, 1990, 248, 1186. [ Links ]
5 M. Schmidt, R. Kusche, W. Kronmuller, B. Von Issendorff and H. Haberland, experimental determination of the melting point and heat capacity for a free cluster of 139 sodium atoms, Phys. Rev. Lett., 1997, 79, 99. [ Links ]
6 F. Ercolessi, W. Andreoni and E. Tosatti, Melting of small gold particles: mechanism and size effects, Phys. Rev. Lett., 1991, 66, 911. [ Links ]
7 M. Schmidt, K. Kusche, B.V. Issendorff and H. Haberland, Irregular variations in the melting point of size-selected atomic clusters, Nature, 1998, 393, 238. [ Links ]
8 K.F. Peters, J.B. Cohen and Y.-W. Chung, Melting of Pb nanocrystals, Phys. Rev. B, 1998, 57 13430. [ Links ]
9 R.R. Couchman, The Lindemann hypothesis and the size dependence of melting temperatures. II, Philos. Mag. A, 1979, 40, 637. [ Links ]
10 S.C. Hendy and B.D. Hall, Molecular-dynamics simulations of lead clusters, Phys. Rev. B, 2001, 64, 085425. [ Links ]
11 P. Labastie and R.L. Whetten, Statistical thermodynamics of the cluster solid-liquid transition, Phys. Rev. Lett., 1990, 65, 1567. [ Links ]
12 F. Calvo and R. Spiegelman, Mechanisms of phase transitions in sodium clusters: From molecular to bulk behavior, J. Chem. Phys., 2000, 112, 2888. [ Links ]
13 J.Y. Lee, E.K. Lee and R.M. Nieminem, Effect of potential energy distribution on the melting of clusters, Phys. Rev. Lett., 2001, 86, 999. [ Links ]
14 D.J. Wales and R.S. Berry, Freezing, melting, spinodals, and clusters, J. Chem. Phys., 1990, 92, 4473. [ Links ]
15 M. Schmidt, J. Donges, Th. Hippler and H. Haberland, Influence of energy and entropy on the melting of sodium clusters, Phys. Rev. Lett., 2003, 90, 103401. [ Links ]
16 M. Schmidt and H. Haberland, Phase transitions in clusters, C. R. Physique, 2002, 3, 327. [ Links ]
17 Y.G. Chushak and L.S. Bartell, Melting and freezing of gold nanoclusters, J. Phys. Chem. B, 2001, 105, 11605. [ Links ]
18 B.Wang, G. Wang,X. Chen and J. Zhao, Melting behavior of ultrathin titanium nanowires, Phys. Rev. B, 2003, 67, 193403. [ Links ]
19 C.L. Cleveland, W.D. Luedtke and U. Landman, Melting of gold clusters, Phys. Rev. B, 1999, 60, 5065-5077. [ Links ]
20 J.P. Borel, Thermodynamical size effect and the structure of metallic clusters, Surf. Sci., 1981,106, 1. [ Links ]
21 J. Bovin, R. Wallenbreg and D. Smith, Imaging of atomic clouds outside the surfaces of gold crystals by electron microscopy, Nature, 1985, 47, 317. [ Links ]
22 J. Luo, U. Landman and J. Jortner, 1987, Physics and Chemistry of Small Clusters (P. Jena, B.K. Rao and S.N. Khanna, eds.), Plenum, New York, USA, p. 201. [ Links ]
23 T.P. Martin, Alkali halide clusters and microcrystals, J. Phys. Rep., 1983, 95, 167. [ Links ]
24 G. Breaux, D. Hillman, C Neal., R. Benirschke and M. Jarrold, Gallium Cluster "Magic Melters", J. Am. Chem. Soc., 2004,126, 8628. [ Links ]
25 G. Breaux, B. Cao and M.F. Jarrold, Second-order phase transitions in amorphous gallium clusters, J. Phys. Chem. B, 2005, 109, 16575. [ Links ]
26 T. Lazauskas, A.A. Sokol, J. Buckeridge, C.R.A Catlow., S.G.E.T. Escher, M.R. Farrow, D. Mora-Fonz, V.W. Blum, T.M. Phaahla, H.R. Chauke, P.E. Ngoepe and S.M. Woodley, Thermodynamically accessible titanium clusters TiN, N = 2-32, Phys. Chem. Chem. Phys., 2018, 20, 13962-13973. [ Links ]
27 S.M. Woodley, Knowledge Led master code search for atomic and electronic structures of LaF3 nanoclusters on hybrid rigid ion-shell model-DFT landscapes, J. Phys. Chem. C., 2013,117, 24003-24014. [ Links ]
28 J.D. Gale and A.L. Rohl, The General Utility Lattice Program (GULP), Mol. Simul., 2003, 29, 291-341. [ Links ]
29 V. Blum, R. Gehrke, F. Hanke, P. Havu, V Havu, X. Ren, K. Reuter and M. Scheffler, Ab initio molecular simulations with numeric atom-centered orbitals, Comp. Phys., 2009,180, 2175-2196. [ Links ]
30 R.P. Gupta, Lattice relaxation at a metal surface, Phys. Rev. B, 1981,23, 6265. [ Links ]
31 F. Cleri and V. Rosato, Tight-binding potentials for transition metals and alloys, Phys. Rev. B, 1993, 48, 22. [ Links ]
32 D. Tomanek, A.A. Aligia and C.A. Balseiro, Calculation of elastic strain and electronic effects on surface segregation, Phys. Rev. B, 1985, 32, 5051. [ Links ]
33 Official DL_POLY_4 website at: https://www.scd.stfc.ac.uk/Pages/DL_POLY.aspx [ Links ]
34 W. Hoover, Canonical dynamics: equilibrium phase-space distributions, Phys. Rev. A, 1985, 31, 1695-1697. [ Links ]
35 S.K.R.S. Sankaranarayanan, V.R. Bhethanabotla and J. Babu, Molecular dynamics simulation study of the melting of Pd-Pt nanoclusters, Phys. Rev. B, 2005, 71, 195415. [ Links ]
36 M.C. Steele and R.A. Hein, Superconductivity of titanium, Phys. Rev., 1953, 92, 243-247. [ Links ]
37 C. Kittel, 2004, Introduction to Solid State Physics, 8th edn., John Wiley & Sons, New York, USA. [ Links ]
38 Y. Qi, T. Çagin, W.L. Johnson and W.A. Goddard, Melting and crystallization in Ninanoclusters: the mesoscaleregime,J. Chem. Phys.,2001, 115, 385. [ Links ]
39 C. Majumder, V. Kumar, H. Mizuseki and Y. Kawazoe, Small clusters of tin: atomic structures, energetics, and fragmentation behavior, Phys. Rev. B, 2001, 64, 233405. [ Links ]
40 K. Joshi, D.G. Kanhere and S.A. Blundell, Abnormally high melting temperature of the Sn10 cluster, Phys. Rev. B, 2002, 66, 155329. [ Links ]
41 A.S. Barnard, Modelling of nanoparticles: approaches to morphology and evolution, J. Rep. Prog. Phys., 2010, 73, 086502. [ Links ]
42 S.L. Gafner, L.V Redel and Y.Y. Gafner, Simulation of the processes of structuring of copper nanoclusters in terms of the tight-binding potential J. Exp. Theor., 2009, 108, 784-799. [ Links ]
Received 16 April 2020
Revised 2 August 2021
Accepted 29 September 2021
* To whom correspondence should be addressed. E-mail: hasanl.chauke@ul.ac.za
Supplementary Data
The supplementary data is available in pdf: [Supplementary data]

