


Services on Demand
Article
 English (pdf)
 Article in xml format
 Article references
Indicators

Related links
-
 Cited by Google
 -
 Similars in Google
Share

 Permalink
South African Journal of Chemistry
On-line version ISSN 1996-840X
Print version ISSN 0379-4350
S.Afr.j.chem. (Online) vol.75 Durban 2021
http://dx.doi.org/10.17159/0379-4350/2021/v75a20
RESEARCH ARTICLE
Lipidomic Profile of Rhodotorula toruloides by GC/MS and Antioxidant Capacity of the Oil by DPPH and TLC-Plate Methods
Alberdan S. SantosI, *; Hugo L. C. SalgadoI; Nemailla BonturiII; Ricardo F. A. de MelloI; Laiza de Κ. M. da ConceiçãoI; Everson A. MirandaII, *
ILaboratory of Systematic Investigation in Biotechnology and Molecular Biodiversity. Federal University of Pará / ICEN, Belém-Pará, Brazil. 66075-110
IIUniversity of Campinas, Department of Materials and Bioprocess Engineering, School of Chemical Engineering, Campinas-São Paulo, Brazil. 13083-852
ABSTRACT
This work was undertaken to evaluate the antioxidant capacity of Rhodotorula toruloides lipid extract in TLC plate, using the (DPPH) (1,1-diphenyl-2-picril-hydrazine) method as an innovative way to visualise lipid groups that comprise this activity. Similarly, carotenoids and crude oil were analysed for antioxidant capacity by the DPPH and β-carotene/linoleic acid methods. The lipidomic profile extract analysis was performed by GC/MS and HPLC/DAD. The sample preparation for the GC/MS analysis was made by ultrasound-assisted transesterification. Free compounds were silylated with BSTFA (N,O-Bis (trimethylsilyl) trifluoracetamide) + 1% TMCS (Trimethylchlorosilane). The analysis of the lipid extract showed that in the saponifiable fraction saturated fatty acids (SFA) and monounsaturated fatty acids (MUFA) were present; and in the unsaponifiable fraction were steroids and carotenoids. The antioxidant capacity was expressed as IC50 reaching 6.4 mg/L that means relative efficiency. The oil profile, using TLC, shows the chemical groups: carotenoids, acylglycerols, free fatty acids and steroids. Similarly, the GC/ MS analysis shows the fatty acids and steroids. The HPLC analysis describes the carotenoids profile, highlighting b-carotene as the majority and the presence of ß-carotene-5,8-epoxide, zeaxanthin and b-cryptoxanthin, characterising the lipidomic study of this yeast.
Keywords: DPPH-TLC, lipid metabolite classes, TLC-antioxidant system.
1. Introduction
Lipidomics is a branch of metabolomics based on the study of all lipids produced by prokaryote or eukaryote cells, the molecules they interact with, and their function within the cell.1,2 Recent advances in soft-ionisation mass spectrometry combined with established separation techniques have allowed the rapid and sensitive detection of various lipid species with minimal sample preparation.3 A 'lipid profile composition' from a crude lipid extract analysed by GC/MS is the set of all lipid molecules mass spectra represented as a set of picks in a chromatogram, each pick identified and its abundance quantified. This kind of analysis can be used to monitor profile changes over time in response to a particular stimulus. As a preliminary lipid profile analysis, thin-layer chromatography (TLC) is a simple, cheap, and fast separation planar method to investigate complex lipids mixtures. All these aspects make TLC a convenient choice for many applications, including analytical, bio-medical and pharmaceutical fields,4,5,6 highlighting the screening of plant or microbial cells extracts for the systematic investigation of biologically active compounds, like carotenes.7
In order to avoid laborious and time-consuming isolation of individual compounds by HPLC-prep, TLC-plate based assays have been proposed to assess the biological activity of separated compounds.6 Based on decolourising of the purple DPPH-, many variants of antiradical measurements have been suggested.8 However, determination of the antioxidant potential and radical scavenging activity for each compound contained in a complex mixture is hardly a possible task. Therefore, the search for new, easy, rapid, and cheap methods for screening the free-radical scavenging potential of individual compounds contained within complex mixtures is still in a continuing development.5
A variety of methods is used to determine the radical scavenging capacity of pure individual compounds. The most popular of these methods is the spectrophotometric method, based on the colour reaction between an antioxidant and a relatively stable radical. Some examples are the oxygen radical absorbance capacity (ORAC), ferric reducing antioxidant power (FRAP), Trolox equivalent antioxidant capacity (TEAC) assay, β-carotene bleaching test, lipid peroxidation assays, ABTS+ (2,20-azinobis-(3-ethylbenzothiazoline-6-sulphonic radical cation) or DPPH- (2,2-diphenyl-1-picrylhydrazyl radical).6 Scavenging of the DPPH* radical is the basis of the popular DPPH antioxidant assay.9,10 In solution, DPPH- is characterised by the intense purple colour that changes into pale yellow in the presence of a free radical scavenger. This stable free radical accepts an electron or hydrogen radical to become a stable diamagnetic molecule.6 The DPPH method may be utilised in aqueous and nonpolar organic solvents and can be used to examine both hydrophilic and lipophilic antioxidants.11
In recent years, an explosion of interest has been observed in the search for antioxidants in natural products.12 However, the search for new sources of antioxidants is increasingly directed towards microorganisms as potential producers.13,14 Bacteria, algae, yeasts, and filamentous fungi that are able to accumulate more than 20% lipids in their dry biomass are considered SCO (single cell oil). In some cases, the composition of its triglycerides (TAGs) is similar to the ones in edible oils and fats obtained from vegetable and animal sources15. SCO can be used as raw material for several products, such as biodiesel by transesterification,16 fungicides, bactericides, polyols, surfactants, and lubricants.17
Among the oleaginous microorganisms, the yeast R. toruloides has gained attention due to its ability to accumulate up to 70% of lipids.18 Culturing this microorganism on lignocellulosic hydrolysates19,20 also produces valuable molecules such as carotenoids,21,22 cephalosporin esterase and epoxy hydrolases,23 also R. toruloides has been genetically manipulated to improve matabolite production.24
Isolation, enrichment, and extraction of lipid components of interest from the yeast can vary in the degree of selectivity of solvent and the strategy used in the selected methodology. Liquid-liquid extraction (LLE) is one of the oldest pre-concentration and matrix isolation techniques in analytical chemistry. Traditional techniques used for the solvent extraction of natural products are associated with long extraction times and low yields, a large volume of organic solvents and poor extraction efficiency. Ultrasound is an effective technique to overcome these problems by improving the extraction rate by increasing the mass transfer rates and possible cell wall rupture due to the formation of microcavities5 and is useful in natural product extraction.25
Since the TLC is a fast and efficient analytical technique, its application as a lipidomic tool is restricted to detect metabolites classes or subclasses.26,27 In this work was restricted to lipid subclasses and would contribute to understanding the metabolite composition of this biological source and set up a base case for biochemical applications. Therefore, the objective of this work was to evaluate the lipidomic profile of the yeast R. toruloides cultivated in a submerse condition by GC/MS and its antioxidant activity by TLC on an individually separated lipid subclass.
2. Experimental Procedures
2.1. Microorganism, its cultivation and the oil
The yeast Rhodotorula toruloides CCT 0783, previously called Rhodosporidium toruloides, was obtained from the Tropical Culture Collection "Fundação André Tosello", in the city of Campinas, Brazil, and adapted to grow on sugarcane bagasse hemicellulosic hydrolysate.21
2.2. Chemicals and standard solutions
The standard of trans-ß-carotene synthetic, phosphomolybdic acid, vanillin and 2,2-diphenyl-1-picrylhydrazyl radical (DPPH-) were purchased from Sigma-Aldrich (Merck, Darmstadt Germany). Acetonitrile (ACN) and ethyl acetate (EtOAc) for analysis by HPLC were of spectroscopy purity grade, ethanol (EtOH), methanol (MeOH), hexane, acetone, ether diethyl, and dichloromethane (CH2Cl2) were of analytical purity grade, all from Tedia (Rio de Janeiro, Brazil). Sulfuric acid was obtained from Synth (Rio de Janeiro, Brazil). TLC was performed on the 3 cm x 5 cm pre-coated TLC sheets ALUGRAM Xtra SIL G/UV254 HPTLC plates (Macherey-Nagel, Germany). Bis(trimethylsilyl) trifluoroacetamide (BSTFA- 1% TCMS) were purchased from Regis Technologies (PhyladelphiaUSA). TLC preparative was carried on TLC plate glass (1000 μιτι, 10 X 20 cm, F254) Ultrapure Silicaplate Prep (Silicycle, Quebec Canada).
2.3. Preparation of the oil in natura for analysis
A mass of 200 mg of crude oil obtained from the cells was transferred to a glass test tube with 1.0 cm (diameter) X 10 cm (height), and 5.0 ml of DCM: MeOH (2:1) were added. The test tube was kept in an ultrasound water bath at 40 kHz and 45°C for 30 s. The ultrasonic power inside the extract container was estimated to be 70 W.cm-2 and a manufacturer power rating of 130 W After complete solubilisation of the oil, the mixture was centrifuged at 6720 g for 3 minutes, the supernatant removed, and the solvent was evaporated, yielding 118.8 mg of oil.
2.4. Derivatisation of prepared oil
The oil was transesterified by adding 3.0 mL of the solution to 4% H2SO4 in MeOH and stirring the mixture under sonication in an ultrasound water bath at 40KHz and 55°C for 20 minutes. The ultrasonic power inside the extract container was estimated to be 70 Wcm-2 and a manufacturer power rating of 130 W A volume of 4.0 mL distilled water and 3.0 mL of n-hexane were added. The mixture was stirred vigorously for 30 s and centrifuged at 6720 g. Then 2.0 mL of the upper phase was transferred to a screw-capped tube, and the solvent was evaporated in a turbovap concentrator. The lipids were silylated by adding 100 μL of BSTFA and kept under a dry bath at 30°C and 400 rpm for 1 h. Then, 500 μL hexane was added, and the sample was analysed with GC/MS (gas chromatograph - mass spectrometer).
2.5. Gas chromatography-mass spectrometry analysis (GC/MS)
GC/MS analysis was performed with a Thermo Scientific Trace 1300 gas-chromatograph equipped with an RTX-5TG-RESTECK column (30 m X 0.25 mm; coating thickness 0.25 mm) and a Thermo Scientific ISQ (ionization single quadrupole) mass detector. The analytical conditions were operated with injector and transfer line temperatures at 220°C and 280°C, respectively. The electronic ionisation was set at 70 eV The oven temperature programming started at 50oC and went up to 200°C at a rate of 8°C min-1, ramped to 300°C at 10°C min-1, kept held for 5 min, ramped again at 10 °C min-1 to 350°C, and kept held for 15 min. Helium was used as carrier gas at a flow rate of 1ml/min. 1 μL of the sample was injected at splitless mode. The mass spectrometer (MS) was operated in scan mode (start after 3 min, mass range from 40-1000 a.m.u. at 1 scan/s). Identification of the constituents was based on a comparison between the linear retention indices, obtained by homologous hydrocarbons, and their retention times; followed of the comparison of the compounds mass spectra against commercial (NIST2011-WILEI2009-FAMES2011) and homemade library mass spectra built up from pure substances and components of known oils, as well as the literature mass spectra data.
2.6. Qualitative chemical profile of the oil by TLC
To separate compounds from the crude oil, volumes of fy/L were applied to TLC plate as bands, instead of spots, at 0.8 cm above the base line and from 0.2 cm the edges of the plate. After the plates were dried in air for 15 min, they were developed at room temperature by ascending chromatography in a developing chamber saturated with the vapour of the mobile phase. All runs were carried out at 24°C ± 1°C.
The mobile phase was a mixture of hexane, diethyl ether, and acetone at a ratio of 80:20:5 (v/v/v). A volume of 10 mL of the mobile phase was enough for each elution. The run solvent elution distance from the baseline to the top line was 4 cm. After the elution, the plates were dried at 28°C for 15 min and prepared for the revelation by spraying them with a mixture of solution A (vanilin 1% m/v in ethanol) and solution B (sulfuric acid 10% v/v in ethanol, (1:1)). The qualitative identification of the compounds present in the crude oil was performed by comparing the retention times obtained to those described by Salgado.28
2.7. Preparation of carotenoid-rich fraction by preparative TLC
The same conditions established to determine the qualitative chemical profile of the oil by TLC were used to develop the TLC on a preparative scale to obtain a carotenoid enriched fraction of the crude oil. An aliquot of 20 mg of the crude oil was diluted in 5 mL of diethyl ether and applied to a preparative chromatographic plate (glass support, dimensions 10 cm X 20 cm, 1000 μιτι silica gel layer with F254 indicator). After elution, a yellow-orange band (Rf = 0.85), corresponding to the carotenoids, was separated from the others near the top line of the chromatographic plate. This band was removed (scraped) from the plate, and the carotenoids were extracted from silica with diethyl ether. After the solvent evaporation, this fraction was analysed by HPLC for carotenoids identification.
2.8. Antioxidant activity bioassay by the DPPH free radical scavenging method
The radical donation ability of the oil sample was measured by the bleaching of a purple-coloured methanol solution of DPPH (2, 2'- diphenyl-1-picrylhydrazyl). For revelation, the TLC plates were immersed for 3 s in freshly prepared 0.1% (m/v) DpPH-radical methanolic solution. After removing DPPH- excess, the plates were immediately dried in air at 60°C. Antioxidants compounds were identified by yellowish band colour and co-chromatography with the pure compound.28
2.9. Antioxidant activity (β-carotene / linoleic acid system)
The antioxidant capacity of the oil was evaluated according to a β-carotene/linoleic acid model co-oxidation system of substrates according to the modified methodology described in29,30 in triplicates.
The reactive mixture was prepared as follows: 40 of linoleic acid, 14 drops of Tween-40, 50 of a ß-carotene solution (0.02 g of ß-carotene diluted in 1 mL of chloroform) and 1 mL of chloroform were added in a 250 mL beaker. The mixture was subjected to complete evaporation of chloroform, and 350 mL of oxygen saturated water were added. The mixture was stirred vigorously for 30 min. The reactive mixture was immediately measured at 470 nm in the absorbance range of 0.6 and 0.7. The sample masses were measured and separated according to the established concentration and then solubilised in a 7:3 acetone:ethyl acetate mixture. Therafter, 400 of the solubilised sample was added to the test tubes, and 5 mL of the reactive mixture was added to each tube. They were incubated at 40°C to initiate ß-carotene bleaching. The absorbance at 470 nm measurement was performed at 15 min intervals for 120 min (Shimadzu spectrophotometer model UV-1800). The results were expressed as the percentage of oxidation inhibition, calculated as the absorbance decay of a control (Ac), which should be less than 0.2 to be considered with 100% oxidation after 120 min of reaction. The sample absorbance decay (Aam) was correlated with the decay of the control (Ac), as well as the percentage of oxidation inhibition (%I). See equation (1) through (3):

2.10. High-performance liquid chromatography analysis
The method for analysing the carotenoid profile by HPLC was adapted from.31 The analysis was performed in an Ultra-Fast Liquid Chromatography (UFLC, Proeminence-LC20A, Japan) system coupled to a photodiode array (PDA) ultraviolet detector (UV-Vis-SPD-20A) with a binary solvent pumping system, degasser "Online" DGU-20A with auto-sampler and controlled CMB-20A. The separation was carried out in a reverse-phase column Kromasil ODS-5-C18 (5μΐη, 4.6 x 150 mm) from Akzo Nobel (Sweden) in isocratic elution mode with the following mobile phase: solvent A (100% ACN) and solvent B (EtOAc/ MeOH; 2:1, v/v) in the ratio of A:B (85:10). The injection volume was 10 ^L, and the column was maintained at 28°C with a total elution time of 60 minutes. The mobile phase flow was 0.95 mL/ min. The absorption spectra were recorded in the 200 to 800 nm range, and the chromatogram was processed at 450 nm.
3. Results and Discussion
3.1. General aspects
3.1.1.Cultivation and lipid extraction
The cell cultivation yields approximately 1 kg of cell paste from which the lipids were extracted in many batches, resulting in a lipid content from 65-73% of dried cell mass and a volume of approximately 50 mL.
3.1.2.TLC profile of the oil
The oil extracted from the cells had a predominance of triacylglycerol-TAG (Rf 0.67), followed by carotenoids (Rf 0.85), monoacylglycerol-MAG (Rf 0.05), steroids (Rf 0.12), and phospholipids (Rf 0.0). Diacylglycerol-DAG (Rf 0.30) and free fatty acids - FFA(AGL) - (Rf 0.37) were also present at minor concentrations (Figure 1).

The plate in Figure 1 presents a band with a good intensity of carotenoids near the top line with Rf 0.85. Thus, it can be inferred that the separation of these carotenoids will not present difficulties if the same solvent ratio is applied. The elution-based separation proved to be quite efficient for this sample.
3.1.3.Sample derivatisation for lipidomic analysis by GC/MS
The oil from R. toruloides has a lipid composition composed of saturated long-chain fatty acids with a predominance of unsaturated fatty acids and steroids (Figure 2). The complete analysis of the oil involving all classes of lipids in a single run is not a trivial task. The reason is that the selection of chromatographic columns and the analysis methodologies become relevant variables.
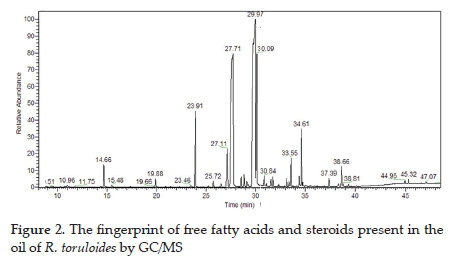
For this reason, the derivatization technique involved two steps: transesterification and trimethylsilylation to analyse the free fatty acids, sterols, triterpenes, and phospholipids that were present in the oil sample. It was observed that the trimethylsilylated substances (TMS) are those that were initially free in the oil, and the fatty acid methyl esters are those that were initially bound to glycerol (acylglycerol).
The oil is constituted of the two unsaturated and one saturated fatty acids as the main constituents: octadecenoic acid (48.29%), octadecanoic acid (7.20%) and hexadecenoic acids (26.96%), (Table 1). The relevant points of the analysis that differ from the analysis performed by other researchers are that lipidomic techniques detect and quantify the substances that were not quantified previously. In this case, the steroids, the glycerol, the acylglycerols, the isomers, and the derivatised substances stand out because they were free in the oil. In this same sense, the composition differs from the ones reported,16,20 although with the same relative trend.

The minority components of the oil (<2.60%) were the unsaturated fatty acids 9-hexadecenoic, 10-heptadecenoic, and 11-eicosenoic, the saturated fatty acids decanoic, dodecanoic, tetradecanoic, pentadecanoic, heptadecanoic, eicosanoic, docosanoic, and tetracosanoic. Despite the low concentrations, these fatty acids may find applications in food,32 cosmetics,33 and biodiesel industries.34,35 It is important to highlight that different microorganisms and culture conditions may yield different oil compositions and content.36
These results are in agreement with literature on the lipid profile of yeast oil such as the fatty acids: hexadecanoic (11-37%), hexadecenoic (1-6%), octadecanoic acid (1-10%) and octadecenoic acid (28-66%).37 The presence of free fatty acids, monoacylglycerols (such as 2-monopalmitin (0.22%), 1-monopalmitin (0.89%), 1-monoolein (2.7%), 1-monolinolein (0.17%)) and diacylglycerols ( such as 1,3-dipalmitin (0.43%)) can be observed by the corresponding silylated compounds (TMS), which are related to the acidity of the oil and were derived from hexadecanoic, octadecenoic, and octadecanoic acids. The oil also contains steroidal substances, such as ergosterol and beta-sitosterol, in their free form.
3.1.4.Antioxidant activity by DPPH on TLC plate
The assay for antioxidant activity by DPPH- showed a slightly yellowish staining band on the HPTLC plate at Rf of 0.85 (Figure 3a) corresponding to ß-carotene. The same band is present as a purple band after revelation with VAS (Figure 3b). The comparison with the β-carotene standard band (Figure 3c) confirmed the presence of carotenoids in the oil.

Identifying the antioxidant activity of the carotenoids with DPPH- reagent showed the practicality of the TLC technique in determining the antioxidant action of a certain matrix with low cost and speed in performing profile analyses of compounds that may exhibit biological activities.38
3.1.5.Antioxidant activity via β-carotene / linoleic acid system The antioxidant activity carried out with the integral oil
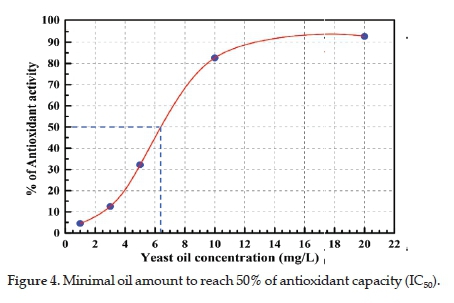
evaluated with the ß-carotene/linoleic acid system presented a decay of 82.69% with 10.00 mg/L of oil, showing the relevance of fractionating this oil to obtain a carotenoid concentrate (Table 2). The ß-carotene/linoleic acid system was more effective to determine the antioxidant activity than the DPPH method due to its greater affinity to liposoluble than hydro soluble substances. The use of antioxidants slows down the absorbance decay of ß-carotene, which protects the lipid substrates from oxidation. The values for the discolouration of ß-carotene expressed as a percentage of antioxidant capacity (% AC) after 120 min of reaction are reported in Table 2.

The determination of AC-IC50 through plotting the absorbance at 470 nm as a function of oil concentration used in the period established for each assay showed that 6.80 mg/L of oil has the potential of 50% protection against the radical action. The IC50 approached 6.40 mg/L, which means great efficiency due to the result being obtained from the integral oil and not from the isolated fraction (Figure 4).
3.1.6. HPLC analysis of carotenes profile
The group of substances detected in Rf 0.85 was confirmed as carotenoids. This enriched fraction was isolated by preparative TLC (Figure 3). HPLC analysis of this fraction showed four compounds (Table 3). β-carotene content was 87.09% which corresponds to the antioxidant activity shown in Figure 3.

The HPLC analysis showed that the enriched fraction was not a complex mixture. Peaks were identified from the typical absorption spectrum data, between 200-800 nm. The data for retention time (RT), wavelengths of maximum absorption (Xmax), fine structure (% III / II), identification of carotenes, and the relative percentage area of the peak (Area%) contributed to the inferences about the identity of the constituents present when compared with data of reference standards (Table 3). Analysis of the yeast oil by HPLC showed a ß-carotene-rich composition (Figure 5), corroborating the complex lipid composition presented by this oil.

4. Conclusions
The TLC qualitative profile of the oil was an important tool for analysing plate bands by the colouration intensity and Rf, from which it was possible to classify all lipid subclasses present in the sample. Lipidomic techniques, plate TLC, and hyphenated chromatography detected and quantified substances that were not quantified previously, such as steroids, glycerol, acylglycerols, isomers, and compounds that were free in the oil. The antioxidant activity with DPPH- reagent showed a potential of the R. toruloides oil associated with the ß-carotene present, evidencing the practicality of the TLC technique in determining the antioxidant capacity of the subclasses present in a complex matrix, with low cost and speed.
Acknowledgement
The authors are grateful to CAPES, FAPESPA, and FAPESP for financial support. Thanks also to Dra. Sindélia Freitas for the use of the fermentation facility at CTBE (Brazil).
ORCID iDs
Alberdan Santos: https://orcid.org/0000-0003-1863-176x
Nemailla BonturI: https://orcid.org/0000-0003-4867-8286
Ricardo F. A. de Mello: https://orcid.org/0000-0001-7583-0402
Laiza de K. M. da Conceição: https://orcid.org/0000-0003-3321-5078
Everson A. Miranda: https://orcid.org/0000-0002-8594-2130
References
1 J. Wang, C. Wang., Han X. Tutorial on lipidomics. Anal. Chim. Acta. 2019;1061:28-41. [ Links ]
2 M.R. Belhaj, N.G. Lawler, and N. J. Hoffman metabolomics and lipidomics: Expanding the molecular landscape of exercise biology. Metabolites.2021, 11(3), 1-34. [ Links ]
3 A.D. Watson, Lipidomics: a global approach to lipid analysis in biological systems, J. Lipid Res. 2006, 47, 2101-2111. [ Links ]
4 F. Soponar, A.C. Mo J, C. Sârbu, Quantitative determination of some food dyes using digital processing of images obtained by thin-layer chromatography, J. Chromatogr. A. 2008, 1188, 295-300. [ Links ]
5 S.R. Shirsath, S.H. Sonawane, PR. Gogate, Intensification of extraction of natural products using ultrasonic irradiations-A review of current status, Chem. Eng. Process. Process Intensif. 2012, 53, 10-23. [ Links ]
6 L. Ciesla, J. Kryszen, A. Stochmal, W. Oleszek, M. Waksmundzka-Hajnos, Approach to develop a standardized TLC-DPPH test for assessing free radical scavenging properties of selected phenolic compounds, J. Pharm. Biomed. Anal. 2012, 70, 126-135. [ Links ]
7 W. Stahl, H. Sies, Antioxidant activity of carotenoids, Mol. Aspects Med. 2003, 24, 345-351. [ Links ]
8 S. B. Kedare and R. P. Singh. Genesis and development of DPPH method of antioxidant assay. J Food Sci Technol. 2011, 48(4): 412-422. [ Links ]
9 M.S. Blois, Antioxidant determinations by the use of a stable freeradical, Nature. 1958, 181, 1199-1200. [ Links ]
10 O.P. Sharma, T.K. Bhat, DPPH antioxidant assay revisited, Food Chem. 2009, 113, 1202-1205. [ Links ]
11 S.B. Kedare, R.P Singh, Genesis and development of DPPH method of antioxidant assay, J. Food Sci. Technol. 2011, 48, 412-422. [ Links ]
12 O. Anjos, R. Fernandes, S.M. Cardoso, T. Delgado, N. Farinha, V Paula, L.M. Estevinho, S.T. Carpes, Bee pollen as a natural antioxidant source to prevent lipid oxidation in black pudding, LWT. 2019, 111, 869-875. [ Links ]
13 E. Uugantsetseg, B. Batjargal, Antioxidant activity of probiotic lactic acid bacteria isolated from Mongolian airag, Mong. J. Chem. 2014, 15, 73-78. [ Links ]
14 M.K. Kim, H. Park, T.J. Oh, Antioxidant properties of various microorganisms isolated from arctic lichen Stereocaulon spp., Korean J. Microbiol. Biotechnol. 2013, 41 350-357. [ Links ]
15 C. Ratledge, J.P Wynn, The biochemistry and molecular biology of lipid accumulation in oleaginous microorganisms, Adv. Appl. Microbiol. 2002, 51, 1-51. [ Links ]
16 Q. Li, W. Du, D. Liu, Perspectives of microbial oils for biodiesel production, Appl. Microbiol. Biotechnol. 2008, 80, 749-756. [ Links ]
17 M. Jin, PJ. Slininger, B.S. Dien, S. Waghmode, B.R. Moser, A. Orjuela, L. da C. Sousa, V Balan, Microbial lipid-based lignocellulosic biorefinery: Feasibility and challenges, Trends Biotechnol. 2015, 33, 43-54. [ Links ]
18 J.M. Ageitos, J.A. Vallejo, P Veiga-Crespo, T.G. Villa, Oily yeasts as oleaginous cell factories, Appl. Microbiol. Biotechnol. 2011, 90, 1219-1227. [ Links ]
19 Z. Zhu, S. Zhang, H. Liu, H. Shen, X. Lin, F. Yang, Y.J. Zhou, G. Jin, M. Ye, H. Zou, Z.K. Zhao, A multi-omic map of the lipid-producing yeast Rhodosporidium toruloides, Nat. Commun. 2012, 3. [ Links ]
20 N. Bonturi, L. Matsakas, R. Nilsson, P Christakopoulos, E.A. Miranda, K.A. Berglund, U. Rova, Single Cell Oil Producing Yeasts Lipomyces starkeyi and Rhodosporidium toruloides: Selection of Extraction Strategies and Biodiesel Property Prediction, Energies. 2015, 8, 5040-5052. [ Links ]
21 N. Bonturi, A. Crucello, A.J.C. Viana, E.A. Miranda, Microbial oil production in sugarcane bagasse hemicellulosic hydrolysate without nutrient supplementation by a Rhodosporidium toruloides adapted strain, Process Biochem. 2017, 57, 16-25. [ Links ]
22 T. Schneider, S. Graeff-Hönninger, WT. French, R. Hernandez, N. Merkt, W. Claupein, M. Hetrick, P. Pham, Lipid and carotenoid production by oleaginous red yeast Rhodotorula glutinis cultivated on brewery effluents, Energy. 2013, 61, 34-43. [ Links ]
23 Z. Zhu, S. Zhang, H. Liu, H. Shen, X. Lin, F. Yang, Y.J. Zhou, G. Jin, M. Ye, H. Zou, Z.K. Zhao, A multi-omic map of the lipid-producing yeast Rhodosporidium toruloides, Nat. Commun. 2012, 3, 1112. [ Links ]
24 S. Zhang, M. Ito, J.M. Skerker, A.P Arkin, C. V Rao, Metabolic engineering of the oleaginous yeast Rhodosporidium toruloides IFO0880 for lipid overproduction during high-density fermentation, Appl. Microbiol. Biotechnol. 2016, 100, 9393-9405. [ Links ]
25 F. Chemat, N. Rombaut, A.G. Sicaire, A. Meullemiestre, A.S. Fabiano-Tixier, M. Abert-Vian, Ultrasound assisted extraction of food and natural products. Mechanisms, techniques, combinations, protocols and applications. A review, Ultrason. Sonochem. 2017, 34, 540-560. [ Links ]
26 E. Guzelmeric, P. Ristivojević, J. Trifković, T. Dastan, O. Yilmaz, O. Cengiz, E. Yesilada, Authentication of Turkish propolis through HPTLC fingerprints combined with multivariate analysis and palynological data and their comparative antioxidant activity, LWT - Food Sci. Technol. 2018, 87, 23-32. [ Links ]
27 Z. Akar, N.A. Burnaz, A new colorimetric method for CUPRAC assay with using of TLC plate, LWT. 2019, 112. [ Links ]
28 H. Salgado, A. Santos, Andiroba oil: a strategic approach to detect antioxidant activity in different lipid groups by TLC, BMC Proc. 2014, 8, P233. [ Links ]
29 M.S. Taga, E.E. Miller, D.E. Pratt, Chia seeds as a source of natural lipid antioxidants, J. Am. Oil Chem. Soc. 1984, 61, 928-931. [ Links ]
30 N. Wu, K. Fu, Y.-J. Fu, Y.-G. Zu, F.-R. Chang, Y.-H. Chen, X.-L. Liu, Y. Kong, W. Liu, C.-B. Gu, Antioxidant Activities of Extracts and Main Components of Pigeonpea [Cajanus cajan (L.) Millsp.] Leaves, Molecules. 2009, 14, 1032-1043. [ Links ]
31 D. Rodriguez-Amaya, A Guide to Carotenoid Analysis in Foods, UNICAMP, Campinas, 2001. [ Links ]
32 D. Montesano, S. Albrizio, L. Lucini, F.J. Barba, M. Gallo, Lipids and Food Quality, J. Food Qual. 2018, 2018, 1,2. [ Links ]
33 J.S. Pizzo, M.B. Galuch, P.D.S. Santos, O.O. Santos, L. Visentainer, M.N. Eberlin, J.V Visentainer, Assessment of adulteration of cosmetics based on vegetable oils by GC-FID and lipid profile using direct infusion electrospray ionization mass spectrometry (ESI-MS), Artic. J. Braz. Chem. Soc. 2018, 29, 2457-2465. [ Links ]
34 D.T. de Oliveira, C. Turbay Vasconcelos, A.M.T. Feitosa, J.B. Aboim, A. de N. de Oliveira, L.P Xavier, A.S. Santos, E.C. Gonçalves, G.N. da Rocha Filho, L.A.S. do Nascimento, Lipid profile analysis of three new Amazonian cyanobacteria as potential sources of biodiesel, Fuel. 2018, 234, 785-788. [ Links ]
35 J.B. Aboim, D.T. de Oliveira, VA. de Mescouto, A.S. dos Reis, G.N. da Rocha Filho, A.V Santos, L.P Xavier, A.S. Santos, E.C. Gonçalves, L.A.S. do Nascimento, J.B. Aboim, D.T. de Oliveira, V.A. de Mescouto, A.S. dos Reis, G.N. da Rocha Filho, A.V. Santos, L.P. Xavier, A.S. Santos, E.C. Gonçalves, L.A.S. do Nascimento, Optimization of light intensity and NaNO3 concentration in Amazon cyanobacteria cultivation to produce biodiesel, Molecules. 2019, 24, 2326. [ Links ]
36 X. Meng, J. Yang, X. Xu, L. Zhang, Q. Nie, M. Xian, Biodiesel production from oleaginous microorganisms, Renew. Energy. 2009, 34, 1-5. [ Links ]
37 C.T. Evans, C. Ratledge, Influence of Nitrogen Metabolism on Lipid Accumulation by Rhodosporidium toruloides CBS 14, J. Gen. Microbiol. 1984, 130, 1705-10. [ Links ]
38 M. Olech, L. Komsta, R. Nowak, L. Ciesla, M. Waksmundzka-Hajnos, Investigation of antiradical activity of plant material by thin-layer chromatography with image processing, Food Chem. 2012, 132, 549-553. [ Links ]
Received 13 Febrary 2020
Revised 17 June 2021
Accepted 21 June 2021
* To whom correspondence should be addressed Email: alberdan@ufpa.br

