Services on Demand
Article
Indicators
Related links
-
 Cited by Google
 -
 Similars in Google
Share
South African Journal of Chemistry
On-line version ISSN 1996-840X
Print version ISSN 0379-4350
S.Afr.j.chem. (Online) vol.75 Durban 2021
http://dx.doi.org/10.17159/0379-4350/2021/v75a17
RESEARCH ARTICLE
Selective Solid-Phase Extraction Using Molecularly Imprinted Polymers for the Analysis of Target Pesticides in Cannabis Bud
Paul MyburghI, II; Gerdus KempII; Patricia ForbesI, *
IDepartment of Chemistry, University of Pretoria, South Africa
IINational Analytical Forensic Services, Pretoria, South Africa
ABSTRACT
A molecularly imprinted solid-phase extraction (MISPE) procedure was developed for the GC-MS analysis of four high priority pesticides (atrazine, terbuthylazine, acetochlor and alachlor) in a cannabis bud sample matrix. The study demonstrated that the synthesised polymer had a high affinity and good selectivity for either chloroacetamide or triazine classes of pesticide used as a template molecule during the molecularly imprinted polymerisation reaction. The MISPE procedure was optimised in terms of loading, washing and elution fractions utilising a range of aqueous methanol solutions for optimal recovery and minimal matrix interferences. The optimal wash fraction was 20% (v/v) methanol in an aqueous solution, whilst 70% (v/v) was used for the elution fraction. The selectivity, accuracy and recovery of the MISPEs were verified using a synthesised non-imprinted polymer and a commercial C18 cartridge as reference sorbents in comparative experiments. Approximately 3 g of the cannabis bud sample was spiked at a 0.05 mg/kg maximum residue limit (MRL) concentration. The recovery of the four selected pesticides extracted from the spiked samples ranged between 76.4-85.0% when utilising the optimised MISPE methods, compared to 91.6-96.9% for the C18 SPE. However, the use of the MISPE resulted in enhanced selectivity, as evidenced by GC-MS analysis, due to the extraction of less matrix interferences. Therefore, it can be concluded that the MISPE is a viable pre-treatment method for selective pesticide analysis in cannabis flowers using GC-MS when selectivity is valued for the extraction of target pesticides from a complex sample matrix.
Keywords: molecularly imprinted polymer; solid-phase extraction; Cannabis; pesticides; atrazine; terbuthylazine; acetochlor; alachlor
1. Introduction
The term cannabis refers to plants in the genus Cannabis and the family Cannabaceae. This family includes various species or sub-species, such as C. sativa, C .indica and C. ruderalis, all widely referred to by the same common name, 'cannabis'. The year 2017 marked a turning point in the South African legislature because it became possible to apply for a medical cannabis cultivation licence from the South African Health Products Regulatory Authority (SAHPRA).1 On 22 May 2020, a Government Gazette (Vol. 659, No 43347) was published, which stated that the Minister of Health had amended the schedules for both cannabidiol (CBD) and tetrahydrocannabinol (THC). Subsequently, CBD was listed as a Schedule 4 substance and under two conditions as a Schedule 0 substance. This listing resulted in a boom in cannabis cultivators, shops, mainstream online selling and open advertisement of cannabis and cannabis-related products in South Africa.2 This has raised concern on the possible risks associated with the use of pesticides on this newly emerging crop.
South Africa has been classified as the largest user of pesticides in sub-Saharan Africa3, of which atrazine is the highest-ranked pesticide in terms of weighted hazard potential. This weighted hazard potential ranks pesticides based on the quantity used per annum and considers the potential toxicity and environmental impact of the pesticide. Therefore, even though atrazine is not the most toxic pesticide used in South Africa, the large quantities used have resulted in this pesticide having the highest weighted hazard potential.3 For many South African crops, the maximum residue limit (MRL) for atrazine is 0.05 mg/kg. Atrazine is classified as a herbicide, and it is used extensively to control grassy and broadleaf weeds.4 Terbuthylazine, acetochlor and alachlor are also in the top 20 highest ranked weighted hazard potential pesticides used in South Africa.3 Terbuthylazine is an organochlorine herbicide, like atrazine, and is usually applied in a mixture with other triazine pesticides, as both a pre- and post-emergence herbicide.5 Chloroacetanilides, such as acetochlor and alachlor, are also commonly used as herbicides.6 They are generally used for weed control in cornfields as a selective pre-emergence herbicide. It has, however, been demonstrated that the extensive use of herbicides has a negative effect on the environment and that the residues are also detrimental to human health due to their ability to cause osteoma.7
The negative effects of herbicide use have highlighted the significance of developing methods for extraction and analysis, such as molecularly imprinted polymers (MIPs) to isolate and pre-concentrate pesticides for analysis in environmental samples.7 A MIP is produced when the polymerisation of self-orientated monomers is initiated in the presence of a template molecule. In this case, one of the pesticides mentioned above. The template molecule is then removed from the polymer, leaving a complementary cavity to the template molecule. These cavities have the potential to rebind the target molecule or structural analogues resulting in the polymer having an affinity for the original template molecule. A thorough literature review has demonstrated that MIPs are effective tools in chemical separation, molecular sensors, and catalysis.8
To date, molecularly imprinted solid-phase extraction (MISPE) has been employed for the extraction of atrazine9, terbuthylazine,10 acetochlor and alachlor7 from soil and water samples. Dummy templates, such as propazine, have demonstrated effective extraction of atrazine and terbuthylazine from river water.11 Triazines (including atrazine and terbuthylazine) belong to the 1,3,5 triazine group. Triazines contain several nitrogen atoms giving them the potential to form oriented hydrogen bonding with methacrylic acid (MAA).12 Acetochlor and alachlor can form orientated hydrogen bonds with amide and ether functional groups in their chemical structures.13 There are more hydrogen bonding sites for atrazine and terbuthylazine, each containing five nitrogen groups than for acetochlor and alachlor, with a maximum of three hydrogen bonding sites. The chloroacetamide pesticides also contain O-acceptors absent in the triazines, which suggests that the triazine pesticides might have a stronger affinity for their complementary cavities than chloroacetamide pesticides. They might form random hydrogen bonds with the NIP (non-imprinted polymer) more readily.
Therefore, the aim of this study was to synthesise, characterise, and compare several variations of MIPs with a specific focus on the extraction of selected pesticides from a cannabis bud sample matrix utilising molecularly imprinted solid-phase extraction (MISPE). For the synthesis of the MIP, methacrylic acid (MAA) was selected as the functional monomer, ethylene glycol methacrylate (EGDMA) as the crosslinker, toluene as porogen and azobisisobutyronitrile (AIBN) was used as a free radical polymerisation initiator. This combination of polymerisation reagents has been used in numerous MIP studies for other applications.9,12,11,14,15,16,17 In this study, MIPs were utilised as selective adsorbents for the solid-phase extraction of selected pesticides from cannabis plant material. To our knowledge, no similar studies have been reported in the literature to date. We show that our MISPE method has high selectivity to quantify the selected herbicides from complex cannabis bud samples compared to the conventional C18 sorbent.
2. Experimental
2.1. Reagents and chemicals
Methacrylic acid (MAA) that contained 250 ppm 4-methoxy phenol (MEHQ) inhibitor, ethylene glycol dimethacrylate (eDGMA, 98%) and 2,2'-azobis(2-methylpropionitrile) (AIBN) in 0.2 M toluene solution were all purchased from the Merck Group (Darmstadt, Germany). HPLC grade toluene, HPLC grade acetonitrile (99.8%), methanol and technical grade acetic acid were purchased from Sigma-Aldrich (St. Louis, Missouri, United States), whilst technical grade 70% isopropanol was purchased from Honeywell (North Carolina, United States). Pure atrazine, terbuthylazine, acetochlor and alachlor standards, used as templates in MIP synthesis, were purchased from Sigma-Aldrich (Pestanal® range, Darmstadt, Germany). Additionally, 100 xg/ml atrazine, terbuthylazine, acetochlor and alachlor solutions in methanol were obtained from the Accustandard® range (Separations, Cape Town, South Africa). Strata C18-E SPE cartridges had a bed volume of 100 mg in a 3 ml tube (Phenomenex, Separations, Cape Town, South Africa).
Sodium chloride (99.8%) and caffeine (99.9%) were purchased from the Merck Group (Darmstadt, Germany). Ultra-pure helium (>99.99%, Airproducts, Pennsylvania, United States) was used as GC carrier gas.
Two stackable 200 mm stainless steel sieves from Labotec (Pty) Ltd (Midrand, South Africa), with apertures of 53 and 25 /xm respectively, were used for size fractionation of synthesised polymers.
2.2. Gas chromatographic analysis
A PerkinElmer Clarus 680 GC coupled to MS PerkinElmer Clarus SQ 8T detector equipped with an electron impact ion source was used for all analyses (PerkinElmer South Africa (Pty) Ltd). Separation of the pesticide analytes was achieved utilising a Phenomenex ZB5 MSi column (30 m with a 5 m guard column, 0.25 mm i.d., 0.25 /xm film thickness). The GC oven temperature program started at 80 °C with a ramp of 50 °C/min to 220 °C, followed by a slow ramp of 10 °C/min to 260 °C, and a final ramp of 40 °C/min to 300 °C with a hold time of 1 min. The total run time was 8.80 min. The injector temperature was set to 250 °C, with 2 |il injection volume. Injection was done spitless, and after 12 seconds, the split flow was altered to 15 mL/min (split ratio: 15:1). The column flow was 1.0 mL/min (constant flow) with helium as carrier gas. The inlet liner temperature to the MS was set to 230°C, and the ion source temperature was 200 °C. An ionisation energy of 70 eV was employed. The single ion recording (SIR) monitored masses and MS functions over the analysis time were as follows: two solvent delays were used from 0.0 to 4.1 min and again from 8.2-8.8 min. A SIR function was used from 4.1-8.2 min with the following m/z channels recoded: 109; 146; 160; 162; 173; 188; 194; 200; 214 and 215.
SIR can be more generally referred to as single ion monitoring (SIM). This nomenclature differs between manufacturers or software suppliers. The system used for this study, namely Empower 3 with a PerkinElmer SQ8 MS, uses the term single ion recording (SIR).
After performing five-point calibration curves, in triplicate, with concentrations ranging from 1 µg/ml to 10 µg/ml, the limits of quantitation (LOQs) were calculated to be 1.16 µg/ml for atrazine, 0.97 µg/ml for terbuthylazine, 0.25 µg/ml for acetochlor and 0.26 µg/ml for alachlor. These limits were calculated using the formula: LOQ = 10Sy/m, where Sy is the standard deviation of the curve or response (y value) and m is the slope of the calibration line.
The limits of detection (LODs) were determined by injecting low concentrations of analytes and assessing the signal to noise ratio of each injection. A final injection was done at 0.05 µg/mL (0.05 ng on column), and this was found to be close to the LOD for terbuthylazine, acetochlor and alachlor. Atrazine was not detected at this concentration as the S/N was found to be below three. Atrazine had a S/N > 3 at a 0.1 µg/mL injection.
2.3. MIP preparation and MISPE packing
Template (0.025 mmol), MAA (2 mmol), EGDMA (2 mmol) and 1.125 ml toluene were added into a 15 ml glass crimp cap vial and mixed thoroughly by vortexing. NIP was prepared in the same fashion, with the exclusion of the template molecule. The polymerisation initiator (2.375 ml of 0.2 M AIBN in toluene) was then added to the mixture. The molar ratio and methodology were based on literature.9 The vial was briefly purged with argon and sealed. The solution was sonicated for 3 min and placed in an oven at 60 °C for 24 h. The cap was removed, and the MIP was dried overnight at 60 °C.
A solution of 9:1 methanol: acetic acid was used to remove the template. Approximately 5 ml of this solution was added to the dried polymer and mixed thoroughly by vortexing and sonication. The slurry was then centrifuged at 3500 rpm for 5 min. The supernatant was poured off carefully without disturbing the polymer pellet. The procedure was repeated at least seven times, and each washing was analysed utilising GC-MS until no more template was detected.
The bulk polymer was ground with a pestle and mortar and wet sieved with deionised water. The particles with a diameter of 24-53 µm were collected and rinsed with methanol before oven drying at 70 °C. An empty cartridge with the bottom frit already installed was placed on a vacuum manifold with the tap closed, and 2 ml methanol was added. Approximately 200 mg of the polymer was weighed. The cartridge was continuously tapped to ensure no air was trapped between the polymer particles as they were slowly poured into the methanol containing tube. The upper frit was then inserted. The MISPEs were stored wet to prevent the formation of channels (cracks) in the sorbent bed after packing and use.
2.4. Adsorption capacity determination
From the literature, the binding capacity of the MIP is expected to be about 1 mg/g.9 This was considered when choosing polymer masses and pesticide concentrations for MIP synthesis. Approximately 30 mg of washed and dried polymer (MIP or NIP) was weighed into a centrifuge tube, and 3960 µL of deionised water was added.
The selected pesticide was then added, 40 µL of 2 mg/mL standard solution, to provide a 20 µg/mL concentration in a total volume of 4 mL. The tube was sealed and vigorously mixed to allow the polymer to come into contact with the entire solution. The vial was vortexed and sonicated for 3 min and 20 min, respectively and was then centrifuged for 5 min at 3500 rpm.
Samples (1 ml) were taken from the centrifuge tube supernatant and filtered through a 0.24 µm syringe filter. The sample was then dried via vacuum concentration and reconstituted with 50 /L methanol containing 5 /g/mL caffeine internal standard before GC-MS analysis.
2.5. SEM and FTIR characterisation
A Zeiss Evo MA10 electron microscope (Carl Zeiss (Pty) Limited, South Africa) was employed for scanning electron microscopy (SEM) images. The samples were mounted using conductive double-sided adhesive carbon tabs.
A PerkinElmer Spectrum Two FTIR with ATR source (PerkinElmer (Pty) Ltd, South Africa) was used to obtain FTIR spectra of the synthesised MIPs and NIP. Technical grade 70% isopropanol and Kimwipes® (KimtechTM of Kimberly-Clark, United States) were used to clean the ATR source and compression boot, before and after each sample was mounted. After the source dried, a background spectrum was obtained. The sample was then placed on the ATR source and compressed under the compression boot.
2.6. Cannabis sample extraction and MISPE 2.6.1. Cannabis extraction procedure
Approximately 3 g of fine plant material was weighed into a 50 ml PTFE centrifuge tube and spiked to reach the MRL of 0.05 mg/kg for the target pesticides. Then 15 ml acetonitrile was added, and the sample was vortexed and sonicated (15 min). Deionised water (20 ml) was added to the sample enough to cover the plant material. The slurry was vortexed thoroughly and sonicated for 15 min. NaCl (500 mg) was added, and the slurry was vortexed thoroughly again. The sample was then centrifuged for 10 min at 3500 rpm. The acetonitrile fraction was evaporated to ~1 ml using a vacuum sample concentrator.
The two triazine pesticides, atrazine and terbuthylazine, are sparingly water-soluble at 33 and 9 [ig/ml, respectively.18,19 While acetochlor and alachlor are much more water-soluble, having solubilities of >200 µg/ml.20,21 After spiking a weighed portion of cannabis flower (approximately 3 g), 20 ml of water was added to the sample. The slurry was vortexed thoroughly and sonicated for 15 min and then centrifuged for 10 min at 3500 rpm. As much water as possible was removed, utilising a pipette, without disturbing the sediment, and was transferred to a separate container. Another 20 ml of water was added, and the procedure was repeated. The combined water fractions needed no further processing and were passed through the SPE cartridge. A double-sided needle with a rubber septum was used to pass the large quantity of water through the cartridge during loading.
2.6.2. C18 reference SPE method employed for the extraction of pesticides from cannabis
The C18 SPE cartridge was conditioned with 2ml of methanol and then 2 ml of deionised water. Before the SPE dried, the diluted extract was loaded onto the cartridge at a slow drip rate of approximately 0.5 ml/min. The acetonitrile extract was diluted to 20% acetonitrile: 80% water inside the SPE tube to avoid loss due to emulsion formation. The SPE cartridge was then washed with 3 ml of 20% methanol: water at approximately 0.8 ml/min. The sorbent was dried under a vacuum of 50 kPa for 30 min. The pesticides were eluted using 3 ml of 70 % methanol. The methanol fractions were added to the SPE cartridge while the manifold tap was closed to allow the sorbent to wet. The tap was then opened, and the elution was done under vacuum, refer to Figure 1. The elution fractions were dried via vacuum concentration and reconstituted with 150 /l of 5 /g/ml caffeine in methanol solution, used as internal standard (IS). Only 50 µl of 5 /g/ml caffeine was required to dissolve the dried sample during reconstitution for the water extracts.
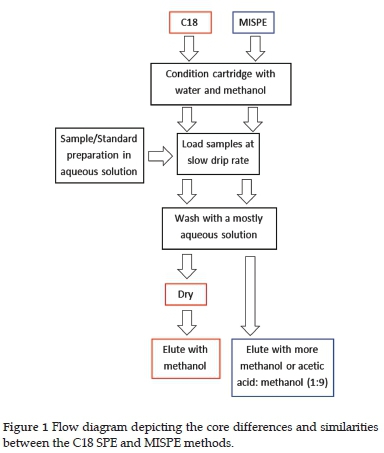
A similar approach was used for MISPE with regards to wetting and loading. For the triazine pesticides, a 3 ml 10% acetonitrile: 90% water loading fraction was prepared, whilst for the chloroacetamide pesticides, a larger 10 ml 1% acetonitrile: 99% water loading fraction was prepared. The MISPE/NISPE cartridge was then washed with either a 3 ml 10% methanol: 90% water solution for the triazine pesticides or a 3ml 1% methanol: 99% water solution for the chloroacetamide pesticides. Before the sorbent dried, the pesticides were eluted using 5 ml 70% methanol solution. The elution fractions were dried via vacuum concentration and reconstituted with 150 /l of 5 µg/ml caffeine in methanol solution.
2.7 Statistical analysis
The paired t-test was used to compare two data sets, typically generated from two different methods, to determine a statistical difference between the two sample sets. The tcrit value is 2.776 at a 95% confidence interval for four degrees of freedom.
3. Results and Discussion
3.1. Characterisation results
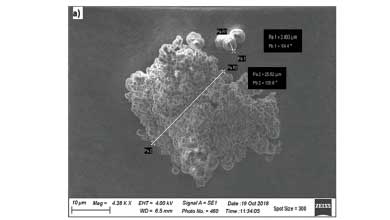
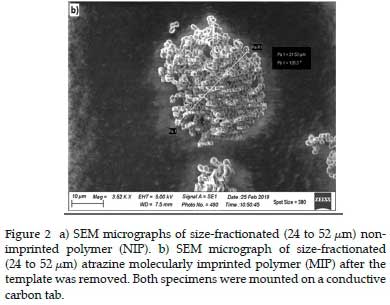
Figure 2a shows an SEM image of NIP after size fractionation, and Figure 2b displays the equivalent SEM image of the atrazine MIP The sieves used had apertures of 52 and 24 µm, respectively. The bead size is smaller in Figure 2b, with the smallest beads having a diameter of 2.8 µm. There appeared to be smaller beads or fractions that had broken off the main conglomerate, likely due to the grinding procedure. This breaking may have happened during SPE packing, and these smaller particles could pass through the frit when the SPE was packed, as the frit on the SPE cartridges had a pore size of 20 µm. The origin of these small particles is not fully understood since they were present after the polymer was wet sieved and the template removed after repeated rinsing.
Using ImageJ software, the average diameter of the non-imprinted polymer particles (Figure 2a) was determined to be 3.87 µm for n = 30 with a standard deviation of 0.56 µm.
The average diameter of the MIP particles was determined to be 2.06 µm with a standard deviation of 0.31 µm (Figure 2b). There appears to be little to no morphological differences in the MIP and the NIP's bead shape upon comparing Figures 2a and b. This similarity indicates that removing the template or the washing process did not disturb the morphology of the atrazine MIP. Since the whole MIP principle depends on the rigidness of the molecular cavity after the template has been removed, these two images were significant in demonstrating that the synthesis was effective in this regard. Considering the particles were not round, the small size difference between the NIP and MIP can be regarded as insignificant.
FTIR was also used as a characterisation technique for the synthesised polymers. Two examples of atrazine MIP FTIR spectra are displayed in Figure 3 for a visual comparison of the spectra before and after template removal. There does not appear to be any notable differences between the two spectra. Additionally, the FTIR software reported a98% correlation between them.
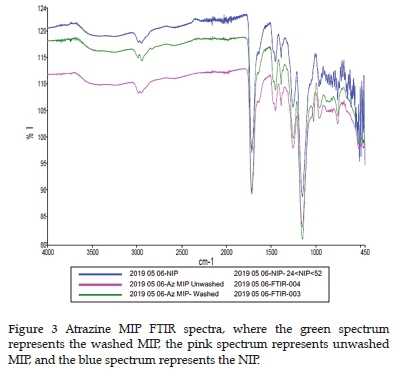
Several FTIR peaks were observed in all the MIP and NIP spectra. A broad peak with low intensity was observed at around 3300 cm-1 and is generally associated with O-H bonds. 23 Two unresolved peaks with low transmission were observed at 2990 and 2950 cm-1, indicating asymmetric 1°C-H and symmetric 1°C-H bonds, respectively. 23 A sharp peak was observed at 1720 cm-1 which is common of C=O groups. A shoulder peak was found at 1640 cm-1 that can be associated with C=C peaks. 23 Another split peak is observed at 1450 cm-1 next to a sharp 1390 cm-1 peak associated with asymmetric 2°C-H and symmetric 2°C-H bonds, respectively. 23 Two peaks close to one another were observed at 1255 and 1150 cm-1 and indicate asymmetric and symmetric stretching of a C-O-C bond.23 The peak at 1150 cm-1 is the peak with the highest transmittance in the spectrum. Carboxylic groups, usually seen at 1125 cm-1, should be present in the MIP and NIP, but no single peak is observed. It might be that the peak at 1150 cm-1 was unresolved from the carboxylic groups. There are many small and indistinguishable peaks present at >1000 cm-1 that indicate vinylic C-H. There were no additional peaks present before the removal of the atrazine template from the MIP. The template concentration was thus deemed to be too low for significant FTIR peaks to be observed relative to those arising from the polymer itself.
3.2. Adsorption capacity of MIPs
The atrazine MIP was found to have an adsorption capacity of 0.91 mg/g for atrazine with a standard deviation of 0.056 mg/g (n=3). The terbuthylazine MIP was found to have an adsorption capacity of 0.96 mg/g for terbuthylazine with a standard deviation of 0.105 mg/g (n=3). For the chloroacetamide MIPs, the adsorption capacities were determined to be 1.04 mg/g and 1.06 mg/g of the acetochlor MIP and alachlor MIP with standard deviations of 0.112 mg/g and 0.119 mg/g (n=3), respectively. The MTMIP was found to have a reduced adsorption capacity for each template analyte. This reduced adsorption was expected as less template of each pesticide was used during synthesis, resulting in fewer cavities. The adsorption capacities ranged from 0,69 to 0.84 mg/g for each pesticide.
For a MISPE cartridge containing 200 mg of MIP sorbent with the lowest determined adsorption capacity of 0.69 mg/g, the total adsorption capacity of the MISPE would be 138 µg of template pesticide. This adsorption was deemed to be more than sufficient considering the MRLs of each pesticide.
3.3. C18 SPE results
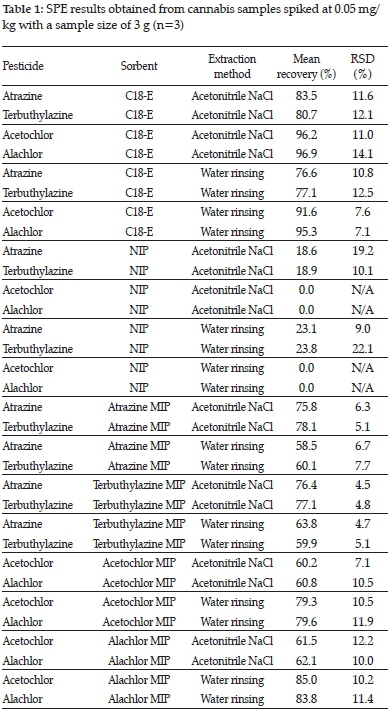
Table 1 contains the results for several SPE experiments. Three replicates for each pesticide and each extraction method were performed for statistical analysis purposes. Recoveries over 75% are displayed in bold and indicate compatibility of the template, sorbent and extraction method. The standard deviation and mean values were calculated, and t-tests were performed to compare the different triplicate results. None of the compared groups tested within the acetonitrile NaCl extractions was found to be statistically different. The only statistical differences were observed when comparing the triazine with the chloroacetamide pesticides when the water rinsing extraction method was used. The chloroacetamide pesticides had an overall higher recovery of over 90% than the triazine pesticides. The water solubility is likely the most important reason for the higher recovery of the chloroacetamide pesticides when using water rinsing extraction and a greater affinity for the C18 sorbent compared to the triazine pesticides.
3.4. NIP results
At the relevant concentration of 0.05 mg/kg, some triplicate NISPE experiments had no detected chloroacetamide pesticides in the extracts (Table 1). It was found unnecessary to reconstitute the acetonitrile extracts with 150 /l methanol as with the C18 sorbent. However, to compare the synthesised sorbents with the C18 SPE, the reconstitution volume was kept constant. There were again no statistical differences found when comparing triplicate groups within the triazine or chloroacetamide pesticide groups. There was, of course, a statistical difference between the triazine group and the chloroacetamide group, which was not detected. The C18 sorbent thus has far superior recovery compared to the NIP with regard to all four of the analysed pesticides.
3.5. Triazine MISPE
Table 1 displays the results obtained for spiked cannabis flower sample extracts on the atrazine and terbuthylazine MISPEs. Samples were extracted using the acetonitrile NaCl methodology that was reconstituted with 150 /l methanol containing 5 ppm caffeine IS to ensure comparability to the C18 SPE experiments. A clear statistical difference was found between the acetonitrile NaCl and water rinsing extraction methods. The water rinsing method was far less effective for the extraction of the triazine pesticides from the cannabis plant material (Table 1), which can be attributed to the low water solubility of atrazine and terbuthylazine.
No statistical differences were observed when comparing atrazine and terbuthylazine recoveries on either the atrazine or terbuthylazine MISPEs, using a t-test. The templates were thus found to be compatible with both MIPs. This compatibility was expected due to structural similarities between atrazine and terbuthylazine, resulting in similar hydrogen bonding and orientation in the cavity of the MIP. Although the recoveries for both atrazine and terbuthylazine were observed to be lower when extracted with the atrazine and terbuthylazine MISPEs compared to the C18 SPE, it was observed both visually (from the colour of the eluates) and chromatographically that the synthesised MIPs provided far more selectivity to their template pesticides than the C18 sorbent.
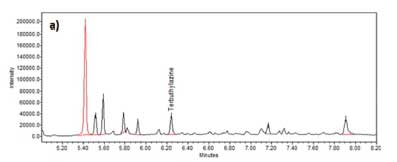
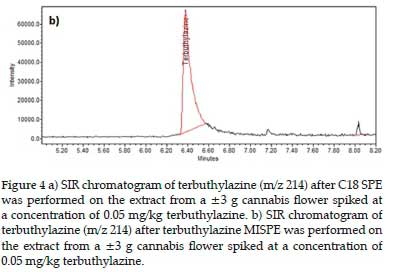
Figure 4a displays an example chromatogram of terbuthylazine (m/z 214) after C18 SPE was performed.
Figure 4b shows the equivalent chromatogram after terbuthylazine MISPE was performed on a similarly spiked and acetonitrile NaCl extracted cannabis sample. After the C18 sorbent extraction, terbuthylazine was found to be a minor peak on the quantitation SIR chromatogram. In contrast, after the MISPE extraction, it was the major peak in the equivalent SIR chromatogram (Figure 4).
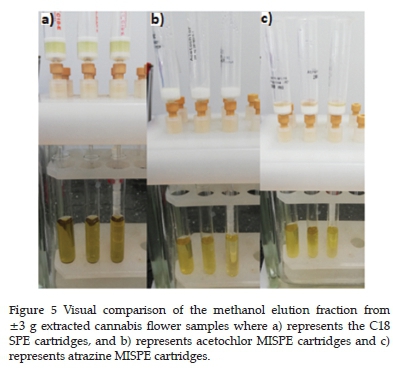
Sample extracts (Figure 5) were observed to be clearer when atrazine or terbuthylazine was extracted, because a higher concentration of methanol in water was used for the washing steps than for acetochlor and alachlor extractions. All the MISPEs yielded noticeably clearer eluates than the C18 SPE samples.
From the literature, recoveries of 94 to 99% were reported from atrazine spiked environmental water utilising a similar atrazine MIP and the LOD was 0.08 µg/l water.9 This is almost a thousand-fold below the 0.05 mg/kg MRL for atrazine on South African crops. However, it can be argued that water is a far less complex matrix and requires minimal workup before sample extraction can be performed. For this reason, the extraction from the cannabis flowers has a lower recovery despite being spiked at a higher concentration.
In another study, similar terbuthylazine imprinted MIPs were prepared and compared using different porogens, namely toluene and dichloromethane. MISPE recoveries for atrazine and terbuthylazine ranged from 83 to 96% for spiked groundwater samples (1 µg/l). It was reported that atrazine had a better recovery of 91% on the dichloromethane porogen MIP compared to 83% on the toluene MIP. Terbuthylazine was found to be reversed in the sense that 96% recovery was reported on the toluene porogen MIP and 84% on the dichloromethane porogen MIP. When the loading fraction on the toluene porogen MIP was doubled, 82 and 96% recoveries were reported for atrazine and terbuthylazine, respectively. The dichloromethane porogen MIP had recoveries of <60% for both triazine pesticides.10
3.6. Chloroacetamide MISPE
Table 1 displays the results obtained for spiked cannabis flower samples extracted utilising the acetochlor and alachlor MISPEs. Samples extracted using the acetonitrile NaCl methodology that was reconstituted with 150 µl methanol containing 5 ppm caffeine IS, resulted in theoretical concentrations of around 1.00 μg/ml post reconstitution. The dried elution fraction
would have been able to dissolve in less reconstitution solvent. However, to allow for comparability to the C18 SPE experiments, the same reconstitution volume was maintained. A statistical difference was found between the acetonitrile NaCl and water rinsing extraction methods (Table 1). The water rinsing method was more effective for the extraction of the chloroacetamide pesticides from the cannabis plant material.
No statistical differences were observed when comparing acetochlor and alachlor recoveries on either the acetochlor or alachlor MISPEs. The chloroacetamides were thus found to be compatible with both MIPs. As with the triazine MIPs this was expected due to structural similarities with regard to similar hydrogen bonding in the cavities of the MIP of acetochlor and alachlor. The use of dummy templates in literature support this observed compatibility, as both acetochlor and alachlor could be extracted utilising the same MIP.7
There are remarkably fewer literature articles for chloro-acetamide pesticide MIPs and particularly MISPE applications compared to triazine pesticides.
Four chloroacetamide herbicides, including alachlor and acetochlor, were spiked onto blank soil at concentrations ranging from 0.1 to 1 µg/ml and were extracted with a similar dummy template MIP (same monomers), resulting in mean recoveries ranging from 80.6 to 90.2% with a relative standard deviation (RSD) below 8% (n =5). The LOD was reported at 0.0005 to 0.025 mg/kg for the four chloroacetamide herbicides.7 The LOD is lower than the 0.05 mg/kg MRL for acetochlor and alachlor on South African crops, although the matrix was less complex than the cannabis flower matrix in terms of organic compounds present.
The alachlor chromatograms in Figure 6 were selected to illustrate the difference in selectivity observed between the C18 and acetochlor MIP sorbents. Both samples were extracted from ±3 g cannabis flower spiked at 0.05 mg/kg alachlor concentration followed by water rinsing extraction. The matrix interferences in both chromatograms are similar. However, after the MISPE, the alachlor was the major component in the chromatogram, and after C18 SPE, the equivalent peak was dwarfed by matrix interferences.
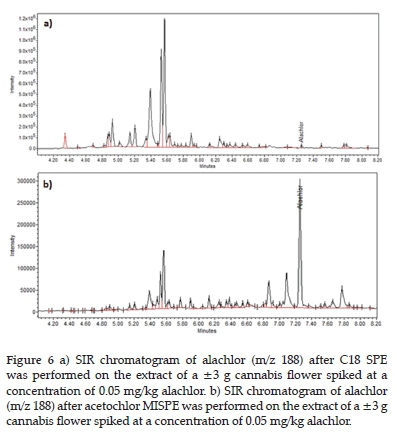
The recoveries for both acetochlor and alachlor were lower from the acetochlor and alachlor MISPEs than from the C18 SPE. However, it could again be observed both visually (from the colour of the eluates) and chromatographically that the synthesised MIPs were far more selective to their template pesticides than the C18 sorbent.
3.7. Multi template MISPE
Table 2 displays average recoveries for pesticide spiked cannabis flower samples extracted with both water rinsing and acetonitrile NaCl extraction before undergoing SPE clean-up employing the multi temple (MT) MIP as sorbent. All four of the chosen pesticides were spiked and subsequently extracted simultaneously.
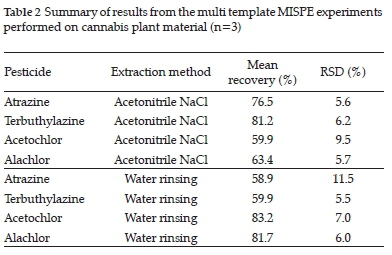
The acetonitrile NaCl extraction (Table 2) was more effective for the triazine pesticides, and the water rinsing extraction method was more effective for the chloroacetamide pesticides. No significant statistical differences were observed between the two triazine pesticides nor between the two chloroacetamide pesticides.
4. Conclusion
The MIPs synthesised in this study compared well with similar MIPs regarding selectivity and adsorption capacity used to extract pesticides from other sample matrices reported in the literature. However, the recoveries from the C18 SPE were higher than the synthesised MIPs for the extractions of cannabis flowers. On the other hand, MIPs were more selective and extracted far less matrix interferences than the C18 sorbent. The synthesised MIPs, including the novel MTMIP, was demonstrated to effectively extract selected pesticides from the cannabis plant material at relevant concentration limits when employed as packed MISPE cartridges. The MISPEs were found to be more selective than the C18 sorbent. They were thus found to be valuable when selectivity is desired to extract target analytes from a complex sample matrix. The cleaner extracts will also lead to less maintenance of the GC-MS and longer column lifetimes, which have cost-saving benefits.
The water rinsing method was more effective for the extraction of the chloroacetamide pesticides from the cannabis plant material when utilising the MISPEs. The MIPs were found to be compatible within their respective pesticide classes. In other words, both triazine MIPs showed an affinity for both atrazine and terbuthylazine pesticides. The same was found to be true for the chloroacetamide MIPs and pesticide templates.
Schedule substance permits
Over the course of the study, several Department of Health permits for the possession of schedule 6 and 7 substances for research purposes were obtained specifically for cannabis plant material. The permit numbers were: POS 020/2018/2019; POS 247/2019/2020, and POS 133/2020/2021
Acknowledgements
Henrick Viviers, laboratory manager at NAFS, is thanked for practical advice and assistance with analytical instruments. Robert Fair at SA-Photonica is acknowledged for assistance with SEM images.
ORCID iDs
Paul Myburgh: https://orcid.org/0000-0002-6760-607X
Gerdus Kemp: https://orcid.org/0000-0002-9033-2935
Patricia Forbes: https://orcid.org/0000-0003-3453-9162
References
1 J. Gouws, Cultivation of cannabis and manufacture of cannabis-related pharmaceutical products for medicinal and research purposes. Medicines Control Council: Application guideline, V1, 2017. [ Links ]
2 Department of Health. Government notice R.486-Medicines and Related Substances Act (101/1965): Schedules. Government Gazette, 2020, 659, 1-4. [ Links ]
3 J.M. Dabrowski, J.M. Shadung, V Wepener, Prioritising agricultural pesticides used in South Africa based on their environmental mobility and potential human health effects. Environ. Int., 2014, 62, 31-40. [ Links ]
4 S. Singh, V. Kumar, A. Chauhan, S. Datta, A.B. Wani, N. Singh, J. Singh, Toxicity, degradation and analysis of the herbicide atrazine. Environ. Chem. Lett., 2018, 16, 211-237. [ Links ]
5 C. MacBean, The pesticide manual-A world compendium. 16th edn. British Crop Production Council, Hampshire, 2012. [ Links ]
6 C.A. Moffat, M.D. Osselton, B. Widdop, J. Watts, Clarke's Analysis of Drugs and poisons in pharmaceuticals, body fluids and postmortem material. 4th edn. Pharmaceutical Press, London, Chicago, 2011. [ Links ]
7 Y. Wang, X. Jin, D. Zhao, X. Guo, R. Li, Molecularly imprinted solid-phase extraction coupled with gas chromatography for the determination of four chloroacetamide herbicides in soil. Anal. Methods, 2015, 7, 6411-6418. [ Links ]
8 M.J. Whitcombe, N. Kirsch, I.A. Nicholls Molecular imprinting science and technology: A survey of the literature for the years 20042011. J. Mol. Recognit., 2014, 27, 297-401. [ Links ]
9 P Kueseng, M.L. Noir, B. Mattiasson, P Thavarungkul, P Kanatharana Molecularly imprinted polymer for analysis of trace atrazine herbicide in water. J. Environ. Sci. Health B, 2009, 44, 772-780. [ Links ]
10 I. Ferrer, F. Lanza, A. Tolokan, V Horvath, B. Sellergren, G. Horvai, D. Barceló, Selective trace enrichment of chlorotriazine pesticides from natural waters and sediment samples using terbuthylazine molecularly imprinted polymers. Anal. Chem., 2000, 72, 3934-3941. [ Links ]
11 L. Guzzella, F. Pozzoni, C. Baggiani Synthesis and characterisation of a propazine imprinted polymer for the extraction of triazines herbicides. Water Sci. Tech., 2008, 57, 139-144. [ Links ]
12 M. Niu, C. Pham-Huy, H. He, Core-shell nanoparticles coated with molecularly imprinted polymers: a review. Microchim. Acta, 2016, 183, 2677-2695. [ Links ]
13 R. Elshafey, A.E. Radi, Electrochemical impedance sensor for herbicide alachlor based on imprinted polymer receptor. J. Electroanal. Chem. (Lausanne), 2018, 813, 171-177. [ Links ]
14 X. Zhu, J. Yang, Q. Su, J. Cai, Y. Gao, Selective solid-phase extraction using molecularly imprinted polymer for the analysis of polar organophosphorus pesticides in water and soil samples. J. Chromatogr. A, 2005, 1092, 161-169. [ Links ]
15 J. Chen, L.Y. Bai, K.F. Liu, R.Q. Liu, Y.P. Zhang, Atrazine molecular imprinted polymers: Comparative analysis by far-infrared and ultraviolet induced polymerisation. Int. J. Mol. Sci.,, 2014, 15, 574-587. [ Links ]
16 C. Gkementzoglou, O. Kotrotsiou, M. Stoukides, C. Kiparissides, On the synthesis of molecularly imprinted polymers for analytical and sensor applications. Macromol. Symp., 2013, 331-332, 26-33. [ Links ]
17 H.R. Geng, S.S. Miao, S.F. Jin, H. Yang, A newly developed molecularly imprinted polymer on the surface of TiO2 for selective extraction of triazine herbicides residues in maise, water, and soil. Anal. Bioanal. Chem, 2015, 407, 8803-8812. [ Links ]
18 WHO. Terbuthylazine (TBA) in drinking-water: background document for development of WHO guidelines for drinking-water quality. WHO/SDE/WSH/03.04/63. Health criteria and other supporting information, 2003, 2, 1-8. [ Links ]
19 D. Stajnbaher, L. Zupancic-Kralj, Multiresidue method for determination of 90 pesticides in fresh fruits and vegetables using solid-phase extraction and gas chromatography-mass spectrometry. J. Chromatogr. A, 2003, 1015, 185-198. [ Links ]
20 WHO. Alachlor in Drinking-water: background document for development of WHO Guidelines for Drinking-water Quality.WHO/ SDE/WSH/03.04/31. Alachlor Guidelines for drinking-water quality, 2003, 2, 1-5. [ Links ]
21 US EPA. Drinking Water Exposure Assessment for Acetochlor Usage on Sorghum. United States Environmental Protection Agency, Washington, D.C., 2006, 20460 107, 272. [ Links ]
22 J.N. Miller, J.C. Miller, Statistics and chemometrics for Analytical Chemistry, Pearson Education Limited, 2010. [ Links ]
23 G.H. Jeffery, J. Bassett, J. Mendham, R.C. Denney, Textbook of quantitative chemical analysis. Longman Scientific & Technical; John Wiley & Sons, New York, 1903. [ Links ]
Received 28 January 2021
Revised 11 May 2021
Accepted 11 May 2021
* To whom correspondence should be addressed Email: patricia.forbes@up.ac.za


