


Services on Demand
Article
 English (pdf)
 Article in xml format
 Article references
Indicators

Related links
-
 Cited by Google
 -
 Similars in Google
Share

 Permalink
South African Journal of Chemistry
On-line version ISSN 1996-840X
Print version ISSN 0379-4350
S.Afr.j.chem. (Online) vol.75 Durban 2021
http://dx.doi.org/10.17159/0379-4350/2021/v75a9
RESEARCH ARTICLE
https://doi.org/10.17159/0379-4350/2021/v75a9
Optimization of Silica Extraction from Diatomaceous Earth using the Central Composite Design of Response Surface Methodology
Oisaemi U. IzevbekhaiI,*; Wilson M. GitariI,*; Nikita T. TavengwaII
IEnviromental Remediation and Nanoscience Research Group, Department of Ecology and Resource Management, University of Venda, Thohoyandou, 0950, South Africa
IIDepartment of Chemistry, University of Venda, Thohoyandou, 0950, South Africa
ABSTRACT
This work evaluated the extraction efficiency of silica from diatomaceous earth (DE) by conventional solvent extraction (CSE) and ultrasound-assisted extraction (UAE) under basic and acidic (HCl) conditions utilizing response surface methodology (RSM). A common statistical model was used to get the best percentage yield and percentage purity using RSM. Experimental parameters such as stirring time, NaOH concentration (for CSE), sonication time, NaOH/HCl concentration, cycle and amplitude (for UAE methods) were optimized using central composite design (CCD). The analytical responses, that is, percentage yield and percentage purity, were analyzed using ANOVA and regression analysis. The linear coefficient of determination, R2, was high and precise. The overall yield and purity were highest for the UAE method under acid condition (pH 1-2, approximately), making it the most effective silica extraction method from DE. For this method, the optimal conditions for extracting Si from DE were 2 h of sonication, 220 mL of 2.82 M HCl as a leaching/extracting medium, 0.524 cycles and 72.6 % of amplitude. Under these conditions, 82 % of silica was yielded with a purity of about 95 %. The experimental results indicate that high-quality silica can be produced from DE in high yield so that DE can be an alternative silica source.
Keywords: Diatomaceous earth, silica, response surface methodology, ultrasound-assisted extraction, conventional solvent extraction.
1. Introduction
Diatomaceous earth (DE), also known as diatomite, tripolite or kieselgur, is a white powder occurring naturally ubiquitously as a soft sedimentary rock containing about 80 to 90 % silica.1,2 It has been used in its raw form as a building material1; as a stabilizer of nitroglycerine in dynamite1; as a filter aid for water, sugar, sweetened liquors, oils, fats, alcoholic beverages, chemicals, and pharmaceuticals.3 It is highly porous, has a low density and high surface area.3 It has also been used as a filler in paints, plastics, cement, catalysts, and an absorptive carrier in pesticides.4 It has been used as an absorbent for industrial spills (oils and toxic liquids), as an abrasive in polishes, as an insulation material1,asa grain preservative 5, as a natural insecticide 6 and as a stationary phase in chromatography.6 As a result of the high silica content in DE, it is commonly used as a road surfacing material. It is used as filler for paints, rubber and in water filtration and agriculture.7 It is also used as a precursor for silica gels, ferrosilicon and elemental silicon used in modern-day technology in optical data transmission fibres, precision casting and solar-hydrogen energy systems.7
Silica, a major component of DE, can be mined from natural ores. However, the silica supply that can be obtained from these ores is too low to meet market demand for the oxide and elemental silicon.8 There is, therefore, the need to consider other sources of silica. High-grade pure silica has been extracted from a variety of bio-resources such as rice husk9-12, sugarcane bagasse13,14, palm ash15 and corn cob16,17, and others. Acid pretreatment or hydrothermal treatment, or a combination of both were used to extract the silica. Treatment at high temperatures yielded high particle size silica, while acid pretreatment before thermal treatment gave lower particle size silica. However, the purest silica (about 99.9 %) came from samples treated hydrothermally after either treatment method. From the data available from literature on silica extraction, it is evident that the extraction method influences the particle size with thermal treatment giving the highest particle size.
Sekar et al.18reported success in using sonochemical methods to extract silica from rice husk. They reported that one advantage of this method is that the porosity of the nanopores can be controlled by changing the sonication time and ultrasonic conditions such as frequency, power and cycle.
Response surface methodology (RSM) is a statistical approach to an experimental design that can optimize the extraction of silica and other analytes. It is suitable for the simultaneous optimization of independent variables that affect experimental outcomes like extraction yield and purity of analytes from one phase to the other. For RSM, the variables (extraction conditions) and their mutual interactions are investigated simultaneously.19 This approach contrasts with the classical experimental planning or design, where one factor is varied while keeping all others constant. Thus classical experimental design methods take up a lot of effort, time and fail to establish meaningful interactive patterns between the factors.19
RSM was introduced in 1951 by Box and Wilson20 and utilizes input data from well-planned experiments and regression analysis to establish responses or interactive patterns by solving multivariate equations of the variable factors simultaneously.
Graphical solutions of these equations are used to tell the effect of the test factors and their possible interactions on the responses. RSM takes complicated responses and replaces them with a simpler approximate function by looking at the relative significance of the effects of the factors on the responses. Fewer and more predominating factors are used to represent all possible points in the design space, thereby reducing the number of runs required to study the significance of different factors that may affect interest response.20
Despite the large amount of silica contained in DE, there is still a lack of literature on silica extraction. The few publications8,21 available have not reported in detail, the optimal conditions for its extraction from DE. Since silica occurs naturally in DE combined with other elements and oxides, there is the need for cheap and innovative ways to purify it. This work employs the use of RSM to optimize the extraction of silica from DE. It compares three different silica extraction methods to find the best in terms of yield and purity.
2. Experimental
2.2. Chemicals, Reagents, and Small Equipment
Diatomaceous earth was obtained from Eco-Earth (Midrand, South Africa) and used in its natural state. Sodium hydroxide and hydrochloric acid were of analytical grade and obtained from Rochelle Chemicals (Johannesburg, South Africa), and Milli-Q water from Millipore S.A.S (Molsheim, France) (18.2μS/cm at 25 °C) was used in all dilutions. Ultrasonic processor (UP 400S - 400 W, 24 kHz) Hielscher ultrasound technology, with a variable amplitude of 20 to 100 % and a cycle of 0.1-1 (Berlin, Germany), pH meter from Accsen Instrumental S.L.L. (Barcelona, Spain) and Bruker handheld S1 Titan XRF (Cramerview, South Africa) were used in the study.
2.3. Alkali Ultrasound-assisted Extraction (Alkali UAE Method)
The extraction of silica from DE was carried out by modifying the method reported by Bessho el al.8The responses correlated with those obtained from optimization experiments of the extraction conditions by central composite design (CCD) in the Design Expert program version 11, as shown in Table 1.

100 mL of varying NaOH concentrations (1-4M) were added to about 20 g of DE in a 250 mL beaker. Varying periods (1-4 h) of sonicated, cycles sonication waves (0.1-1.0), and amplitudes (20-100 %) were applied. After that, the mixtures were filtered. More silica was precipitated out from the filtrate by sequential pH adjustment to 10.5 and 9, respectively. The combined recovered Si was washed with milli-Q water and dried in the oven at 50 °C for 12 h. The percentage purity of silica extracted was measured using an XRF (wavelength 0.7 nm), and the percentage yield was calculated using Equation 1.

2.4. Acid Ultrasound-assisted Extraction (Acid UAE Method)
150-250 mL of varying HCl concentrations (2.5 to 3.5 M) were added to 20 g of DE in a 250 mL beaker. It was sonicated for a varying amount of time (1.5 to 2.5 h) while varying cycle (0.5-0.6) and amplitude (60-80 % of applied sonication waves) were applied. After this, the mixture was filtered and washed with Milli-Q water and dried in the oven at 50 °C for 12 h. The residue was then stirred in 1M NaOH for 33.5 h and filtered afterwards. The pH of the filtrate was then adjusted to 10.5 and then to 9. The residue was further purified by stirring a portion in 1M HCl for about 33 h, filtered, and the pH of the filtrate adjusted to about 10 and processed in the same way as in the alkali UAE method. The percentage purity of silica was measured using an XRF, and the percentage yield was calculated using Equation 1.
2.5. Conventional Solvent Extraction (CSE)
100 mL of varying NaOH concentrations (0.38-1.6 M) was added to 20 g of DE in a 250 mL beaker. The mixture was stirred using a magnetic stirrer for between 6.0 and 56.7 h. The resulting mixture was filtered, and silica was recovered in the same wayas in the alkali UAE method. The percentage of silica extracted was measured using an XRF, and the percentage yield was calculated using Equation 1.
2.6. Characterization of Diatomaceous Earth and Extracted Silica
The extracted silica, which was of the highest purity (based on XRF analysis), was further characterized. Only the extracted Si from alkali UAE and CSE methods and the three highest percentage silica from the acid UAE method were characterized and compared with raw DE previously characterized2.
The chemical and mineralogical composition of raw DE and extracted silica, obtained from all the employed methods, were determined using X-ray fluorescence (XRF) from ThermosFisher ARL Perform'X Sequential instrument (Basel, Switzerland) and X-ray diffraction (XRD) from Bruker (Bremen, Germany), respectively. XRD analysis was done at iThemba Labs, South Africa, using a PANalytical X'Pert Pro powder diffractometer in θ-θ cofiguration with an X'Celerator detector, variable divergence, and fixed receiving slits with Fe-filtered Co-Κα radiation (λ = 1.789 A). Scanning electron microscope and energy dispersion X-ray spectroscope (EDX) with field emission gun (FEI Nova NanoSEM 230, Eindhoven, Netherlands) were used to examine the morphology and elemental composition of raw DE and the extracted silica samples. An FEI T20 transmission electron microscope (TEM) with a CCD camera embedded (2048 x 2048) was used for further morphological evaluation. These were carried out at the Aaron Klug centre for imaging and analysis, University of Cape Town, South Africa.
3. Results and Discussion
3.1. Design of Experiments
The central composite design (CCD) of the response surface methodology was chosen for experimental design because of its flexibility and ability to predict the effect factors have on responses above and below the set points. Two main parameters were selected in the CSE method, four in the alkali UAE method and five in the acid UAE method to optimize silica extraction to avoid overfitting, which occurs if the models have too many parameters.19 The range of parameters optimized in the methods (shown in Table 1) and their experimental design and corresponding responses are shown in Table S1.
3.2. RSM Model
The model chosen for the experimental design of the CSE, acid UAE and alkali UAE methods was a quadratic model of the central composite design (CCD) based on the number of factors to be optimized. The model predictions for percentage purity and percentage yield of extracted silica were compared with the experimental data. They were plotted in Fig. 1 to provide the coefficient of determination for each of them. The coefficient of determination indicated that the predicted and actual values for all the methods employed are in good agreement13,22, especially for the alkali UAE method (Figs. 1a and 1b), where the R2 is 1 for percentage yield and 0.99 for percentage purity.
Analysis of variance (ANOVA) was used to infer which terms were statistically significant in each quadratic model. The values are presented in Table S2 and summarized in the Pareto charts in Fig. 2. In Figs. 2a and 2b, the most significant factors affecting the yield of silica extracted in the alkali UAE method are the alkali concentration, stirring time in the CSE method and sonication time in the acid UAE method. The purity of extracted silica is mainly determined by the cycle of applied sonication waves in the alkali UAE method, stirring time in the CSE method and the interaction of concentration and amplitude of sonication waves.
In Table S1, the p-values for all the models were less than 0.05, which usually indicates that the models are significant,2 meaning that the quadratic model of the CCD chosen was sufficient to represent silica extraction. This model is in agreement with what was found by Adebisi el al.13, Olawale el al.22, Matlob et al.23and Qisti el al.24 However, p-values for many of the terms in the CSE and acid UAE methods were greater than 0.05. This value means that those terms are not significant model terms implying that they do not directly impact the percentage yield or the percentage purity of silica extracted. The calculated variance, F2, of these model terms were greater than those predicted by the model. For example, all modelled factors directly impact the percentage yield and purity of silica extracted in the alkali UAE method since the change in Na+ ions, time, and transient temperature will affect the amount of sodium silicates produced. A study by Matlob el al.23also found that a change in NaOH concentration, exposure time and microwave power level significantly affected the concentration of Si in coal fly ash extracts. On the other hand, neither concentration of alkali nor stirring time nor the interaction as their crossed vector of both nor their quadratic functions had any effect on percentage yield in the CSE method. The assumption here is that the yield depends on the skill of the operator in recovering all the silica formed, but this could not be verified. However, the percentage purity of silica extracted is influenced by stirring time, the interaction between stirring time and concentration of alkali, and the quadratic function of stirring time because there is more time for the silica in DE to interact with NaOH to form silicates. The influence of the factors listed above on the percentage purity of silica is in agreement with the literature findings.23 In the acid UAE method, sonication time, HCl concentration, the interaction between sonication time and amplitude, concentration and cycle, concentration and amplitude, and cycle and amplitude are factors that affect percentage yield. In contrast, only changes in HCl concentration affects the amount of silica extracted. This effect is because a change in the amount of Cl- and time of contact between the ion and DE means a change in the number of ions and the time available to chloridize elements that form impurities and hence a change in purity and yield of silica formed.25
Generally, the higher the Fischer's (F-test) value and the lower the probability (p-value) for a particular model term, the more significant, statistically, the model term is. For this study, a high F-test and low p-value implies that the factors play a greater role in achieving a higher percentage yield and a larger amount of extracted silica. The CSE method has a significant lack of fit due to the low p-values, which means that the model does not fit and is not adequate to represent the relationship between the responses and the independent variables.26
Response surface optimization
Three-dimensional surface plots were constructed to determine optimal levels of the various factors for the extraction of silica. The effect of the various factors and their mutual interaction on the percentage yield and percentage of extracted silica can be seen in Figs. 2, 3 and 4.
3.2.1. Ultrasound-assisted Extraction under Basic Conditions (Alkali UAE)
Considering the NaOH concentration and the pH used for the alkali extraction of silica, the OH- ions etched on the DE matrix dissolve it to form soluble silicates and leave behind impurities.
Silica is then recovered from the solution by acidification. The higher the alkali concentration, and the longer the contact time, the more the silica dissolved and consequently, the higher the yield of silica. From the percentage yield plots in Fig. 3, the amount of silica extracted increased with increased sonication time, concentration, amplitude and cycle. The reason for this could be that the more time DE was ultra-sonicated in the alkali medium, the more Si was leached into solution as aided by cavitation energy. The reason stated above is in line with previously observed trends.23,24,27 The optimum parameters for silica extraction using the Alkali UAE method were chosen as 1.6 h for sonication time, 1 M NaOH, 0.66 for the cycle and 60 % amplitude with a desirability of 1.
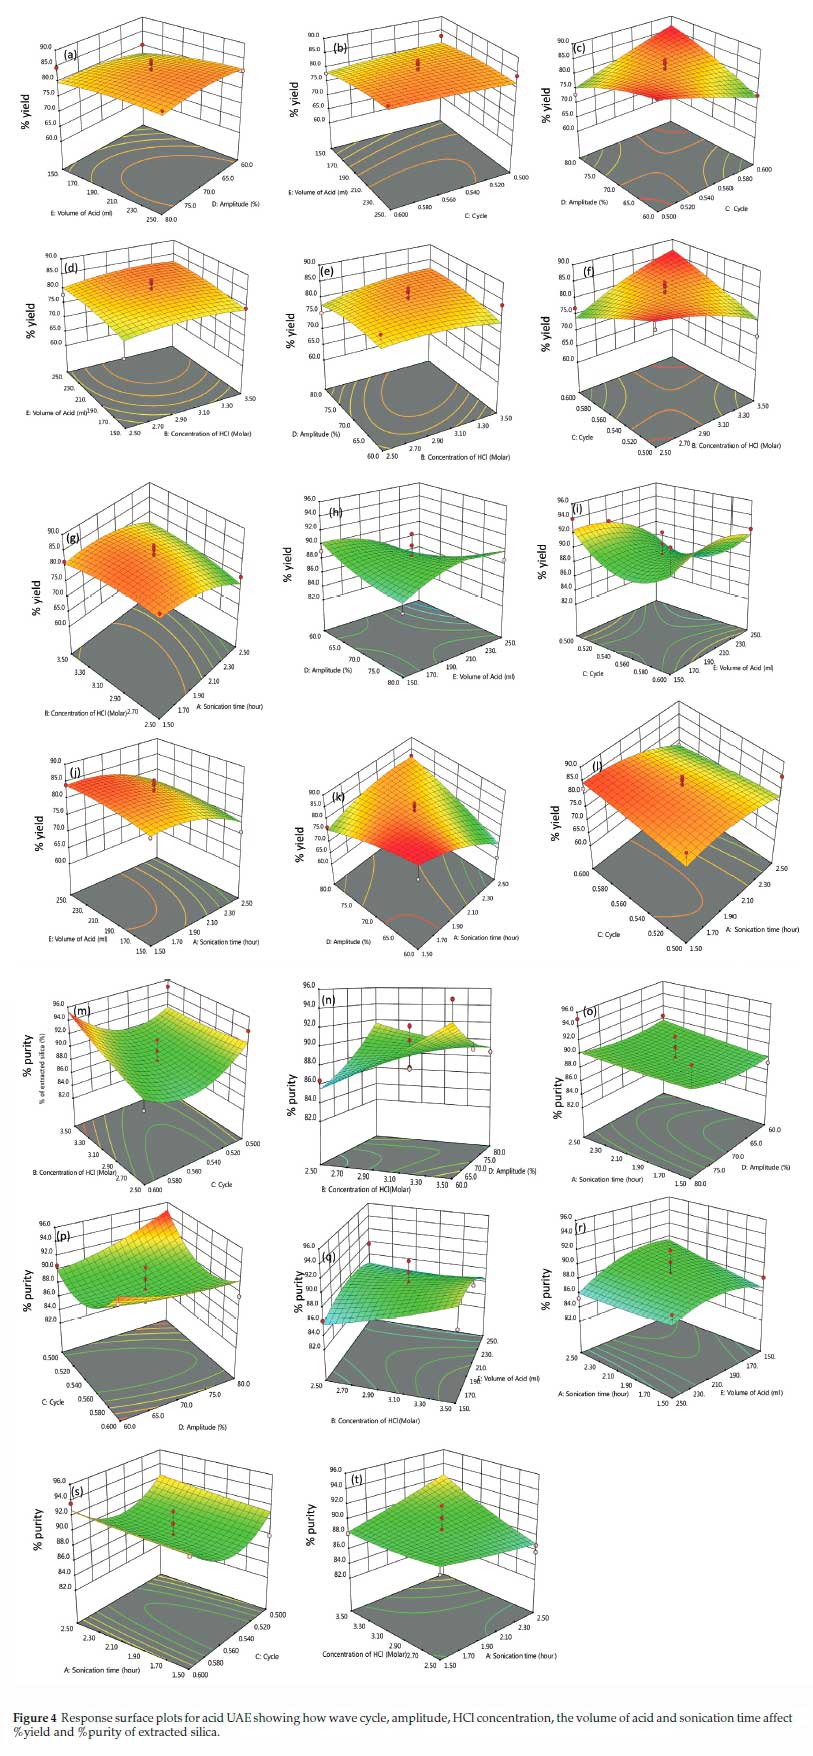
3.2.2. Ultrasound-assisted Extraction under Acidic Conditions (Acid UAE)
The response surface plots for the acid UAE method (Fig. 4) showed that percentage yield increased up to a maximum and then decreased as the volume of HCl, amplitude, HCl concentration, and sonication time increased (a, d, e, g, h, j). Also, the percentage yield increased slightly as the cycle increased (b, c, f, i), probably because HCl dissolves the impurities by chloridizing them, that is, by attacking the basic component in DE, releasing silica in the process.25 This process is aided by the ultrasonic boom waves and cavitation energy transferred to the DE, thereby increasing the yield. However, as more HCl is introduced or as the HCl concentration, sonication time and amplitude increase, the silica begins to polymerize, resulting in a lower yield.28 This explanation is consistent with findings by Gorrepati et al.28Percentage purity, on the other hand, decreases up to a minimum and increases with amplitude and cycle (k, l, m, p, r, s). It also increases to a maximum and decreases with HCl volume (k, l, n, q). It increases with HCl concentration (n, o, p, t) and increases slightly with sonication time (q, r, s). The increase in percentage purity with sonication time, volume and concentration of HCl could be for the same reason as the percentage yield change. The change in the percentage extracted silica could be due to polymerization of silica as the amplitude and the cycle increase, particularly in the pockets of high temperature formed during sonication, re-precipitation, and silica aggregation as a result of supersaturation of the solution.
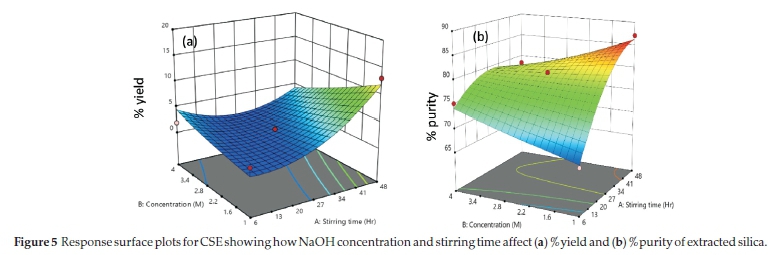
3.2.3. Conventional Solvent Extraction (CSE)
From the response surface plots for stirring (Fig. 5a), we see that percentage yield and percentage purity increases with NaOH concentration and stirring time. There are more hydroxide ions available and longer contact time between silica and NaOH to form silicates. In Fig. 5b, the percentage purity increased, reaching a maximum and then decreasing. The percentage purity trend could be due to the silica re-precipitation from the silicates, making it unavailable for recovery from the filtrate. The optimum parameters were 33.5 h stirring time and 1 M NaOH concentration with a desirability of 0.9. These results are similar to those from previously published works.23,24,27
3.3. Characterization of Diatomaceous Earth and Extracted Silica
Silica extracted using the methods listed above were characterized using SEM, SEM-EDX and TEM and compared with those of raw DE.
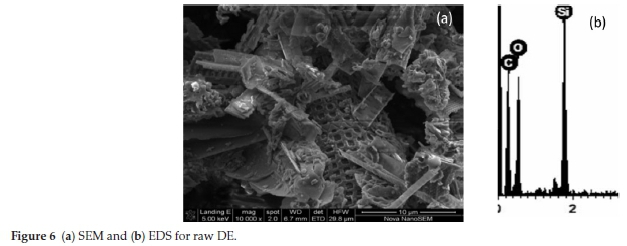
3.3.1. Raw DE
Figure 6a is the SEM image of raw DE (10 μm magnification), shows rectangular pores arranged in a regular pattern on each diatom and Fig. 6b shows the energy dispersion spectroscopy (EDS) spectrum as obtained on similar DE samples by Izuagie et al2The spectral data shows the major elements of DE are Si, O and C, confirming that DE is a silicate material. The C content may be due to the carbon coating during SEM analysis.29
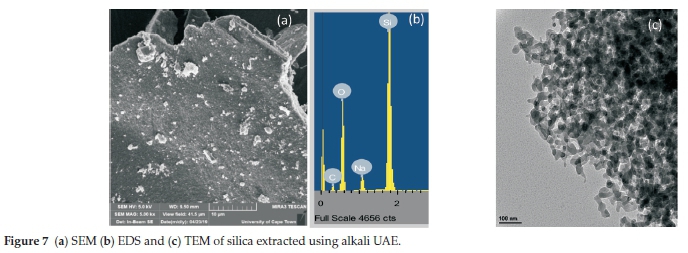
3.3.2. Alkali UAE
The SEM image for the extracted silica sample with a percentage purity of 79.2 % obtained from the alkali UAE method (Sample 9, Table 2) is shown in Fig. 7a. The figure shows no visible external pores at 10 μm magnification. The absence of external pores may limit its application as adsorbents, as opined by Tae tl al30The TEM image (Fig. 7c) shows that the silica particles are clustered in aggregates, brought about by attraction (possibly Van der Waals forces).31 Their mean particle size was about was 40.25 nm. The dark portions on the image may indicate the presence of pores.32 EDS spectrum (Fig. 7b) showed the sample contains O, Na and Si, showing a higher Si percentage than in DE. The presence of C is a result of the carbon tape holding the material during SEM analysis. The low Na content recorded is likely due to the use of NaOH in extraction.
3.3.3. Acid UAE
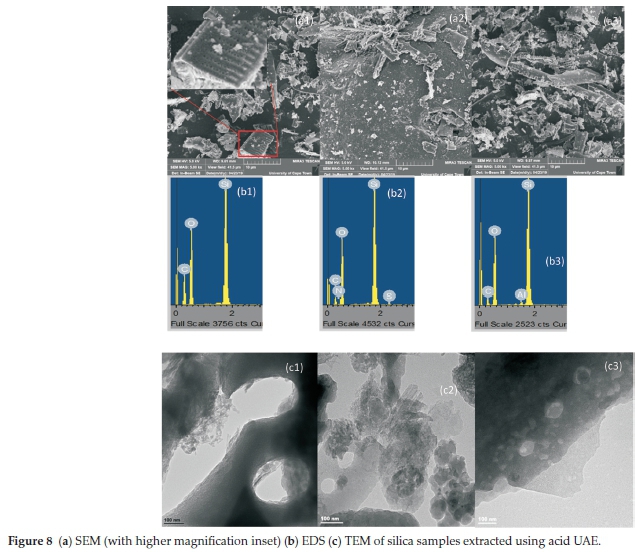
The morphology and chemical composition of three samples from the acid UAE method were studied. Sample 1 (sample 25 in Table 2), had 95.1 % silica (as obtained from an XRF), sample 2 had 94.3 % (sample 7 in Table 2) and sample 3 had 94.0 % SiO2 (sample 30 in Table 2). The SEM pictures of samples 1 and 3 (Figs. 8a1 and 8a3) show pores arranged in a regular pattern on the surface, while the picture of sample 2 (Fig. 8a2) does not show external pores. All three SEM images show rod-like silica particles. The TEM images for samples 2 and 3 (Figs. 8c2 and 8c3) show oval pores arranged in a regular pattern on the surfaces with additional aggregated particles on sample 2. Sample 1 (Fig. 8a1) shows a dense mass of silica particles with clusters around irregularly shaped pores. The EDS spectra (Figs. 8b1, 8b2 and 8b3) show that all the compounds contain mostly Si and O. The presence of N, S, Al and C could result from impurities during sample handling. Particle size obtained from the TEM images using Image-J software was as follows: Sample 1 - 35.3 nm; Sample 2 - 31.5 nm and Sample 3 - 38.8 nm.
Two parallel experiments were carried out using the optimized conditions, 2 h for sonication time, 2.82 M for HCl concentration, 220 mL for volume, and 0.524 for the cycle and 72.6 % amplitude. The Design Expert software predicted the responses to be 76.9 % for yield and 84.1 % for silica percentage, and the experimental results were 84.1 % and 98.5 % for percentage yield and percentage purity. These values are consistent with the about 60 % correlation observed in Fig. 1, which shows that the optimization parameters proposed are reliable.
3.3.4. Conventional Solvent Extraction (CSE)
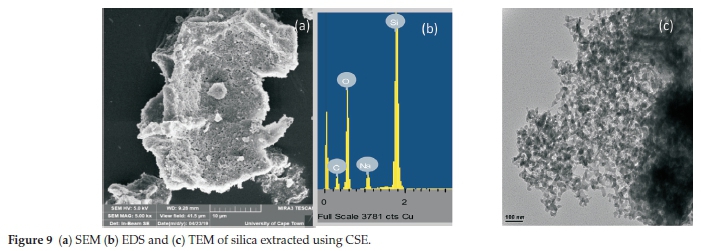
Figures 9a, 9b, and 9c are pictures for SEM, TEM and EDS for sample 2 (Fig. 2), respectively. The pictures are identical to those from the alkali UAE method because the methods of synthesis are identical. The SEM image shows no external pores, but the TEM image shows a well-formed pore system in an aggregated system similar to that in Fig. 7b. Major elements present as seen in the EDS spectra are Si and O. The TEM image shows that silica exists as small particles which come together to form a giant particle, possibly as a result of attractive forces. The calculated average particle size was 36.77 nm. The same trend was observed by Adebisi el al.33
3.4. XRD Plots of Silica extracted under Alkali UAE, Acid UAE and CSE
The XRD plots in Fig. 10 show that silica obtained from the acid UAE method (Samples 7, 25 and 30) are mainly crystalline. In contrast, samples obtained from the alkali UAE and CSE methods are amorphous. Most researchers have reported the amorphous nature of silica produced from several sources.12,16,31 This is because NaOH used in these methods and the CSE and alkali UAE methods only dissolve amorphous silica. However, Fernandes et al12reported crystalline silica formation at temperatures above 800 °C. The findings by Fernandes et al12would explain the crystalline phases observed in the acid UAE method4.

4. Conclusions
Response surface methodology was successfully employed to optimize silica extraction from DE. However, the amount of silica extracted was less than that contained in DE in the CSE and alkali UAE methods, probably because extraction time was not long enough or the temperature not high enough to dissolve all the silica in DE. The acid UAE method gave the best results for the recovery and purity of Si. The optimum parameters for the acid UAE were found to be 2 h for sonication time, 2.82 M for HCl concentration, 220 mL for volume, 0.524 for the cycle and 72.6 % amplitude with a desirability of 1.00 for 20 g of DE. The results proved that acid leaching is an important step in the extraction and purification of silica from DE and RSM is useful to determine optimum conditions for extraction accurately. The experimental results indicate that that high-quality silica can be produced from DE in high yield and so, DE can be an alternative silica source.
Supplementary Material
Supplementary information is provided in the online supplement.
ORCID iDs
O.U. Izevbekhai: orcid.org/0000-0003-0989-4840
W.M. Gitari: orcid.org/0000-0002-6387-0682
N.T. Tavengwa: orcid.org/0000-0003-4699-2394
References
1 L.E. Antonides, Diatomite, U.S. Geological Survey Mineral Commodity Summaries, 1998, 56-57. [ Links ]
2 A.A. Izuagie, W.M. Gitari and J.R. Gumbo, Defluoridation of groundwater using diatomaceous earth: optimisation of adsorption conditions, kinetics and leached metals risk assessment, Desalin. Waler Treal, 2016, 57, 16745-16757. [ Links ]
3 H.E.G.M. MohamedBakr, Diatomite: its characterization, modifications and applications, Asian J. Maler. Sci., 2010, 2, 121-136. [ Links ]
4 M. Mazidi, R. Mosayebi Behbahani and A. Fazeli, Screening of treated diatomaceous earth to apply as V2O5 catalyst support, Maler. Res. Innovalions, 2017, 21, 269-278. [ Links ]
5 B.H. Subramanyam, O.L. Swanson, N. Madamanchi and S. Norwood, in 6lh Inlernalional Working Conference on Slored-producl Proleclion, Canberra, 1994, pp. 650-659. [ Links ]
6 W.T. Tsai, K.J. Hsien, Y.M. Chang and C.C. Lo, Removal of herbicide paraquat from an aqueous solution by adsorption onto spent and treated diatomaceous earth, Bioresour. Technol., 2005, 96, 657-663. [ Links ]
7 K.I. Vatalis, G. Charalambides and N.P. Benetis, Market of high purity quartz innovative applications, Procedia Econ. Finance, 2015, 24, 734-742. [ Links ]
8 M. Bessho, Y. Fukunaka, H. Kusuda and T. Nishiyama, High-grade silica refined from diatomaceous earth for solar-grade silicon production, Energy Fuels, 2009, 23, 4160-4165. [ Links ]
9 E. Rafiee, S. Shahebrahimi, M. Feyzi and M. Shaterzadeh, Optimisation of synthesis and characterisation of nano-silica produced from rice husk (a common waste material), Int. Nano Lett., 2012, 2, 29-33. [ Links ]
10 V.B. Carmona, R.M. Oliveira, W.T.L. Silva, L.H.C. Mattoso and J.M. Marconcini, Nanosilica from rice husk: extraction and characterisation, Ind. Crops Producls, 2013,43, 291-296. [ Links ]
11 B.S. Todkar, O.A. Deorukhkar and S.M. Deshmukh, Extraction of silica from rice husk, Inl. J. Eng. Res. Dev., 2016,12, 69-74. [ Links ]
12 I.J. Fernandes, D. Calheiro, F.A.L. Sánchez, A.L.D. Camacho, T.L.A.d.C. Rocha, C.A.M. Moraes and V.C. d. Sousa, Characterisation of silica produced from rice husk ash: comparison of purification and processing methods, Maler. Res., 2017, 20, 512-518. [ Links ]
13 J.A. Adebisi, J.O. Agunsoye, S.A. Bello, F.O. Kolawole, M.M. Ramakokovhu, M.O. Daramola and S.B. Hassan, Extraction of silica from sugarcane bagasse, cassava periderm and maize stalk: proximate analysis and physico-chemical properties of wastes, Wasle Bio-mass Valor, 2017, 1-14. [ Links ]
14 P.R. Harish, A. Arumugam and V. Ponnusami, Recovery of silica from various low-cost precursors for the synthesis of silica gel, Pharm. Lell., 2015, 7 208-213. [ Links ]
15 F.C. Pa, A. Chik and M.F. Bari, Palm ash as an alternative source for silica production, MATEC Web Conf., 2016, 78, 01062. [ Links ]
16 E.A. Okoronkwo, P.E. Imoisili, S.A. Olubayode and S.O.O. Olusunle, Development of silica nanoparticle from corn cob ash, Adv. Nanoparl, 2016, 05, 135-139. [ Links ]
17 A.O. Ogunfowokan, T.C. Ezenwafor and P.E. Imoisili in Nigerian Malerials Congress (NIMACON 2011), Akure, 2011, pp. 1-7. [ Links ]
18 S. Sekar, N. Kaur, S. Lee and D. Kim, Rapid sonochemical synthesis of spherical silica nanoparticles derived from brown rice husk, Ceram. Inl., 2018. [ Links ]
19 W. Zhao, J. Shi, H. Chen and L. Zhang, Particle size, uniformity, and mesostructure control of magnetic core/mesoporous silica shell nanocomposite spheres, J. Maler. Res., 2011, 21, 3080-3089. [ Links ]
20 G.E.P. Box, J.S. Hunter and WG. Hunter, Slalislics for Experimenlers: Design, Innovalion and Discovery, vol. 2, 2nd edn., Wiley-Interscience, Hoboken, New Jersey, USA, 2005. [ Links ]
21 M. Bessho, K. Umehara, T. Takaura, T. Nishiyama and H. Shingu, The potential of production of high-purity silica from biogenic diatoma-ceous earth, Shigen-lo-Sozai, 2001,117, 736-742. [ Links ]
22 O. Olawale, A. Akinmoladun, I.F.A. Oyawale and A.O. Baba, Application of response surface methodology for optimisation of amorphous silica extractedfrom rice husk, Inl. J. Sci. Eng. Res., 2012,3,2229-5518. [ Links ]
23 A.S. Matlob, R.A. Kamarudin, Z. Jubri and Z. Ramli, Using the response surface methodology to optimise the extraction of silica and alumina from coal fly ash for the synthesis of zeolite Na-A, Arabian J. Sci. Eng., 2011, 37, 27-40. [ Links ]
24 N. Qisti and N.S. Indrasti, Suprihatin., in IOP Conference Series: Male-rials Science and Engineering, Second International Conference on Chemical Engineering (ICCE) UNPAR, 2017. [ Links ]
25 Y. Kuwahara, T. Ohmichi, T. Kamegawa, K. Mori and H. Yamashita, A novel conversion process for waste slag: synthesis of a hydrotalcite-like compound and zeolite from blast furnace slag and evaluation of adsorption capacities, J. Mater. Chem., 2010, 20. [ Links ]
26 J. Pilkington, L.C. Preston and R. Gomes, Comparison of response surface methodology (RSM) and artificial neural networks (ANN) towards efficient extraction of artemisinin from Artemisia annua, Ind. Crops Products, 2014, 58, 15-24. [ Links ]
27 F. Jendoubi, A. Mgaidi and M.E. Maaoui, Kinetics of the dissolution of silica in aqueous sodium hydroxide solutions at high pressure and temperature, Can. J. Chem. Eng., 1997, 75, 721-727. [ Links ]
28 E.A. Gorrepati, P. Wongthahan, S. Raha and H.S. Fogler, Silica precipitation in acidic solutions: mechanism, pH effect, and salt effect, Langmuir, 2010, 26, 10467-10474. [ Links ]
29 S. Banerjee, S. Dubey, R.K. Gautam, M.C. Chattopadhyaya and Y.C. Sharma, Adsorption characteristics of alumina nanoparticles for the removal of hazardous dye, Orange G from aqueous solutions, Arabian J. Chem., 2017. [ Links ]
30 H. Tae, K. Yang D. Ji and H.a.N. Musaev, Comparative adsorption of highly porous and raw adsorbents for the elimination of copper (II) ions from wastewaters, Trends Chromatogr. 2013, 8, 97-108. [ Links ]
31 M. Naddaf, H. Kafa and I. Ghanem, Extraction and characterisation of nano-silica from olive stones, Silicon, 2019. [ Links ]
32 G. Ban, S. Song, H.W. Lee and H.T. Kim, Effect of acidity levels and feed rate on the porosity of aerogel extracted from rice husk under ambient pressure, Nanomaterials (Basel), 2019, 9, 300. [ Links ]
33 J.A. Adebisi, J.O. Agunsoye, S.A. Bello, M. Haris, M.M. Rama-kokovhu, M.O. Daramola and S.B. Hassan, Green production of silica nanoparticles from maize stalk, Part. Sci. Technol., 2019, 1-9. [ Links ]
Received 5 May 2020
Revised 26 July 2020
Accepted 19 October 2020
* To whom correspondence should be addressed. E-mail: O.U.I., oisaemii@gmail.com / W.M.G., mugeraw@gmail.com
Supplementary Data
The supplementary data is available in pdf: [Supplementary data]

