


Services on Demand
Article
 English (pdf)
 Article in xml format
 Article references
Indicators

Related links
-
 Cited by Google
 -
 Similars in Google
Share

 Permalink
South African Journal of Chemistry
On-line version ISSN 1996-840X
Print version ISSN 0379-4350
S.Afr.j.chem. (Online) vol.75 Durban 2021
http://dx.doi.org/10.17159/0379-4350/2021/v75a7
RESEARCH ARTICLE
https://doi.org/10.17159/0379-4350/2021/v75a7
Optimization and Kinetic Modelling of Total Phenols and Flavonoids Extraction from Tilia cordata M. Flowers
Milan MiticI; Sonja JankovicI,*; Snezana MiticI; Gordana KocicII; Pavle MaskovicIII; Dragutin DukicIII
IDepartment of Chemistry, Faculty of Sciences and Mathematics, University of Nisi, Visegradska 33, 18000 Nis, Serbia
IIVacuity of Medicine, University of Nisi, Dr Zorana Dindica 81, 18000 Nisi, Serbia
IIIFaculty of Agronomy, University of Kragujevac, Cara Dusana 34, 32000 Cacak, Serbia
ABSTRACT
The main goal was to optimize and establish the kinetics and the thermodynamics of the extraction process. An investigation into the effects of ethanol concentration (0-100 %), liquid to solid ratio (30-60 mL g-1), extraction temperature (25-65 °C), and extraction time (40-200 min) on the extraction of total phenols (TP) and total flavonoids (TF) from linden (Tilia cordata M.) flowers was performed using single-factor experiments. Experimental results showed that extraction conditions had a significant effect on the extraction of phenolic compounds. The optimized conditions were 50 % ethanol, liquid to solid ratio 60 mL g-1 for 120 min at 55 °C, with values of 17.05 mg GAE g-1 dry weight (d.w.) for TP and 13.32 mg CE g-1 d.w. for TF. Extracted phenolic compounds were analyzed by HPLC. The antioxidant activity of the extracts was evaluated by DPPH and ABTS assays. The applicability of different mathematical models (model based for the unsteady diffusion through the plant material, model based on the film theory and model of Ponomaryov) to describe the kinetics of the extraction process of TP and TF from linden flowers was studied as well. The mathematical models applied showed a good agreement with the experimental results, which allows their application in modelling and optimizing the solid/liquid extraction process to extract TP and TF from linden flowers.
Keywords: Extraction conditions, phenolic compounds, antioxidant activity, mathematical models.
1. Introduction
Plants, their extracts or pure components isolated from them are used in various industries, such as pharmaceutical, cosmetic, food, etc. During the last few decades, consumption of the plants and its products have been constantly growing. Studies showed that several classes of compounds present in these plants are responsible for biological activity. Among these compounds are phenolic compounds that represent a class of compounds tested for years, even decades, due to their multiple positive and useful effects in the human body, primarily as fighters against various diseases. It was shown that these compounds show a wide range of activities, such as antioxidant, antimicrobial, antiviral, antiallergic, anti-inflammatory, cytotoxic, as well as many other activities.1
The genus Tilia L. from the Malvaceae family (native to Europe, Asia and North America), consists of about 44 species and two hybrids.2Tilia cordata, Miller (Malvaceae), also known as linden, is a tall deciduous tree reaching up to 25 m. Linden is cultivated in Europe and North America. The commercial products are obtained mainly from T. cordata and Tilia platyphyllos Scopoli, (Malvaceae). The yellowish-white flowers of T. cordata are arranged in clusters of 3-15 on a stalked erect cyme, and half joined to a membranous bract occurring in the leaf axils. The flowers are used, externally and internally, as a medicinal plant for the treatment of different ailments.3-4 The use of the flowers of T. cordata for therapeutic purposes dates back to the Middle Ages, and many pharmacological activities, such as antitussive, diaphoretic, diuretic, sedative, spasmolytic, hypotensive, as well as emolient and mild astringent activities, have been reported.5 The flowers of T. cordata are rich in carbohydrates, amino acids, and different secondary metabolites: phenolic acids (caffeic acid, p-coumaric, and chlorogenic acids), amino acids, polysaccharides, flavonoids (kaempferol, quercetin, myricetin and their glycosides, such as rutin, hyperoside, quercitrin, and isoquercitrin), volatile oils, and tannins.5-6
Presence of quercetin, kaempferol and their derivatives and phenolic acids in Tilia spp. were confirmed in previous studies. In 2014, Akyuz et al.7 analyzed phenolic compounds of the various blossom, leaf, and trunk extracts of T. rubra subsp. caucasica growing in Turkey by HPLC-UV and HPLC-UVMS. They reported high amounts of total phenolics (17.548 ± 0.04mg of gallic acid per g of dried sample) and total flavonoids (0.066 ± 0.19 mg of quercetin per g of dried sample), with the presence of some phenolic compounds, such as rutin, quercetin, catechin, caffeic acid, ferulic acid, chlorogenic acid, p-hydroxybenzoic acid, gallic acid and protocatechuic acid in T. rubra subsp. caucasica leaf.8 Myricetin, quercetin and kaempferol have been detected in T. platyphyllos.9Quercetin has also been detected by HPLC in T. rubra and T. argentea leaves.
Extraction is a very important stage in the isolation, as well as the identification, of phenolic compounds. Solid-liquid extraction, also called leaching, has been widely used for recovering bioactive compounds from different parts of many plants using a suitable solvent. This process is based on diffusion of extractable bioactive compounds through the plant particles, followed by their dissolution in the bulk of the extracting solvent. However, the compositions of natural sources of phenolic compounds and the structure and physicochemical properties make a universal extraction protocol not conceivable. A definite extraction procedure must be designed and optimized for each phenolic source.10-11
The two most used optimization studies are single factor experiments and response surface methodology (RMS). In this study single factor experiments were used, despite being time-consuming and having several drawbacks, such as lack of information on the factors' interaction.7 However, fundamental information on the ranges for extraction parameters (factors) that showed significant effects (P < 0.05) on the extraction of phenolic compounds from Tilia cordata M. flowers was obtained.
To optimize the extraction conditions, experimental data are often used for mathematical modelling. Mathematical modelling of solid-liquid extraction processes is an important engineering tool in the design process to reduce energy, time, and chemical reagents consumption. Kinetic modelling is of great importance for understanding complex diffusion, mass transfer and thermodynamic parameters affecting the extraction.
This study aimed to investigate the effect of ethanol concentration, liquid-solid ratio, time and temperature on the extraction of total phenols and total flavonoids from Tilia cordata M. flowers. Furthermore, we fitted three different kinetic models on the extraction data to verify the best description of the process's kinetic behaviour. Finally, thermodynamic parameters (entropy, enthalpy, and Gibb free energy) were determined.
2. Experimental
2.1. Plant Materials
The plant materials were harvested by hand in the morning, during the period of full blooming in three locations in southeastern Serbia. The herb materials were dried immediately after harvesting in a shady and well-aired place for 15 days. The dry plant materials were then packed in paper bags and kept in a dark, dry and cool place. Before being used, the plant material was comminuted by a hammer mill and sieved through a 6 mm screen.
2.2. Chemicals and Reagents
Folin-Ciocalteu reagent, aluminium chloride, gallic acid, 2,2-diphenyl-1-picrylhydrazyl (DPPH), 2,2'-azino-bis (3-ethyl-benzothiazoline-6-sulfonic acid (ABTS), potassium-persulfate and catechin were purchased from the Sigma Chemical Corporation, St. Louis, MO, USA. All HPLC analysis standards were of analytical grade and were purchased from Sigma Chemical Corporation, St. Louis, USA) and Alfa Aesar (Karlsruhe, Germany). Acetonitrile, ethanol, methanol, and formic acid were purchased from Aldrich Chemical Co., Steinheim, Germany.
2.3. Initial Contents of Phenols and Flavonoids in Linden Flowers (qo)
Dried linden flowers (1 g) was transferred into a 250 mL Erlenmeyer flask with a ground stopper and covered with 100 mL of the freshly prepared extraction solvent. The extraction was carried out by the maceration method for 120 min.12 The extract was separated from the residues by filtering through the Whatman No. 1 filter paper. The residues were extracted twice with the same freshly prepared extraction solvent and the extracts were combined. The combined extracts were concentrated and freed of solvent under reduced pressure at 45 °C, using a rotary evaporator (BUCHI Rotavapor R-200). The crude concentrated extracts were stored and diluted before use. The contents of total phenols (TP) and total flavonoids (TF) were determined spectrophotometrically (Shimadzu Spectrophoto-meter UV-1800, Japan). The extracts from dried plant material were prepared thrice, and the results averaged.
2.4. Determination of Total Phenols in Extracts
Total phenols (TP) were analyzed using the Folin-Ciocalteu method.13 The reaction mixture was prepared by mixing the diluted plant extract (0.5 mL), 7.5 mL distilled water, 0.5 mL Folin-Ciocalteu reagent and 1.5 mL 20 % Na2CO3. After 2 h at room temperature, the absorbance was measured at 760 nm using a Shimadzu Spectrophotometer UV-1800 (Japan). The procedure was repeated twice for each extract. Based on the absorbance of standard solutions of gallic acid, concentrations of polyphenolic compounds (ug mL-1) were determined using the equation A = 0.0835 [GA] + 0.0064 (n = 7 (where n = number of experimental repetition), r2 = 0.9996), where [GA] is the concentration of gallic acid. The extract's TP are expressed in mg of gallic acid equivalent (GAE) in a gram of dry weight (d.w.) ± standard deviation (S.D.) (mg GAE g-1 d.w. ± S.D.).
2.5. Determination of Total Flavonoids in Extracts
The method is based on the fact that flavonoids form complexes with metal cations (such as Al3+). The reaction mixture was prepared using the following ingredients - 0.25 mL of diluted plant extract, 4 mL of deionized water and 0.3 mL 5 % NaNO2. After 5 min, 1.5 mL 2 % AlCl3 was added, followed 5 min later by 2 mL 1 mol L-1 NaOH, and deionized water up to 10 mL. Absorbances were measured at415 nm against deionized water (blank) using a Shimadzu Spectrophotometer UV-1800 (Japan).14 Based on absorbances of the standard catechin solution, concentrations of flavonoids (ag mL-1) were obtained using the equationA = 0.0252 [C] + 0.006 (n = 7,r2 = 0.9995),where [C] is the concentration of catechin. TF in the extract are shown as mg of catechin equivalent (CE) in a gram of dry weight (d.w.) ± standard deviation (S.D.) (mg CE g-1 d.w. ± S.D.).
2.6. Determination of the Antioxidant Activity of the Extracts
The activity of extracts to scavenge a cation radical, namely 2,2'-azinobis-(3-ethylbenzothiaziline-6-sulfonate (ABTS'+) was carried out according to the method of Gong et al.15The scavenging effects of the extracts on a free radical, namely 2,2-di-phenyl-1-picrilhydrazyl (DPPH') were monitored according to the method of Alothman et al.16
2.7. HPLC Analysis of the Extracts
Quantification of individual phenolic compounds was determined using reversed-phase HPLC method. An Agilent-1200 series HPLC with UV-Vis DAD for multi-wavelength detection was used. The column was thermostated at 30 °C. After injecting 5 aL of the diluted plant extract, the separation was performed in an Agilent-Eclipse XDB C-184.6 x 150 mm column. Two solvents were used for the gradient elution: A (H2O+2% HCOOH) and B (80 % acetonitrile (ACN) +5 % HCOOH + H2O). The elution programme used was as follows: from 0 to 10 min0%B, from 10 to 28 min gradually increases 0-25 % B, from 28 to 30 min 25 % B, from 30 to 35 min gradually increases 25-50 % B, from 35 to 40 min gradually increases 50-80 % B, and finally for the last 5 min gradually decreases 80-0 % B. Flow rate of the mobile phase was 0.8 mL min-1.17
Phenolic components present in the extracts were identified by comparing their retention times and spectra with pure components. The following standards were used: chlorogenic acid, p-coumaric acid, myricetin, rutin, quercetin, isoquercetin, and kaempferol. Quantitative determination of components was performed using an external standard. For each standard, stock solutions (1 mg mL-1) were prepared in 10 % methanol. A calibration graph was constructed for each standard. Concentrations of components in extracts were calculated from obtained calibration graph. All analyses were performed in triplicate.
2.8. The Contents of Phenols and Flavonoids in Saturated Liquid Extracts (cmax)
Macerated dried linden flowers (1 g) were transferred into a 250 mL Erlenmeyer flask with a ground stopper and covered with 100 mL of the extraction solvent. The extraction was carried out by the maceration method for 120 min. The liquid extract was separated as before and used for extracting the phenolic compounds from a further portion (1 g) of the fresh plant material. The extraction was repeated with the liquid extract and an additional quantity of fresh plant material (1 g). The extraction solvent was evaporated under rotary evaporator at 45 °C. The crude concentrated extract was dissolved using extraction solvent until used for analyses. The contents of total phenols and flavonoids were determined spectrophotometrically using a Shimadzu Spectrophotometer UV-1800, (Japan).
2.9. Optimization of the Extraction Procedure using Single-factor Experiments
2.9.1. Extraction Solvent Concentration
The extraction solvent concentration was investigated using ethanol with concentration ranging from0%to100% (v/v). Each extraction was done at fixed condition of room temperature («25 °C) and 120 min. The best extraction solvent was chosen based on the highest value of TP and TF.
2.9.2. Extraction Solvent/Raw Material Ratio
The impact of extraction solvent/solid ratio on the TP and TF was varied from 30,40,50 and 60 mL g-1. Extraction was accomplished by applying the best extraction solvent concentration, at room temperature and a fixed time of 120 min. The extraction procedures were repeated as described. The best extraction solvent/solid ratio was chosen according to the highest values of TP and TF.
2.9.3. Extraction Time
The impact of extraction time on the TP and TF varied from 40, 80,120,160 and 240 min. Extraction was accomplished by applying the best extraction solvent concentration and the best extraction solvent/solid ratio at room temperature. The extraction procedures were repeated as described. The best extraction time was chosen according to the highest values of TP and TF.
2.9.4. Extraction Temperature
Lastly, the extraction was executed using the best extraction solvent concentration, extraction solvent/solid ratio and extraction time, under various temperatures, 25, 35, 45, 55 and 65 °C. The extraction procedure was repeated. The best extraction temperature was chosen according to the highest values of TP and TF.
2.10. The Kinetics of Extraction
The linden flowers (1 g) and the extracting solvent (60 mL) were put into a series of Erlenmeyer flasks (250 mL), and the
flasks were macerated for 5, 10, 20, 40, 60, 80, and 120 min. The temperature was controlled and maintained at 25 ±0.1 °C. After each time interval, a flask was taken out of the thermostatic bath, and the liquid extract was separated from the plant residues by vacuum filtration. The content of TP and TF in the liquid extracts was determined spectrophotometrically. The procedure was repeated at 35 ± 0.1 °C and 45 ± 0.1 °C.
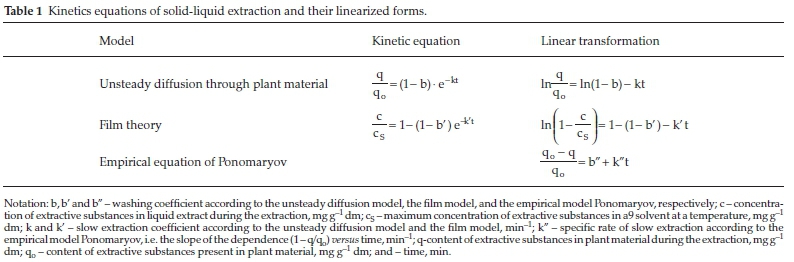
Three different mathematical models for describing the TP and TF extraction kinetics were considered in this study. Their performance in adjusting the data for phenolic compounds extraction from linden flowers using 50 % ethanol was compared. The three models and their respective parameters are shown in Table 1.
2.11. Validity Kinetic Models
The applicability of a kinetic model can be identified using the coefficient of determination (R2), root mean square (RMS),18 and standard deviation (S.D.),19-20 as shown in Equations 1 and 2.
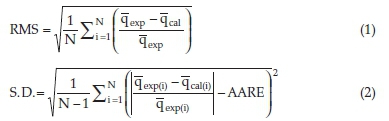
Absolute average relative error (AARE) was calculated by using Equation 3,

The higher the value of R2 and the lower the RMS and S.D., the better the fit.18
2.12. Thermodynamic Study
Activation energy (Ea) can be determined by experimental measurement of the slow extraction coefficient (model based on unsteady diffusion through plant material) at various tempera-turesby using the Arrhenius equation,as shown in Equation 4:

Equation 4 can be converted to the linear expression given in Equation 5.

Here k, A, Ea, R, and T refer to the rate constant (min-1), pre-exponential factor, activation energy (kJ mol-1), gas constant (8.314 J mol-1 K-1), and absolute temperature (K), respectively. Ea and A can be obtained using the slope and y-intercept of the plot of lnk versus 1/T, based on Equation 5.
Thermodynamic parameters (ΔG°, ΔΗ°, ΔS°) were calculated from the van't Hoff equation:

Here ΔG° is the standard Gibbs free energy change (kJ mol1) and is the equilibrium constant, which is defined as follows:
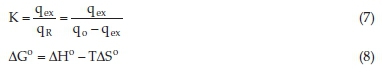
where qex is the TP content or TF content in the extracts, qR is the TP content or TF content that remained in the residual plant material in contact with the extract, and qo is the TP content or TF content in the original plant material. All three values of the dry plant material are in the mg kg-1. Values qo and qex were determined experimentally, while values qR were calculated using the mass balance equation (qR = qo -qex). Equation 9 is obtained by using Equation 6 and Equation 8.

The standard enthalpy change, ΔΗ° (kJ mol-1) and standard entropy change, ΔS° (J mol-1 K-1) can be obtained by using the slope and y-intercept of the plot of lnK versus 1 T-1, based on Equation 9.
2.13. Temperature Extraction Coefficient
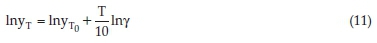
The temperature extraction coefficient, which indicates increasing the extraction of phenolic compounds from linden flowers for every 10 °C increase in extraction temperature, is defined as follows:18

where γ is the temperature extraction coefficient, and yr and yto are the TP or TF yields at temperature T and To (in °C), respectively. The temperature extraction coefficient was calculated from the linearized transformation of Equation 10, i.e.
3. Results and Discussion
3.1. Effect of Extraction Solvent Concentration
The phenolic yield is affected by the solubility of phenolic compounds and the solvent's polarity.22-23 Ethanol, methanol and acetone at different concentrations with distilled water have commonly been used as solvents for the extraction of poly-phenols.12,16,24 In this study different ethanol fractions with distilled water (0 %, 30 %, 50 %, 70 %, 100 %) were used. As shown in Fig. 1, 30 % and 50 % ethanol samples recorded higher phenolic yields than 70 % and 100 % ethanol samples. The high solubility of oxygen can explain this in 80 % and 100 % ethanol samples, which play an important role in facilitating degradation reactions of polyphenols (reactive oxygen species (ROS) are potential oxidizing agents for polyphenols).25-26 Also, the extraction efficiency of the phenolic compounds is reduced by using pure ethanol as the solvent since the phenols, due to a number of hydroxyl groups (such as flavonoids, especially those with sugars in the molecule), are hydrophilic, and as such generally more soluble in water-ethanol solutions than pure alcohol.27 Binary-solvent system demonstrated a higher yield to TP and TF. Compared to the mono-solvent system (water or ethanol) in the present study, previous studies also reported this finding. The influence of the solvent extraction (50-80 % of ethanol) and temperature (25-80 °C) on the extractability of TP from milled soybeans has been published previously.28 The authors reported that 50 % ethanol was the most effective solvent, which is similar to the results obtained in this study. Rostango el al.29found that it is necessary to add a certain amount of water in the extraction solvent to improve the extraction of phenolic compounds.
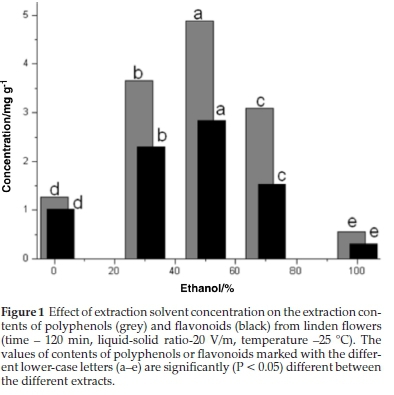
In this study, 50 % ethanol was selected as the best extraction solvent to optimize the subsequent extraction parameters.
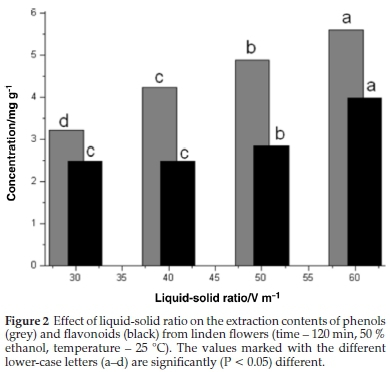
3.2. Effect of Liquid-Solid Ratio
The impact of the liquid-solid ratio on the extraction of TP and TF from linden flowers was tested using four ratios (30, 40, 50, 60 mL g-1) over a 120 min extraction period with 50 % ethanol at 25 °C. The amount of TP and TF extracted per g dry weight (d.w.) is presented in Fig. 2. The increase of TP and TF content with the increase of the liquid-solid ratio is consistent with mass transfer principles. During mass transfer within the solid, the driving force is considered to be the concentration gradient, which was greater when a higher liquid-solid ratio was used, increasing the diffusion rate.30
3.3. Effect of Extraction Time
Extraction time is crucial in solvent extraction of phenolic compounds as an appropriate extraction time can result in time and cost-saving. The effects of extraction time on the phenolic contents (TP and TF) of the extract are shown in Fig. 3. Overall, extraction time had a significant (P < 0.05) effect on the contents of TP and TF.
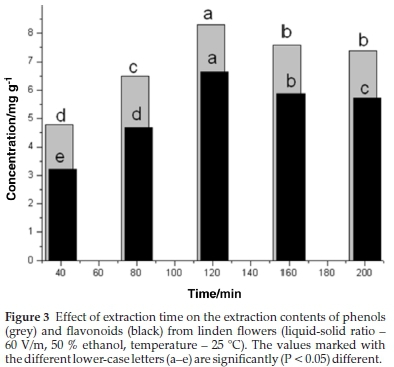
In general, the maximum concentration of phenolic compounds was achieved at an extraction time of 120 min. After this point, the TP and TP decreased. It was believed that prolonged extraction time would lead to more oxygen exposure and thus increase the chances of oxidation on phenolic compounds.31-32 On the other hand, the phenolic contents were observed to have no significant change (P < 0.05) after 160 min extraction time. The phenomenon could be explained by Fick's second law of diffusion, revealing that final equilibrium will be attained between the solution concentrations in the solid matrix and solvent after a particular duration.33
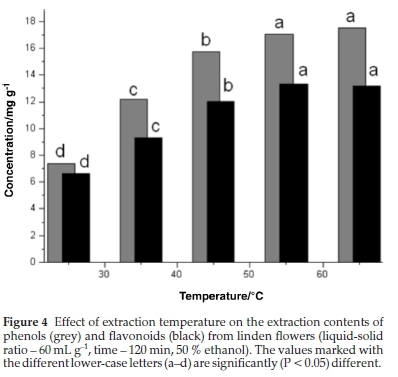
3.4. Effect of Extraction Temperature
The effect of extraction temperature was studied with 50 % ethanol and liquid-solid ratio 60 (mL g-1) over 120 min as extraction conditions. The impact of extraction temperature on the TP and TF were investigated in the range from 25 to 65 °C. As shown in Fig.4, extraction temperature demonstrated a significant (P < 0.05) effect on both phenolic contents and flavonoid contents. The increment of TP and TF as a function of temperature was in agreement with previous studies that reported that the yield of phenolic compounds would increase with increasing extraction temperature.32,34 Heat could enhance the recovery of phenolic compounds from plant materials by increasing the diffusivity and the solubility of phenolic compounds in the extraction solvent.35-36 With the increase of extraction temperature from 25 to 45 °C, TP and TF's extraction yield quickly increased from 8.36 to 15.77 mg GAE g-1 d.w. (88.6 %) and from 6.65 to 12.05 mg CE g-1d.w. (81.2 %), respectively. However, with the increase of extraction temperature from 45 to 65 °C, the extraction yield showed a little increase from 15.77 to 17.82 mg GAE g-1 d.w. (13.0 %) and 12.05 to 13.20 mg CE g-1 d.w. (9.5 %), respectively.
3.5. Composition of Linden Flowers Extract (qo)
Results for TP TF, DPPH and ABTS for linden extract indicated that the extract possessed a high content of TP (17.011 mg GAE g-1) and TF (12.562 mg CE g-1), and high antioxidant activity (ABTS: 1.62 mmol TE g-1; DPPH: 1.05 mmol TE g-1). HPLC-DAD analysis was performed, to establish the polyphenolic profile of obtained extract. Three phenolic acids were indentified and quantified in the ethanol extract of linden flower: chlorogenic acid (0.214 mg g-1), p-coumaric acid (0.129 mg g-1) and ferulic acid (0.971 mg g-1). Six flavonol were identified, myricetin-glyco-side (0.849 mg g-1), rutin (0.324 mgg-1), hyperosid (0.843 mgg-1), isoquercetin (0.052 mg g-1), quercetin (1.713 mg g-1) and kaempferol (0.118 mg g-1). Results showed that dominant compounds in the linden extract were ferulic acid and quercetin.
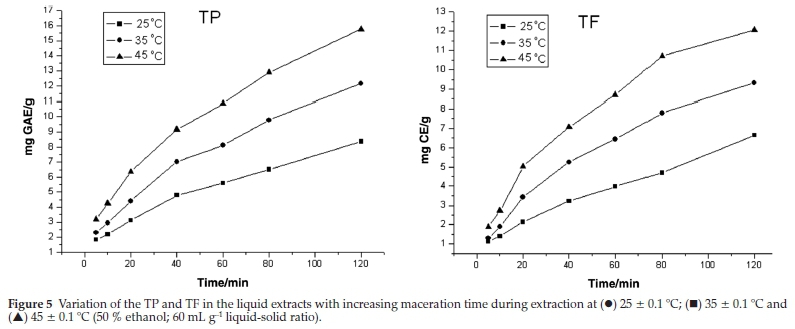
3.6. Kinetics of Total Polyphenols and Flavonoid Extraction
The change of TP and TF in the liquid extracts with the progress of extraction is presented in Fig. 5.
Curves are of the same shape as those of classical extraction from plant materials. Two periods of extraction can easily be observed in both TP and TF:
• Washing, characterized by a rapid increase in the concentration in the early beginning of the process (the rapid extraction process at the beginning was due to free phenolic compounds on the surface of the milled linden flowers that was exposed to fresh solvent), and
• slow extraction (after the first 40 min), characterized by a slow increase in the concentration with the progress of extraction. The knowledge on the mechanism and the kinetics of phenolic compounds extraction are generally needed for optimizing the operating conditions and designing the extraction process.37
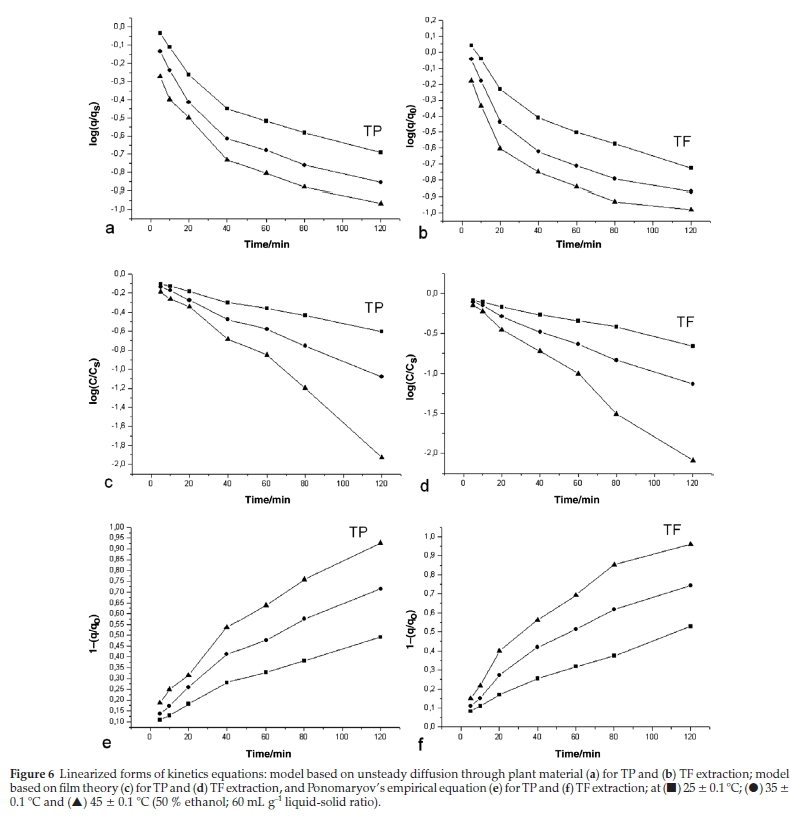
Based on the two-step mechanism, we modelled the kinetics of the TP and TF from linden flowers by the Ponomaryov equation, film theory and the unsteady-state diffusion through the plant material, the kinetic equations and their linearized form are presented in Table 1.
Figure 6 illustrates the linearized form of the corresponding basic kinetic equations given in Table 2. As can be seen, two equations fit the experimental data quite well in the second part of the extraction. The kinetic parameter for model based on the unsteady diffusion through plant material, model based on the film theory and empirical model of Ponomaryov were obtained by plotting log q/qo, ln(1 - c/cS), and 1 - q/qo, versus t, respectively.
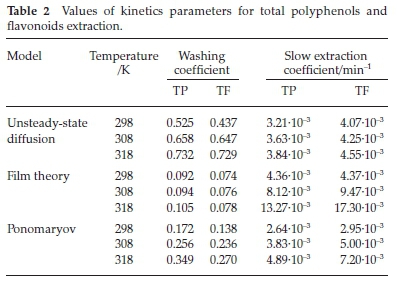
The equations are two-parametric, where one parameter (b, b' and b") represents the washing (so-called washing coefficient) and the second one (k, k' and k") represents the slow extraction (so-called slow extraction coefficient). Parameters of the kinetic models: the washing and the slow extraction coefficient were calculated from the experimental data by means of the linear regression method using the proper linearized form of the kinetics equations. Their values are presented in Table 2.
The model based on film theory predicts the smallest values of washing coefficient and the highest values of the slow extraction coefficient. For the three models, it was observed that, their kinetic parameters increased with increase in temperature, which amply explains the reason behind the increase in the TP and TF yield as temperature increase.
3.7. Comparison of the Kinetic Models
The criteria used to evaluate how well models represents the experimental data and to select the best one was the magnitudes of the linear coefficient of determination (R2), root mean square (RMS) and standard deviation (S.D.). Table 3 summarizes the R2, RMS and S.D. percentage values for each model at different temperatures. Table 3 shows that the average RMS individual values were less than ±8 % for each of the three models considered. The same is true for the average S.D. individual values. Thus, based on their low RMS and S.D., each of the models examined reasonably described the kinetics of TP and TF extraction from linden flowers. These findings were in line with the results obtained by Kitanovic et al.18for the resinoid extraction from aerial parts of Hyperium perforatum L., and the results obtained by Menkiti et al.20for the oil extraction from Terminalia catappa L.
Also, it was observed that the RMS decreased, and the linear correlation coefficient increased in the following order;
Film theory -> Empirical equation of Ponomaryov -> Unsteady diffusion through plant material.
Based on these results, the model based on the unsteady diffusion through plant material, having the lowest values of RMS and SD, and the highest values of the linear correlation coefficients, was selected as the best model for the TP and TF extraction kinetics from linden flowers.
3.8. Thermodynamic Analysis
The temperature extraction coefficient (γ was calculated based on a linear regression of lnyT and T/10 using Equation 11, the activation energy (Ea) was calculated based on a linear regression of lnK and 1/T using Equation 6, the Gibbs free energy change ΔG°) was determined using Equation 7, and the enthalpy change (ΔΗ°) and entropy change ΔSo) were calculated based on a linear regression of lnK and 1/T using Equation 10. The calculated values of y,Ea,K, ΔG°, ΔΗ° and ASo are shown in Table 4.
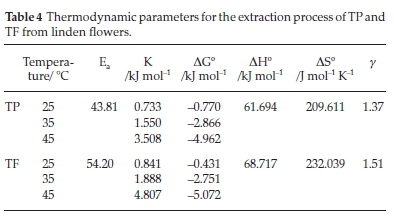
The TP and TF yields increased by a factor 1.37 and 1.51 for every 10 °C rise in temperature. Values of the temperature coefficient are higher compared to previously published ones for the hempseed oil extraction from hemp (Cannabis sativa L.) (1.012-1.025)18 and the oil extraction from the olive cake (1.02-1.14).38
Calculated activation energies for the extraction process with 50 % ethanol were 43.81 kJ mol-1 for TP and 54.20 kJ mol-1 for TF, respectively. These results indicated that the extraction rate was more sensitive to temperature in case of extraction of TF. By contrast, the extraction rate was less sensitive to temperature in case of extraction of TP. Values obtained for activation energies were comparable to these for temperature extraction coefficients. Similar results were observed for the extraction process of polyphenols with different solvents. For the extraction of polyphenols from grape seeds with 50 % aqueous ethanol the value for activation energy was 1.10-7.70 kJ mol-1.39 For the polyphenols from grape seeds extracted with 60 % methanol acidified with HCl the value obtained was 23 kJ mol-1.40 Determined activation energies for total polyphenols extraction with deionized water were 50.301 kJ mol-1 for dandelion, 51.316 kJ mol-1 for marigold, 56.958 kJ mol-1 for yarrow and 69.901 kJ mol-1 for chamomile.41
The equilibrium constant (K) increased with increase in the temperature, indicating that the equilibrium concentration of phenolic compounds in extracts was also increasing. The positive enthalpy change indicated that the extraction process was endothermic and required external energy source during the extraction.42 The enthalpy in this study, was comparatively higher than those of total phenolics from hop studied by Paunovic et al.,43 total polyphenols from barley by Paunovic et al.,44 and flavonoids from Phyllanthus emblica by Krishnan and Rajan,45 which were in the range (2.36-12.25 kJ mol-1). This higher enthalpy could be attributed to the morphology of the plant materials influencing polyphenols extraction.20 The positive entropy values for the extraction of TP and TF from linen flowers using 50 % ethanol were 209.611 and 232.039 J mol-1 K-1. The entropy of the mixture increases due to the polyphenol molecules extraction.42 The positive values of the entropy change for the entire process was an indication that the process was irreversible, thus in line with the findings of Aman et al.,46Sulaiman et al. and 42 Menkiti et al.20The free energy values for the extraction of TP and TF were negative. This negative value was an indication that the process was feasible and spontaneous. The spontaneity of the TP and TF extraction from lined flowers were favoured with increasing extraction temperature. The Gibbs free energy change for the TP and TF extraction from linden flowers is similar to flavonoids from Phyllanthus emblica,43hempseed oil by Kostic et al.21and coconut oil by Sulaiman et al.,42 which were in the range (-0.48 to -5.17 kJ mol-1) and lower than those for the total phenols extraction from hop.43
4. Conclusions
This study suggested that process parameters, such as concentration of extraction solvent, liquid-solid ratio, temperature and time extraction, influenced the content of TP and TF. The three kinetic models studied: Ponomaryov equation, film theory and the unsteady-state diffusion through the plant material all reasonably described TP and TF extraction from linden flowers as indicated by high R2, low RMS and S.D. values. The model based on the unsteady-state diffusion through the plant material gave the best fit, followed by Ponomatyov's model, and then the film theory model. The AG°, AH° and AS° and values obtained for the TP and TF extraction indicated that the extraction process was spontaneous, irreversible, and endothermic, respectively.
Acknowledgements
Research in this paper is part of the project no. 451-03-68/ 2020-14/200124 financed by the Ministry of Education, Science and Technological Development of the Republic of Serbia.
ORCID iDs
Μ. Mitic: orcid.org/0000-0002-1310-0540
S.Jankovic: orcid.org/0000-0003-3804-3682
S. Mitic: orcid.org/0000-0003-3301-5981
G.Kocic: orcid.org/0000-0003-2386-2466
P. Maskovic: orcid.org/0000-0001-9049-6932
References
1 P. Maskovic,V. Velickovic,S. Durocic, M. Radojkovic, A. Cvetanovic, J. Svarc-Gajic, M. Mitic and J. Vulic, Biological activity and chemical profile of Lavatera thuringiaca L. extracts obtained by different extraction approaches, Phytomedicine, 2018, 38, 118-124. [ Links ]
2 K. Radoglou, D. Dobrowolska, G. Spyroglou and V. Nicolescu, A review on the ecology and silviculture of limes (Tilia cordata Mill., Moench.) in Europe, Die Bodenkultur, 2009, 60(9), 9-19. [ Links ]
3 M. Blumenthal, A. Goldberg and S. Foster, Herbal Medicine - Expanded Commission E Monographs, American Botanical Council, Integrative Medicine Communications, Boston, MA, 2000, pp. 240-243. [ Links ]
4 M.K. Al-Essa, E.I. Mohammed, A. Yanal, Y.A. Shafagoj, U. Fatma and F.U. Afifi, Studies on the direct effects of the alcohol extract of Tilia cordata on dispersed intestinal smooth muscle cells of guinea pig, Pharm. Biol., 2007,45 (3), 246-250. [ Links ]
5 C. Jaenicke, J. Gruenwald and T. Brendler, Handbuch Phyto-therapie Stuttgart Wissenschaftliche Verlagsgesellschaft mbH, 2003, p. 329. [ Links ]
6 A. Behrens, N. Maie, H. Knicker and I. Koegel-Knaber, MALDI-TOF mass spectrometry and PSD fragmentation as means for the analysis of condensed tannin in plant leaves and needles, Phytochemistry, 2003, 62, 1159-1170. [ Links ]
7 E. Akyuz, H. §ahin, F. Islamoglu, S. Kolayli and P. Sandra, Evaluation of phenolic compounds in Tilia rubra subsp. Caucasica by HPLC-UV and HPLC-UV-MS/MS, int. J. Food Prop., 2014,17(2), 331-343. [ Links ]
8 M. Vidovic, F. Morina, S. Milic and S. Veljovic-Jovanovic,An improved HPLC-DAD method for simultaneously measuring phenolics in the leaves of Tilia platyphyllos and Ailanthus altissima, Bot. Serb., 2015, 39(2), 177-186. [ Links ]
9 G. Toker, M. Aslan, E. Ye§ilada, M. Memi§oglu and S. Ito, Comparative evaluation of the flavonoid content in officinal Tiliae flos and Turkish lime species for quality assessment, J. Pharmaceut. Biomed., 2001,26(1), 111-121. [ Links ]
10 Y.Y. Thoo, S.K. Ho, J.Y. Liang, C.W. Ho and C.P. Tan, Effect of binary solvent extraction system, extraction time and extraction temperature on phenolic antioxidants and antioxidant capacity from mengkudu (Morinda citrifolia), Food Chem, 2010,120, 290-295. [ Links ]
11 S.I. Mussatto, L.F. Ballesteros, S. Martins and J.A. Teixeira, Extraction of antioxidant phenolic compounds from spent coffee grounds, Sep. Purif. Technol., 2011, 83, 173-179. [ Links ]
12 S. Franquin-Trinquier, C. Maury, A. Baron, L.D. Meurlay and E. Mehinagic, Optimisation of the extraction of apple monomeric phenolics based on response surface methodology: comparaison of pressurised liquid-solid extraction and manual-liquid extraction, J. Food Compost. Anal., 2014, 34, 56-67. [ Links ]
13 V.L. Singleton and J. Rossi, Colorimetry of total phenolics with phosphomolybdic-phosphotungstic acid reagent, Am. J. Enol. Viti-cult, 1965,16, 144-158. [ Links ]
14 C.C. Chang, M.H. Yang, H.M. Wen andJ.C. Chern, Estimation of total flavonoid content in propolis by two complementary colorimetric methods, J. Food Drug. Anal., 2002,10, 178-182. [ Links ]
15 Y. Gong, X. Lui, H. Wen-Hao, X. Hong-Gao, F. Yuan and Y.X. Gao, Investigation into the antioxidant activity and chemical composition of alcoholic extracts from defatted marigold (Tageleserecla L.) residue, Filolerapia, 2012, 83, 481-489. [ Links ]
16 M. Alothman, R. Bhat and A.A. Karim, Antioxidant capacity and phenolic content of selected tropical fruits from Malaysia, extracted with different solvents, Food Chem, 2009,115, 785-788. [ Links ]
17 M.N. Mitic, I.M. Souquet, M.V Obradovic and S.S. Mitic, Phyto-chemical profiles and antioxidant activities of Serbian table and wine grapes, Food Sci. Biotechnol., 2012, 21(6), 1619-1626. [ Links ]
18 S. Kitanovic, D. Milenovic and V.B. Veljkovic, Empirical kinetic models for the resinoid extraction from aerial parts of St. John's wort (Hypericum perforatum L.), Biochem. Eng. J., 2008, 41, 1-11. [ Links ]
19 B. Rahmanian, M. Pakizeh, S.A.A. Mansoori and R. Abedini, Application of experimental design approach and artificial neural network (ANN) for the determination of potential micellar-enhanced ultrafiltration process, J. Hazard. Mater., 2011,187, 67-74. [ Links ]
20 M.C. Menkiti, C.M. Agu and T.K. Udeigwe, Extraction of oil from Terminalia catappa L: process parameter impacts, kinetics, and thermodynamics, Ind. Crops Prod., 2015, 77, 713-723. [ Links ]
21 M.D. Kostic, N.M. Jokovic, O.S. Stamenkovic, K.M. Rajkovic, P.S. Milic and VB. Veljkovic, The kinetics and thermodynamics of hempseed oil extraction by n-hexane, Ind. Crops Prod., 2014, 52, 679-686. [ Links ]
22 A.K. Bucic, M. Planinic, S. Tomas, M. Bilic and D. Velic, Study of solid-liquid extraction kinetics of total polyphenols from grape seeds, J. Food Eng., 2007, 81(1), 236-242. [ Links ]
23 M.S.R. Alonso, E. Korta, A. Barranco and A.L. Berrueta, Pressurized liquid extraction for the determination of polyphenols in apple, J. Cromatogr. A, 2001, 933, 37-43. [ Links ]
24 B. Sultana, F. Anwar and M. Ashraf, Effect of extraction solvent/technique on the antioxidant activity of selected medicinal plant extracts, Molecules, 2009,14, 2167-2180. [ Links ]
25 G. Spigno, L. Tramelli and D.M. De Faveri, Effects of extraction time, temperature and solvent on concentration and antioxidant activity of grape marc phenolics, J. Food Eng., 2007, 81(1), 200-208. [ Links ]
26 Z. Wissam, A.A. Nour, J. Bushra, N. Zein and D. Saleh, Extracting and studying the antioxidant capacity of polyphenols in dry linden leaves (Tilia cordata), J. Pharmacogn. Phytochem., 2017, 6(3), 258-262. [ Links ]
27 M. Radojkovic, Z. Zekovic, S. Jokic and S. Vidovic, Determination of optimal extraction parameters of mulberry leaves using response surface methodology (RMS), Rom. B otechnol. Lett., 2012, 17, 7295-7308. [ Links ]
28 S. Jokic,D.Velic, M. Belic, A. Bucic-Kojic, M. Planinic and S. Tomas, Modelling of the process of solid-liquid extraction of total polyphenols from soybeans, Cyech. J. Food Sc ., 2010, 28, 206-212. [ Links ]
29 M.A. Rostango, M. Palma and C.G. Barroso, Pressurisedliquid extraction of isoflavones from soybeans, Anal. Ch m. Acta, 2004, 522, 169-177. [ Links ]
30 V.D. Ponomaryov, Med c nal Herb Extract on, Medicina, Moscow, Russia, 1976. [ Links ]
31 R. Chirinos, H. Rogez, D. Campos, R. Pedreschi and Y. Larondelle, Optimisation of extraction conditions of antioxidant phenolic compounds from mashua (Tropaeolum tuberosum Ruíz & Pavón ) tubes, Sep. Purif. Technol., 2007, 55, 217-225. [ Links ]
32 K.K. Chew, S.Y. Ng, Y.Y. Thoo, M.Z. Khoo, W.M. Wan Aida and C.W Ho, Effect of ethanol concentration, extraction time and extraction temperature on the recovery of phenolic compounds and antioxi-dant capacity of Centella asiatica extracts, Int. Food Res. J., 2011, 18, 571-578. [ Links ]
33 M. Pinelo, J. Sineiro and M.J. Nunez, Mass transfer during continuous solid-liquid extraction of antioxidants from grape byproducts, J. Food Eng., 2006, 77(1), 57-63. [ Links ]
34 F. Gironi and V. Piemonte, Temperature and solvent effects on polyphenol extraction process from chestnut tree wood, Chem. Eng. Res. Des., 2011, 89, 857-862. [ Links ]
35 W. Vongsangnak, J. Gua, S. Chauvatcharin and J.J. Zhong, Towards efficient extraction on notoginsengsaponins from cultured cells of panaxnotoginseng, Biochem. Eng. J., 2004,18(2), 115-120. [ Links ]
36 S.J. Kim, H.N. Murthy, E.J. Hahn, H.L. Lee and K.Y. Paek, Parameters affecting the extraction of ginsenosides from the adventitious roots of ginseng (Panax ginseng C.A. Meyer), Sep. Purif. Technol., 2007, 56(3), 401-406. [ Links ]
37 E. Akyuz, H. §ahin, F. Islamoglu, S. Kolayli and P. Sandra, Evaluation of phenolic compoundsin Tilia rubra subsp. Caucasica by HPLC-UVand HPLC-UV-MS/MS, Int. J. Food Prop., 2014,17(2), 331-343. [ Links ]
38 M. Vidovic, F. Morina, S. Milic and S. Veljovic-Jovanovic,An improved HPLC-DAD method for simultaneously measuring phenolics in the leaves of Tilia platyphyttos and Ailanthus aHissima, Bot. Serb., 2015, 39(2), 177-186. [ Links ]
39 G. Toker, M. Aslan, E. Ye§lada, M. Memi§oglu and S. Ito, Comparative evaluation of the flavonoid content in officinal Tiliae flos and Turkish lime species for quality assessment, J. Pharmaceut. Biomed., 2001,26(1), 111-121. [ Links ]
40 D.T. Velickovic, D.M. Milenovic, M.S. Ristic and VB. Veljkovic, Ultrasonic extraction of waste solid residues from the Salvia sp. essential oil hydrodistillation, Biochem. Eng. J., 2008, 42, 97-104. [ Links ]
41 S. Meziane and H. Kadi, Kinetics and thermodynamics of oil extraction from olive cake, J. Am. Oil Chem. Soc., 2008, 85, 391-396. [ Links ]
42 A. Bucic-Kojic, M. Planinic, S. Tomas, M. Bilic and D. Velic, Study of solid-liquid extraction of total polyphenols from grape seeds, J. Food Eng., 2007, 81, 236-242. [ Links ]
43 V. Sant'Anna, A. Brandelli, L.D.F. Marczak and I.C. Tessaro, Kinetic modeling of total polyphenol extraction from grape marc and characterisation of the extracts, Sep. Purif. Technol., 2012,100, 82-87. [ Links ]
44 A.J. Tusek, M. Benkovic,A.Belscak Cvitanovic, D. Valinger, T. Jurina and J.G. Kljusuric, Kinetics and thermodynamics of the solid-liquid extraction process of total polyphenols, antioxidants and extraction yield from Asteraceae plants, Ind. Crops Prod., 2016, 91, 205-214. [ Links ]
45 S. Sulaiman, A.R. Abdul Aziz and M.K. Arova, Optimisation and modeling of extraction of solid coconut waste oil, J. Food Eng., 2013, 114, 228-234. [ Links ]
46 D. Paunovic, S.S. Mitic, G.S. Stojanovic, M.N. Mitic, B.T. Stojanovic and M.B. Stojkovic, Kinetics of the solid-liquid extraction process of phenolic antioxidants and antioxidant capacity from hop (Humulus lupulus L.), Sep. Sci. Technol, 2015, 50, 1-7. [ Links ]
47 D. Paunovic, S.S. Mitic, D.A. Kostic, M.N. Mitic, B.T. Stojanovic and J.Lj. Pavlovic, Kinetics and thermodynamics of the solid-liquid extraction process of total polyphenols from barley, Adv. Tech., 2014, 3(2), 58-63. [ Links ]
48 R.Y. Krishan and K.S. Rajan, Influence of microwave irradiation on kinetics and thermodynamics of extraction of flavonoids from Phyllanthus emblica, Braz. J. Chem. Eng., 2017, 34, 885-899. [ Links ]
49 S. Amin, G. Hawash and S. El Diwani, Kinetics and thermodynamics of oil extraction from Jatropha curcas in aqueous acidic hexane solutions, J. Am. Sci., 2010, 6(11), 8. [ Links ]
Received 8 May 2020
Revised 30 September 2020
Accepted 16 October 2020
* To whom correspondence should be addressed. E-mail: sonjajankovic1991@gmail.com

