


Services on Demand
Article
 English (pdf)
 Article in xml format
 Article references
Indicators

Related links
-
 Cited by Google
 -
 Similars in Google
Share

 Permalink
South African Journal of Chemistry
On-line version ISSN 1996-840X
Print version ISSN 0379-4350
S.Afr.j.chem. (Online) vol.73 Durban 2020
http://dx.doi.org/10.17159/0379-4350/2020/v73a14
RESEARCH ARTICLE
Optimization of X-ray Fluorescence Calibration through the Introduction of Synthetic Standards for the Determination of Mineral Sands Oxides
Cramwell BadlaI, II; Francois WewersII
ISafety, Health, Environment and Quality (SHEQ) Department, Tronox Namakwa Sands, Koekenaap, South Africa
IIDepartment of Chemistry, Faculty of Applied Sciences, Cape Peninsula University of Technology, Bellville, South Africa
ABSTRACT
An XRF spectrometer traditionally requires its methods to be calibrated using certified reference materials (CRMs). This means choosing from a limited selection of CRMs, which are costly and not widely available. This article examines the application of synthetic oxide standards made from commercially available high purity compounds for the calibration of an XRF spectrometer. Enabling itto analyze for major, minor and trace elements (Mg, Al, Si, PP Hf, Ca, Ti, Zr, Fe, Th, U) in heavy mineral sands processing. Calibration standards were synthesized by mixing pure compounds and mineral sands reference materials, to mimic matrices similar to that of the routine samples and cover the required analytical range. The aliquots were mixed in % fractions and fused with a 1:9 sample/borate dilution to make glass beads. The optimized calibration was validated as per SANAS TR 26-02 criteria for linearity, working range, limit of detection (LOD) and quantification (LOQ), precision and accuracy. The correlation coefficients (r2) of the resulting calibration curves were >0.999, showing excellent linearity. The working range for all the calibration lines was satisfactory. The LOD and LOQ values for all the lines were low enough to prevent extrapolation below the lowest calibration point. The precision of the calibration was sufficiently high, and the accuracy was of adequate quality with z(MAD) <2. These observations support the successful synthesis and use of a well-selected set of synthetic standards. Additionally, it has been successfully utilized to analyze a variety of heavy mineral sands samples.
Keywords: Mineral sand, XRF, CRMs, synthetic standards, calibration, validation.
1. Introduction
There is a continually increasing need for quick and accurate analysis of oxides across a wide concentration range in mineral sands processing operations. Such need is necessary to further improve heavy mineral yields and recoveries. With large-scale mineral concentrating operations, 'trustworthy' analysis will play a major part in the future development of automatic control systems for optimization of the electrostatic and wet gravity separations.1 The aim of mineral processing is therefore to separate the valuable minerals from the gangue in order to produce enriched Zircon (ZrO2.SiO2), Rutile (TiO2) and Ilmenite (FeO.TiO2) concentrates.
Zircon is mainly used as an opacifier in the ceramic industry, foundry sands, abrasive and for production of ZrO2 and Zr metal. Rutile is used in the manufacture of welding rods and paint pigment and is processed into titanium metal for use in aircraft parts amongst others. Ilmenite is smelted using direct current (DC) open arc furnaces to produce titanium slag (TiO2) and several grades of pig-iron (FeO). Titanium slag is used in the manufacture of paint pigment, while pig-iron is used in the foundry industry, for casting of automotive and engineering components and for various other applications.1
Mineral sands processing plants undergo many separation stages and recycling paths to separate the feed into its constituent mineral species, thus leading to wide analysis ranges and requiring analysis of trace elements. X-ray fluorescence spectrometry (XRF) has been proven successful in the analysis of elements (as oxides) from Ilmenite, Rutile and Zircon minerals.1 It delivers very rapid, precise and accurate analysis of minerals and ores across a broad range of elements (Be-U) and concentrations ranging from trace amounts to one hundred per cent (wt. %).2The most common elements found in mineral sands are Al, Ca, Ce, Cr, Fe, Hf, Mg, Mn, Nb, P, Si,Sn, Th, Ti, U,VandZr.
A wavelength dispersive XRF-spectrometer consists of the X-ray tube (generates primary X-rays to excite secondary characteristic X-rays from atoms in the sample), collimators (to direct a parallel beam of X-rays from the sample to the analyzing crystal), the analyzing crystal (to disperse the X-rays from the sample into individual wavelengths) and the detector which measures photon energy from the sample and converts it into electrical signals.
Potts2 indicated that the tube anode is chosen based on whether it will provide the most efficient excitation of the elements to be analyzed. The Rhodium (Rh) tube has been found to be the best multipurpose tube for exciting elements from Fluorine to Uranium.2 It has a maximum voltage setting of 60 to 70 kV and operating power of up to 4000 W (kV x mA). The tube is fitted with a 30 to 150 μm thick beryllium window. The beryllium is selected as window material since it is the lowest-atomic-number material that is available as a foil with appropriate mechanical properties to form a vacuum-tight seal and it allows good transmission of both the K- and, especially, L-lines to be used for exciting the sample.2
Sieber3 stated that an XRF method requires calibration with certified reference materials (CRMs). This means choosing from a limited selection of CRMs, which are costly and not widely available.3 Due to the scarcity of commercial mineral sands calibration standards, various international mineral sands industries have opted to synthesize calibration standards. Introduction of synthetic standards made up from pure compounds for XRF method calibrations have been studied and yielded accurate results. These studies were done using high purity, stoichiometric and stable compounds, using the standard addition method.3,4 XRF traditionally suffers from significant matrix effects, which can make calibration challenging. Calibration methods for XRF include the use of matrix matched standards, adding an internal standard to the sample matrix, dilution to reduce matrix effects, and fusion of standards and samples with a suitable flux.3
There are various preparation techniques, which are well suited for making synthetic standards from pure compounds. One involves standard addition, where certified material or a pure chemical compound is added to a sample to form a mixture. This technique was used by Yamasaki,4 where large batches of reference materials and pure compounds were homogenized using blending operations (i.e. ball-mill, mortar and pestle, etc.). This aids the preparation of standards closely matched to the matrix of the test samples. Chiweshe el al.5successfully trialled the method in preparation of precious metal calibration standards. However, any error in the preparation of the stock will propagate through the other standards leading to a bias in the calibration.5
The use of the standard addition method has been reported as one of the preferred methods to reduce matrix effects. It is cost effective, accurate and precise compared to the direct calibration.6 The application of the standard addition method for mineral sands determination is not very common due to the complexity of mineral sand composition. An Australian Standard, however, reported the use of the standard addition method using only pure compounds (no matrix matching). The Standard proved that this method is very sensitive to unmatched matrices, especially in the presence of titanium as the major element, since it suffers matrix effect challenges.7
Bouchard el al.8reported that precise and accurate results can be achieved when synthetic standards are prepared by blending reference materials with pure compounds using a lithium borate fusion method. Staats9 discovered that the planning stage is crucial to ensure all required analyte elements are included as it is a challenging task to add additional analyte elements later.
The second method used by Mashima10 and Mori and Mashima11 is the standard dilution, where the standard stocks are combined in known and varying amounts of the analyte to build the calibration curve. This method is veryaccurate because it allows direct quantitation of original analytes and simultaneously corrects for matrix effects. The disadvantages of this method are that it requires a large number of samples and is very time-consuming and labour intensive. The diluent must have a similar matrix composition to the sample and standard. Thorough mixing is considered very important and may be difficult to achieve with some types of materials.
The studies of Sieber3 and Giles el al12in this field exemplified that the methods require an inventory of high purity compounds. Furthermore, all the compounds must be dried or roasted prior to use. This is done at the temperature specified on the product certificate to ensure the compound has the correct stoichiometry. Mashima and Mori10 cautioned that failure to pre-treat compounds can result in weighing errors during the standard addition as some compounds are hygroscopic.
Weighing pure compounds increases the chance of weighing errors, but it allows customization of calibration ranges to cover the required needs.12 In this research both the standard addition and standard dilution techniques were employed as they have gained wide acceptance as the best synthetic methods for multiroutine samples. The fabrications allow calibration standards to cover the complete concentration range for each element to be determined, to prevent extrapolation during quantitative analysis which may cause erroneous results.
Depending upon the application and the required precision and accuracy, laboratories use either pressed powder and/or borate fusion methods. Pressed pellets are subject to particle size and mineralogical effects, which can give poor quality calibra-tions.2 Willis13 reported that borate fusion eliminates the mineralogy effects since the sample is dissolved, and the mineralogy is destroyed and thus eliminates the particle size effect. An additional advantage of fusion is the reduction of inter-element effects due to the dilution of the samples. The quality of the analysis is dependent on the sample specimen homogeneity, which in turn is dependent on the fusion process.13
Matrix correction is essential for XRF analysis. Kusano el al.14 reported that the matrix effect can be reduced to some extent by dilution, but they are not completely removed at the degree of six times dilution. Factors to be considered for the fusion technique were identified and discussed by Willis.13 These factors include the sample type, particle size, flux, sample to flux ratio, fusion temperature as well as fusion time.13
Claisse and Samson15 suggested the use of a lithium borate combination, as it is more efficient than pure tetraborate or metaborate for most oxides. It has a lower melting point, therefore leads to lower viscosity, produces a more stable fusion bead and decreases the possibility of residual sample in the crucibles and moulds. Norrish and Hutton16 advocated Claisse and Samson's15 suggestions and proposed the so-called 12:22 flux, that contains 12 parts lithium tetraborate and 22 parts lithium metaborate. Bennett and Oliver17 expanded the studies and established a mixture of 1 part lithium tetraborate and 4 parts lithium metaborate as the composition is close to the eutectic, thus making the preparation of glass beads easier.
A more recent study by Claisse18 reported that a 50 % lithium tetraborate:50 % lithium metaborate composition is the most universal flux. It is widely used due to its optimized performance for all acidic oxides. Borate fusions were found to be advantageous for the preparation of synthetic standards. Pure oxides can be mixed in any desired combinations and proportions to make standards that contain all and only desired elements.18 The glass specimens were made by mixing various quantities of pure oxides with 50 % lithium tetraborate:50 % lithium metaborate mixtures and fused. All the tested oxides yielded good glass beads.
Prichard and Barwick19 reported that the validation of the method for the analysis of oxides is to determine if the method is fit for its intended purpose of analysis. When a new analytical method is developed, it is done to minimize the possibility of errors that may lead to inaccurate results. The primary aim of validating an analytical method is therefore to ensure and provide the evidence to prove that the chosen analytical method can yield correct and trustworthy results in conformity with standards and specifications established by the test laboratory.19 In the process of validating the method, various statistical methods are used to validate relevant parameters to prove the reliability and efficiency of the test method. The analytical parameters validated include the following:
• Linearity
• Determination of limit of detection (LOD) and limit of quantification (LOQ)
• Analytical working range
• Precision of results
• Accuracy
Linearity is the ability of a method to obtain test results proportional to the concentration of the analyte within a given working range. Linearity of the calibration curve is usually expressed through the coefficient of correlation, r2. A correlation coefficient close to unity (r2 = 1) is considered by some authors sufficient evidence to conclude that the calibration curve is linear.20
Limit of Detection (LOD) represents the lowest amount of an analyte in a sample that can be detected by an analytical method. It is the signal that is greater than the statistical fluctuation of the background noise.2,20 It can also be defined as the smallest measure that can be confidently analyzed (based on 3s error limits). LOD only becomes important for very low concentrations, mostly ppm's. Potts2 wrote that the LOD was not considered satisfactory for quantitative analysis and for this reason limit of quantification (LOQ) was invented. This is to ensure additional confidence is designed to estimate the limit of quantitative analysis.
Limit of Quantification (LOQ) refers to the lowest concentration of analyte that can be determined with acceptable precision and accuracy. The analyte signal at the LOQ level should be at least 10 times the signal of the blank sample and the accuracyand precision within 20 % of the nominal concentrations.2,20
Analytical working range of an analytical method is the interval over which acceptable accuracy and precision can be expected and stretches from LOQ to the highest calibration standard of the analyte. The analytical working range is normally expressed in the same units as the test results obtained by the analytical method.20
Precision is defined as the spread or variation between results for the multiple analysis of one homogeneous sample. It is usually expressed as the standard deviation or relative standard deviation (coefficient of variance) and may be a measure of either the degree of reproducibility and/or repeatability.2,20
Accuracy of an analytical method is the extent to which test results generated by the method and the true value agree. To estimate the accuracy of a method, the analyte is measured in comparison with a reference material. If reference materials are not available, accuracy can be assessed by analyzing a test portion of the sample before and after adding a known mass of analyte to it, a process known as spiking.2,20
The current work describes techniques of XRF calibrations through the introduction of matrix-matched synthetic standards for precise and accurate analysis of oxides. These standards were made from commercially available high purity compounds to calibrate a method for 11 oxides, namely, ZrO2, SiO2, HfO2,Fe2O3,TiO2,Al2O3, CaO, MgO, P2O5,U3O5 and ThO2. The aim is for the calibration to enable a quick and effective analysis of elements across a wide range of concentrations in different types of heavy mineral sands streams, giving accurate and trustworthy results.
2. Experimental
2.1. Preparation of Synthetic Stock Standards
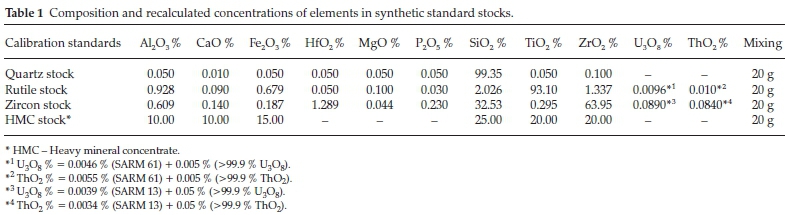
Prior to mixing, directions on the certificates for pre-treatment were carefully followed, as certified values on the certificate are based on the specified pre-treatment, i.e. drying or roasting before use.10 Thus, compounds were dried in an oven at 105 °C and some roasted in a muffle furnace at 1000 °C. All were stored in a desiccator after cooling as some are hygroscopic. The composition of the calibration standard must approximate that of the matrix of the routine samples.3 Therefore, three mineral sands reference materials (quartz SARM49, Rutile SARM61 and Zircon SARM13) provided by the South African Reference Materials (SARM) were used to make standard stocks.
A 5-figure Mettler Toledo analytical balance M104TS was used to weigh the compounds. Accurate weighing is one of the most important factors of the XRF calibration. Synthetic standard samples were prepared following the procedures used by Yamaki & Bertoli el al.6,21 For the standard with low concentrations of MgO, P2O5, ZrO2, HfO2 and TiO2,0.01g of P2O5,TiO2, HfO2, 0.02 g of ZrO2 and 0.05 g of Mg (>99.9 %, Alfa Aesar Puratronic) were added to 19.950 g of quartz SARM49 to make Quartz stock. For the standard with low concentrations of HfO2, U3O8, ThO2 and MgO, 0.001 g of U3O8 and ThO2,0.01 g of HfO2 and 0.02 g of MgO (>99.9 %, Alfa Aesar Puratronic) were added to 19.968 g of Rutile SARM61 to make Rutile stock. For the standard with high concentrations of U3O8 and ThO2,0.01gof U3O8 and ThO2 were added to 19.980 g of Zircon SARM13 to make Zircon stock.
As SiO2,TiO2 and ZrO2 are three major oxides typically found in mineral sands, the concentration ranges of the calibration standards needed to be extended widely for an accurate quantification of these elements. Therefore, heavy mineral sand matrix standard (HMC stock) with high concentrations of Al2O3, CaO, Fe2O3, SiO2,TiO2 and ZrO2 was prepared using the addition of 2g of Al2O3 and CaO, 4 g of TiO2 and ZrO2,3g of Fe2O3 and 5 g of SiO2 (>99.9 %, Alfa Aesar Puratronic).
The compounds were weighed to make their total weight to exactly 20 g and were well homogenized for 1 h using a mortar and pestle. The duration for homogenization is longer compared to [15 s] of Mashima and Mori10 but shorter than [2 h] used by Mashima.11 This is due to blending of CRMs with compounds, thus less reagents in the aliquots. Bulk compositions of the synthetic standards were recalculated using actual weight measurements. The concentration of each oxide was calculated by dividing the weighed mass of oxide with the standard stock total mass and multiplied by a hundred to get the percentage of the oxide present. Compositions of synthetic standard stocks are shown in Table 1.
2.2. Preparation of Calibration Standards
Stock standard samples were weighed in a Petri dish and dried in an oven for2hat105°Candcooled in a desiccator, as some of the constituent compounds are hygroscopic. A total of 15 calibration standard specimens were prepared following the standard dilution approach by Mashima10 and Mori and Mashima.,11 The specimens were prepared by mixing percentage fractions of standard stocks to mimic the heavy mineral sands matrix and to ensure that the required analytical ranges were covered. In order to precisely evaluate and determine the background of trace elements and possible line overlaps, a 66%ZrO2:33%SiO2:1%HfO2 high concentration interference standard was prepared for the line overlap of Zr-La on P-Ka line and to calculate background factors for trace oxides (P2O5,U3O5 and ThO2).8
Compositions of calibration standards are shown in Table 2. The lithium borate fusion method was chosen because of its excellent repeatability and accuracy to prepare homogeneous calibration standards glass specimens for XRF analysis.15 The calibration specimens were made using a convenient sample/ flux weight ratio of 1 g sample and9gof50/50 lithium tetraborate/lithium metaborate flux to ensure proper dissolution. A 1:9 sample dilution was chosen to considerably reduce the matrix effects for the major elements and allow sufficient sensitivity for trace elements. A Mettler M104TS four-decimal-digit electric balance was used to weigh the sample and the flux. As the Thermo XRF generally accommodates glass beads of 32 mm in diameter as a standard, the weights of the sample and flux used are suitable for the preparation of glass beads of this diameter. The mixtures were thoroughly mixed with a vortex mixer to ensure homogeneity between the sample and the flux. The mixture was put into a platinum crucible (95 % Pt and5%Au alloy).
The features of an ideal fusion procedure are the retention of all elements in sample and the flux.17 Therefore, type of fluxer and flames used to fuse the samples are also of utmost importance. Fusion was carried out with an automated propane gas fluxer (Nieka GS4) producing good quality 3 mm thick glass beads. The Nieka GS4 has predefined fusion programs, but customized programs can also be created by the user. Each program contains seven steps, including oxidation step, four fusion steps, a pouring step and cooling steps. Each step contains parameters that can be changed, such as % gas power, duration and % cooling power. The propane gas power was adjusted to 50 % in the main fusion steps to reach 950 °C, which is slightly above the borate melting point of 870 °C. The aim was to fuse below 1050 °C to avoid flux volatilization as per Loubser el al.22findings. The duration of the initial heating steps is 240 s and that of the main fusion steps including agitation to make the melt homogeneous without any bubbles is 660 s. After the casting step, an initial cooling cycle of approximately 300 s is started. The cooling was gradually to keep the moulds hot enough to avoid thermal shock that would lead to crystallization associated with rapid cooling.23 Thus, the total cycle time,
excluding the pouring step, is approximately 20 min. The parameters were selected to maximize the efficiency of sample preparation and the complete dissolution of hard zircon mineral as being difficult to dissolve.23
To improve the precision of the calibration and to aid in the identification of 'bad' fused specimens, the calibration specimens were prepared in duplicates. After work, the platinum ware was cleaned with citric acid solution in an ultrasonic bath. The citric acid is sufficient to digest any residual melt stuck to the platinum ware and is safer than a hydrochloric acid solution. The glass beads were kept in plastic sample trays and stored in a desiccator until measurement. Fusion program parameters are shown in Table 3.
2.3. Optimization of Analytical Conditions
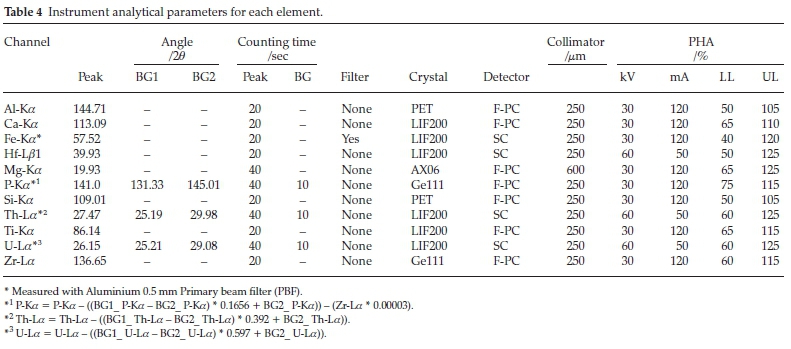
The study was conducted on a Thermo ARL 9900 XRF instrument equipped with a Rh anode, end window X-ray tube with a maximum operating power of up to 3.6 kW. The spectrometer is fitted with instrumental parameters, which the analyst can adjust to achieve best analytical conditions. Various analytical parameters were optimized to perform efficient and accurate analysis. Instrumental parameters were selected to obtain the highest count rates from each element to compensate for the dilution of the sample with flux, which leads to a decrease in fluorescence intensity. This was done by setting up X-ray tube at 30 kV and 120 mA for long wavelength analytical lines, such as Ca-Ka,P-Ka, Si-Ka, Al-Ka,Zr-La, Fe-Ka, Ti-Ka and Mg-Ka,at 60 kV and 50 mA for short wavelength lines, Hf-Lß1, Th-La and U-La. Having too many X-ray tube power settings may affect the lifespan of the X-ray tube. Thus, to have only two power settings, for Ca-Ka, Fe-Ka and Ti-Ka the 30 kV setting was used, even though is not optimum. However, it is sufficient to excite these elements as minors. The X-ray generator of the Thermo XRF was maintained at eco-mode of 10 kV and 10 mA when not in use. The increase from 10 kV and 10 mA to 60 kV and 120 mA for measurement did not require a long wait time.
Changing the kV, changes both the intensity and the wavelength distribution of the tube spectrum. Changing the mA on the tube, changes only the intensity of the tube spectrum but has no effect on its wavelength.2 Generally, high voltage is recommended to be used with heavy elements and high current with light elements.23 This is due to the fact that as the wavelength of the analyte increases the absorption of the intense Rh K-lines and high energy continuum decrease.2 The Ka-lines were used for the elements with X > 0.2 nm and La-lines were used for the elements with X < 0.2. Zr-La was preferred rather than Zr-Ka, due to the fused beads that are typically 2-3 mm thick. Because it does not have sufficient thickness for the required critical depth (~5 mm) for Zr-Ka.23 The Thermo 9900 has three types of collimators that can be selected to direct a parallel beam of X-rays from the sample to the analyzing crystal, namely, fine (150 μm), medium (250 μm) and coarse (600 μm). To achieve high sensitivity a 600 μm collimator used for Mg, and the collimator used for other elements is a 250 μm collimator (due to its good sensitivity and peak resolution). The fine collimator was not considered due to its low sensitivity.
X-rays of any wavelength can be diffracted (scattered) by crystal planes in a crystal lattice. Bragg's law states that for a given crystal plane and for a given order of diffraction of X-ray radiation, each wavelength in the incident XRF spectrum is diffracted at a unique angle. In order to cover the necessary wavelength range for the mineral sand samples, the four X-ray dispersive crystals, namely, a multilayer AX06, PET, Ge111 and LiF200, were used. The analyzing crystals were selected according to their sensitivities, angular dispersion and resolution of the secondary spectrum. Resolution is more important for elements where the peaks are closer to one another. LiF200 crystal has high intensities, good dispersion and is useful for both the short and medium wavelength analytical lines. The PET crystal was used for Al-Ka and Si-Ka due to its good diffraction efficiency. As we go from short wavelengths to long wavelengths, the interplanar spacing of the crystal also increases. As a result, for Mg-Ka the multilayer AX06 crystal was chosen, since it has a d-spacing of >1 nm. The Ge111 crystal was used for P-Ka and Zr-La, because it has no second order lines (n = 2) from Ca-Kß2 that interferes with P-Ka.
Since the range of interest for X-ray wavelengths is wide from ~0.091 nm (U-La) to 0.99 nm (Mg-Ka), two different detectors were employed, namely, an Ar-CH4 gas flow proportional counter (F-PC) for long wavelengths (>0.2 nm) and scintillation counter (SC) for short wavelengths (<0.2 nm). The detectors for counting incoming photons were chosen based on their counting efficiencies at the wavelength of the analyte. When the gas flow counter is used and escape peaks are generated, the escape peaks must be included in the PHA window. However, must be excluded for elements close to instrument electronic noise.2 The Ar-CH4 gas flow in F-PC was at 5934 μL min-1. Instrumental analytical parameters for each element are shown in Table 4. A lower mA setting for light elements requires longer counting times, resulting in a longer analytical time.23 To obtain sufficient counts the detector counting time was set to 40 s for all the trace elements, such as Mg, U, P, and Th, and 20 s for minor and major elements. All the measurements were made under vacuum mode to avoid absorption of low-energy radiation.
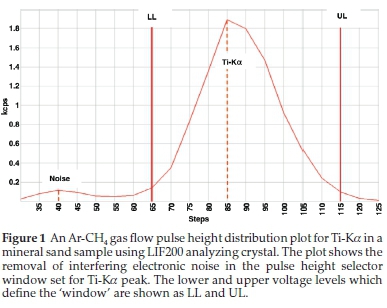
Both Ar-CH4 Gas and Scintillation counters used in XRF are proportional detectors in the sense that the energy of the incident X-ray photon determines the magnitude of the voltage pulse produced by the circuitry (pulse height measured in mV). A pulse height analyzer (PHA) makes use of this effect in order to select only a narrow range of voltage pulses, thus rejecting all those unwanted pulses. The PHA was used to reduce interference from higher order spectral lines and reduce backgrounds giving lower limits of detection for trace elements. The PHA includes adjustable upper and lower electronic thresholds forming a window. In Thermo ARL instruments the energy distribution is from 35 to 160 %; however, the ideal energy profile of an element line should have a lower threshold of 40 % and an upper threshold of 140 % (100 % window). The energy of the measured element line is assumed to be around 85 %. All pulses with energies within the window are passed on to a detector and all pulses outside the window are excluded. The upper and lower thresholds for Ar-CH4 Gas must be checked for potential drift every six months, due to changes in gas pressure and temperature.2
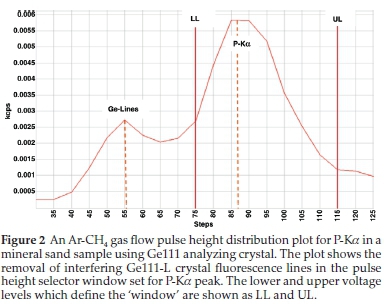
Escape peaks for Ti and Ca Ka- lines are close to lower level electronic noise (<40 %), therefore the lower limit was selected to exclude the noise pulse. For phosphorus, there were Germanium crystal fluorescence lines which appeared on the lower side of the main pulse height. Crystal fluorescence occurs when an element in the analyzing crystal is excited by radiation from the elements in the sample and thus emits characteristic X-rays. The PHA window was set to exclude the Germanium crystal fluorescence peak, as recommended by Potts.2 The PHS graphics of Ti-Ka and P-Ka are shown in Figs. 1 and 2.
Setting the PHS is useful to check that the highest intensity to be measured, does not saturate the detector electronics. If it does, a different filter, collimator or analyzing crystal, or analyte line must be used.2 The PHA of Fe-Ka was too broad having a poor resolution as a result, Aluminium 0.5 mm primary beam filter was used to reduce disturbances caused by Brems spectrum (rhodium X-ray tube photons).
Two typical samples were scanned for qualitative analysis of each analyte at their respective analytical parameters. Doing qualitative wavelength scans on a typical sample indicates the 20 angles at which each element line of interest is diffracted by the crystal used for analysis. The resulting spectra were overlaid to evaluate for analyte peak selection and spectral overlap on both peak and background positions by graphical interpolation.24
The background corrections for all trace elements, such as Th and U, were made by measuring the intensity at peak and interference-free spectral positions. Background factors were calculated by measuring matrix 'blank' sample (66%ZrO2: 33%SiO2:1%HfO2). It was noticed that the background in the region of Nb-Ka to U-La is sloping and highly curved. Thus, background intensities were measured on both sides of the peak at interference-free positions close to the peak.24 Therefore, to calculate the estimated background at the peak positions, method A from Willis and Duncan23 was preferred. It accommodates both the sloping and curvature of the background. This method only measures the intensities of the peak and background positions. It is recommended for trace element analysis as it requires the use of a blank sample in calculating a background factor.
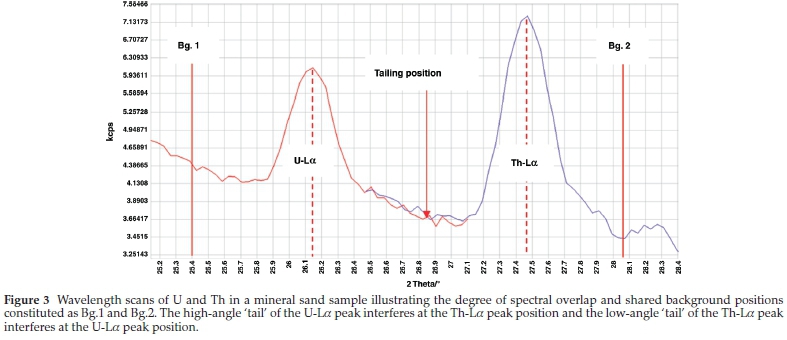
For P-Ka background position determination, the lower angle background was positioned at (130 °) just below the Zr-La (137 °). This is because the lower angle background has the potential to be overlapped by intense Zr-La tailing onto P-Ka. For U-La and Th-La, since they share background positions, it was difficult to select interference-free background positions for the LiF200 crystal, because of its fair resolution. Thus, their peaks are tailing to each other's background positions and it is therefore, not possible to locate background positions. The wavelength scan of U-La and Th-La is shown in Fig. 3.
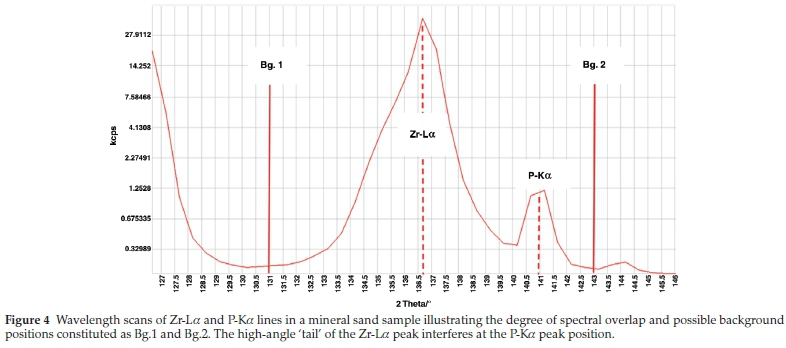
No spectral overlaps were really expected for the elements with low atomic numbers, like Si, P, Mg and Al, because the line wavelengths for these elements are not as close together as those for elements with higher atomic numbers.23 As mentioned, the Zr-La background tails onto that of P-Ka, therefore spectral line overlap was necessary. Spectral line interference of Zr-La on P-Ka was corrected for by calculating interference correction factors from intensity measurements made on specially prepared 'interference standards' containing 66%ZrO2:33%SiO2:1%HfO2. The correction was done by subtracting a fraction of the Zr-La overlapping peak from the P-Ka peak, after background correction. From the corrections above it was found that, 35 % of the P-Ka peak is attributed by both background and spectral overlap. The wavelength scan of P-Ka is shown in Fig. 4.
There was another overlap identified of Hf-La by the second order Zr-Ka lines. However, it was solved by choosing Hf-Lß1as the Hf analyte line. Hf-Lß1 line maybe overlapped by second order Zr-Kß1. However, Hf-Lß1 is slightly more intense than Hf-La, and Zr-Kß1 is much less intense than Zr-Ka. Its intensity is minimized by the correct pulse high selection.
Accurate results are possible when calibration standards are prepared properly. A total of nineteen synthetic standards of which only four are CRMs (stocks) were used. Emphasizing the limited availability of CRMs. The empirical calibration was done per element; the concentration of the element was calibrated against its net intensity, without making any matrix effect correction. It was possible to use this type of calibration, since the calibration standards and sample matrix compositions were the same, and fused glass discs were made at high dilution ratio. Data points of the calibration standards narrowly fitted the calibration lines, except for Th and U. Their respective calibration standards were scattered around the calibration line, it was assumed to be a matrix error. Other calibration lines had (r2)> 0.999, indicating that excellent calibration lines have been established (Table 6). The calibration standards were selected to cover the whole range of concentrations required in the quantitative analysis, to prevent extrapolation which may cause erroneous results.
The calibration lines were validated for accuracy to see if any corrections for matrix effect were needed to be made. The software of the instrument evaluates the calibration curve using a mathematical fit calculation according to the SEE value (standard estimated error). This value gives an indication of the accuracy of the correlation fit of all the standards used on the calibration line, and takes into account the absolute difference (A) between the true concentration value (a) and the calculated value (x), as well as the number of calibration standards used. The value obtained for A must be very small in the sense that the difference between the true value of the standard and the value calculated according to the linear response equation of the calibration line is low.26
The matrix effect correction was applied to all the elements to maximize the accuracy using the Comprehensive Lachance (COLA) algorithm. COLA uses theoretical influence coefficients studied by Rousseau25 and is applicable over very wide ranges of compositions and is calculating specific coefficients for every specimen. This program is built into the Thermo ARL software. Matrix effect had no influence on all the calibration lines. The Th and U calibration standards remained scattered. The calibration data points that were not fitting in the calibration lines were removed and considerable improvement was observed on both Th and U, without matrix correction. The SEE values decreased to <0.1 % respectively indicating the accuracy of the correlation of all the standards used on the calibration line. Before the data points were removed, the SEE value of Th was 2.3 %. This proves that the matrix effect can be removed at ten times dilution, but not at six times dilution.14
2.4. Validation
The optimized calibration was validated as per SANAS TR 26-02 criteria for its linearity, limit of detection (LOD), limit of quantification (LOQ), analytical working range, precision and accuracy. The linearity of the lines was evaluated by evaluating the correlation coefficient (r2). The linear regression of the calibration line is acceptable if r2 > 0.997.20 Nevertheless, several studies focused on the fact that r2 might not be a useful indicator of linearity and other statistical tests including the two-sided t-test have been suggested to ascertain the goodness of fit of the calibration curve.20
Thus, in addition to r2, the analysis of variance (ANOVA) results of the calibration were used to confirm significant linearity by using a two-sided t-test. The calculated value of t was compared with the tabulated value at 95 % significance level, adopting a two-sided t-test and (n-2) degrees of freedom. The null hypothesis in this case was that there is no correlation between x and y. If the calculated value of t is less than the tabulated value, the null hypothesis is rejected, and we conclude that a significant correlation does exist.
Every analyte in an analytical method has a detection limit (LOD), depending on the calibration line range and instrument hardware and software settings selected for that element. Since there was no blank measured as part of the calibration standard, the calibration data and regression statistics were used to theoretically determine the LOD. The approach used for calculating detection limits includes the error (sB) associated with measurements of the analytical sensitivity (m). The intercept error was neglected, it was assumed to be 0, because the analytical measurements for trace elements are background corrected. The LOD was found by relating 3sB (k = 3) to a concentration value by dividing by the slope of the calibration curve line obtained from the linear regression analysis. The use ofk=3allows a confidence level of 99.9 %. The generally accepted rule in XRF is that if the concentration is lying at 3sB/m above the mean background, based on the normal distribution statistics, there is a 99.9 % probability that the concentration does not belong to the background.2 LOQ was determined using 10sB/m to ensure it is 10 times away from background signal. Thus, the analytical working range in this study was defined as the interval between the LOQ and upper calibration standard of an analyte.
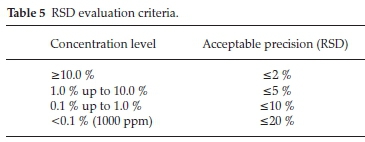
The repeatability of results is an indication of the precision of a method. Precision was evaluated in two parts, by the within-laboratory reproducibility and instrument precision. Within-laboratory reproducibility was determined with the top-down method, where a homogeneous typical sample was independently prepared and analyzed. The measurement data were collected within a minimum period of six months. The aim was to cover laboratory varying conditions. This ensures that variations due to different operators, re-calibrations, routine instrument maintenance are captured. The %RSD is chosen as an indication of the precision, because this value represents all the results obtained during a multiple analysis of the same sample for the same element(s). For the precision to be good, the %RSD should be < Acceptable %RSD in Table 5, indicating little deviation between results falling within the results population. The instrument precision was determined using methodology studied by Richard,27 whereby one specimen bead was analyzed for ten days and the %RSD technique was applied. The criteria in Table 5 were applied in the decision making. The accuracy using CRMs was not tested due to the unavailability of CRMs.
However, it was rather tested through a proficiency testing (PT) scheme. Proficiency testing is an important component of any system of laboratory quality assurance.28 ISO/IEC 17025 lists participation in proficiency testing programmes as an important component of the quality assurance of test results.28 It is a comparative study and the evaluation of the data is dependent on the performance of the participating laboratories in relation to one another.
The principal aim of a PT exercise is to evaluate the competence of the calibration and thus provide the laboratory with a tool to improve the accuracy and traceability of the measurements. It also enables the laboratory to assess its performance relative to domestic and international peer laboratories, hence improving the comparability of results between laboratories and between countries.29 Procedure followed, a bulk of milled typical heavy mineral sand sample was homogenized in a tubular mixer for 18 h. The sample was named as RR005/18 and weighed into 50 g portions and sealed in plastic bags and circulated to multiple laboratories. Due to the scarcity of CRM's, it was not possible to send out a sample with 'known' contents. The sample was in essence 'unknown' and therefore "a 'best'" estimate of the real content, called the consensus value, was used for evaluation purposes. Various analytical techniques were used for the analyses such as:
• XRF - fusion and powder pellet
• Wet Chemistry, Volumetric, Gravimetric, Auto-titration, UV Vis
• ICP-MS
• ICP-OES
Participant results were captured and evaluated using Robust statistics z-score method discussed by Rousseeuw and Hubert.30 The criterion described by Thompson et al?1was used for the classification of the results, where z-scores in the range -2<z<2 are considered to be satisfactory. For z-score values of any element that fell outside this range, the calibration will be examined to ensure that determinations were not subject to unsuspected analytical bias. Thompson et al.31stated that the magnitude of the z-score allows the laboratory to assess the accuracy of results in comparison with other participating laboratories.
For calculation of z-score the following equation is used:
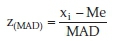
where MAD (median of all absolute deviations converted to an equivalent scale) = median (xi - Me) x 1.483; Me is reference material median of xi;xi is value of participant; and 1.483 is a correction factor, which makes the MAD consistent for Gaussian distributions.
The z-score method is dependent on the performance of the other participating laboratories. It is in relation to the other participants and not an exact science.
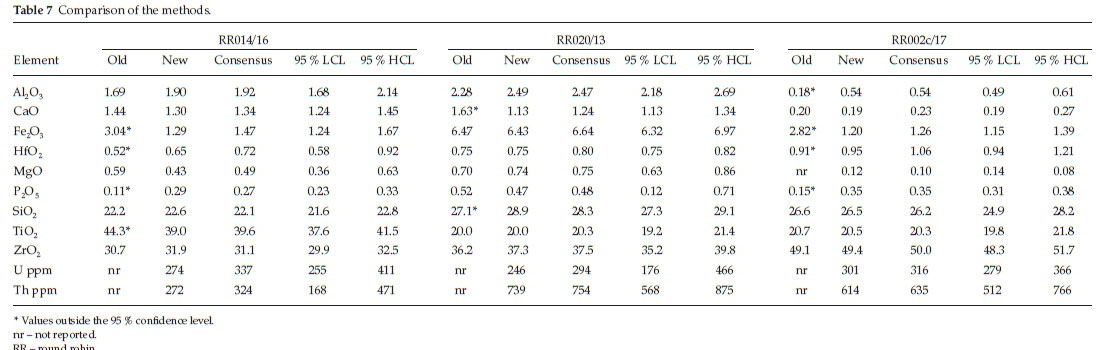
To evaluate the sustainability of the newly developed method a comparative study was done between the old and new method. Three samples namely RR14/16, RR014/16 and RR002c/17 of different matrices, with known concentrations, were chosen and analyzed using both methods. These samples were back-up portions from PT exercises conducted for customer complaints investigations. A 95 % confidence interval was used to establish whether the means of the old and newly developed method are within the 95 % confidence limits of the PT data.20
3. Results and Discussion
In this study, each synthetic standard was made by homogenizing pure compounds with reference materials usingblending operations. The calibration standards were prepared by carefully weighing, mixing and then homogenizing with borate flux. The calibration glass disks were made by mixing different proportions of stock standard samples with lithium tetraborate/ lithium metaborate mixtures and fused. All the calibration standards yielded good glass specimens. The 50/50 lithium tetraborate/lithium metaborate flux Claisse performed well for all acidic oxides.18 The specimens of each standard were prepared in duplicate and analyzed to check the repeatabilityof the results. Borate fusions were found advantageous for the preparation of synthetic standards.
Low intensities for trace elements, such as Mg, Th and U, were noticed. The loss was due to dilution of standards with borate flux, especially with intensities that are already very low. Low dilution techniques and application to the analysis of trace elements were described by Eastell and Willis.32 The flux being a material made of light elements only, scattered radiation is higher than usual, which results in higher background and lower line/background ratio. This loss of intensity was less than expected from direct proportionality with the dilution, and is not too inconvenient, because the spectrometer tube voltage and current settings were adjusted to achieve maximum excitation. The proper selection of tube voltage and current settings is very important in determining the excitation efficiency of different groups of elements. The effect of changing the kV and mA settings on the X-ray tube is significant.
For long wavelength analytical lines, Ca, P Si, Al, Zr, Fe, Ti and Mg, the voltage applied to the X-ray tube was reduced to 30 kV. This is because as the wavelength of the analyte increases the absorption of the intense Rh K-lines and high energy continuum decreases.2 For Hf, Th and U the voltage and current were adjusted to 60/50 kV to change both the intensity and the wavelength distribution of the tube spectrum so that, their respective lines will be excited by the Rh K-lines. This is because the energies of Rh K lines are higher than the L-lines binding energies of these elements.
The data points of the calibration are narrowly distributed around the calibration lines, which were constructed by plotting net intensities as functions of given concentrations. The obtained correlation coefficient values were >0.999 showing significant linearity. The calculated value of t is greater than the tabulated value; the conclusion was that a significant correlation does exist. As expected, the closer r2 is to 1 the larger the values of t, indicating a stronger straight-line relationship.
The obtained LOQs were adequately low extending the analytical working ranges. XRF technique proven that, it has high sensitivity, which decreases LOQ in the analysis of U and Th compared to AAS, ICP-OES.33 The required analytical ranges were covered. The actual analytical ranges were described from the lower limit of quantification to the highest calibration standard.
On examining both the RSD of the instrument precision and within-laboratory repeatability, shown in Table 6, it is obvious that the %RDS for all elements is very low. This indicates good precision for all the elements analyzed. All the RSD values are below 5 %, lower than acceptable RSD criteria (Table 5). This further supports the assumption that the XRF instrument is stable and the sample preparation precise, due to the results being reproducible. For Mg, the instrument RSD value is 3 % relatively high compared to the values for the other elements. This is as a result of low energy elements, such as Mg and Al, yielding significant low intensities due to dilution. At low sample/flux ratio, the sensitivity of the XRF, when analyzing low concentration elements, decreases which in turn means a decreased repeatability due to decreased instrument precision.32
All oxides z(MAD) scores were deemed satisfactory in the PT scheme. Satisfactory criterion means the results are within the two-standard deviation (2ó) limit from the population average. This proves that the optimized calibration results are trustworthy, although some of the calibration curves were built without matrix-effects correction. Phosphorus was close to a questionable z-score criterion; it was the only element where the analytical working range was not wide enough to allow determination of real samples by interpolation and not extrapolation. Phosphorus in overall mineral sands chemistry is not usually present in significant quantities. An overview of the validation summary for the oxides is shown in Table 6.
In order to validate the new and old methods, a comparison to an accepted method was performed. The comparative study data show poor comparison between the methods on the three selected samples (Table 7). Many of the values from the old method lie outside the confidence limits and are asterisked in Table 7. The old method responds differently to the various internal sample streams analyzed; hence, it was ear-marked for improvements. The method is erratic as a result of the calibration material being depleted. In order to move away from the lack of mineral matrix-matched calibration material, an analytical method utilizing synthetics was the option. There was no significant difference between the new method and the consensus.
The new method additionally contains U and Th for shipping purposes, as some of the various concentrate streams are shipped to overseas markets. Some heavy mineral sand fractions (e.g. Monazite, Rutile and Zircon) are often slightly radioactive and some countries have regulatory controls over the U and Th levels.1
4. Conclusions
The data presented here support the successful synthesis and use of a well-selected set of synthetic standards. It also shows that precise and accurate analysis of samples can be achieved without matrix correction. The fact that synthetic standards are chemically pure and traceable offer important support for compliance with company operating procedures and relevant legislation. It is to be hoped that the synthetic calibration protocols developed and tested in the present work will be adopted by other mineral sands researchers and industry operators to improve ore characterization methodologies and perhaps develop elemental compositions-based markers to predict extraction performance.
The main concerns with fabricating synthetic standards are errors associated with weighing of trace elements as reported by Giles et al.12The low cost and readily available matrix-matched samples retained from the proficiency-testing exercise make it possible to use them routinely as control samples, allowing fast response times to problems, once they have been identified.
Acknowledgements
The authors thank Tronox Namakwa Sands, for their financial support and providing the necessary facilities for all research work. Special thanks to referees Prof. J.P. Willis, Dr. B. Vrebos and Prof. D. Reid who generously gave their time and provided valuable suggestions to improve the quality of the manuscript. The authors further wish to acknowledge the assistance of Tronox Laboratory analystswhoprepared most of the samples.
Conflicts of interest
The authors declare that there are no conflicts of interest regarding the publication of this article.
ORCID iD
C. Badla: orcid.org/0000-0002-4974-3337
References
1 C. Philander, A. Rozendaal, S.G. Le Roux and A. du Plessis, Grade and product quality control by microCT scanning of the world class Namakwa Sands Ti-Zr placer deposit West Coast, South Africa: an orientation study, Miner. Eng., 2018,116(2), 152-162. [ Links ]
2 P.J. Potts, A Handbook of Silicate Rock Analysis, 1st edn., Springer, New York, 2013, pp. 226-285. [ Links ]
3 J.R. Sieber, Matrix-independent XRF methods for certification of standard reference materials, Adv. X-Ray Anal., 2002,45. [ Links ]
4 T. Yamasaki, XRF major element analyses of silicate rocks using 1:10 dilution ratio glass bead and a synthetically extended calibration curve method, Bull. Geol. Surv. Japan, 2014, 65(7/8), 97-103. [ Links ]
5 T.T. Chiweshe, W. Purcell and J.A. Venter, Evaluation of different internal standards for precious metals quantification, Bull. Chem. Soc. Ethiop, 2016, 30(1), 55-70. [ Links ]
6 ISO/DIS 11494.2, International Organization for Standardization Determination of platinum in platinum jewellery alloys-method using inductively coupled plasma emission spectroscopy on a solution with yttrium as internal standard, Doc., 2007. [ Links ]
7 AS 4392.1-1996. Heavy mineral sands - Analysis by wavelength dispersive X-ray fluorescence spectrometry - Titaniferous mineral sands. Standards Australia. [ Links ]
8 M. Bouchard, A. Milliard, S. Rivard andS. Ness, ISO 9516-1 Simplified borate fusion/WDXRF analytical method for iron including total iron analysis: Part 2, Cambridge University Press, Cambridge, U.K., 2014. [ Links ]
9 G. Staats, Synthetic macro-reference samples for the calibration of instruments in inorganic bulk analysis, Fresenius J. Ana/. Chem., 1989, 334(4), 326-330. [ Links ]
10 H. Mashima and Y. Mori, X-ray fluorescence analysis of major and trace elements in silicate rocks using 1:5 dilution glass beads, Bull. Kilakyushu Mus. Nal. Hisl. Hum. Hisl., 2005. [ Links ]
11 H. Mashima, XRF analyses of major and trace elements in silicate rocks calibrated with synthetic standard samples, Nal. Resour, Environ. Humans, 2016, 6, 39-50. [ Links ]
12 H.I. Giles, P.W. Hurley and H.W. Webster, Simple approach to the analysis of oxides, silicates and carbonates using X-ray fluorescence spectrometry, X-Ray Speclrom., 1995, 24(4), 205-218. [ Links ]
13 P.J. Willis, XRF Sample Preparalion - Glass Beads by Borale Fusion, 1st edn., vol. 33, PANalytical BV, Netherlands, 2010, pp. 431-453. [ Links ]
14 Y. Kusano, S. Umino, J. Kobayashi, Mizukami, M. Okuno and S. Arai, Quantitative analysis of major elements in igneous rocks with X-ray fluorescence spectrometer "ZSX primus II" using a 1:10 dilution glass bead, Sci. Rep. Kanazawa Univ., 2015, 58, 31-44. [ Links ]
15 F. Claisse and C. Samson, Heterogeneity effects in X-ray analysis, Adv. X-Ray Anal., 1962, 5(12), 335-354. [ Links ]
16 K. Norrish and J.T. Hutton, An accurate X-ray spectrographic method for the analysis of a wide range of geological samples, Geochim. Cosmochim. Acla, 1969, 33, 431-553. [ Links ]
17 H. Bennett and G. Oliver, XRF Analysis, Minerals and Allied Malerials, John Wiley & Sons, Chichester, 1992. [ Links ]
18 F. Claisse, Choix de la composition optimale d'un borate de lithium dans la preparation des perles pour analyse par Fluo-X, France, J. Physique IV, 1998, 8, 39-384. [ Links ]
19 E. Prichard and V Barwick, Qualily Assurance in Analytical Chemislry, John Wiley & Sons, Chichester, 2007. [ Links ]
20 Eurachem Guide, The Filnessfor Purpose of Analytical Melhods. A Laboralory Guide lo Melhod Validation and Relaled Topics, 2nd edn., LGC (Teddington) Ltd, 2014. [ Links ]
21 M. Lezzerini, M. Tamponi and M. Bertoli, Calibration of XRF data on silicate rocks using chemicals as in-house standards, Alli Soc.Tosc. Sci. Nal., Mem., 2014, Serie A (121), 65-70. [ Links ]
22 M. Loubser, C. Strydom and H. Potgieter, A thermogravimetric analysis study of volatilisation of flux mixtures used in XRF sample preparation, X-Ray Speclrom., 2004, 33(3), 212-215. [ Links ]
23 J.P. Willis, K. Turner and G. Pritchard, XRF in lhe Workplace, A Guide lo Praclical XRF Speclromelry, PANalytical Australia, 2011. [ Links ]
24 M. Ogasawara, M. Mikoshiba, G. Shimoda and Y. Ishizuka, Optimization of analytical conditions for major element analysis of geological amples with XRF using glass beads, Bull. Geol. Surv. Japan, 2018, 69(2), 91-103. [ Links ]
25 R.M. Rousseau, Corrections for matrix effects in X-ray fluorescence analysis - A tutorial, Part B, Speclrochim. Acla, 2006, 61, 759-777. [ Links ]
26 M. Tamponi, M. Lezzerini, G.D. Avanzi, S. Iaccarino and N. PerchIazzi, XRF analysis of major and minor elements in silicate rocks using fused glass discs at high dilution ratio, Alli Soc. Tosc. Sci. Nal., Mem., 2016, Serie A (123), 55-59. [ Links ]
27 R.M. Richard, Detection limit and estimate of uncertainty of analytical XRF results, The Rigaku J., 2001,18(2), 33-47. [ Links ]
28 ISO/IEC 17025, General requirements for the competence of testing and calibration laboratories, ISO Geneva, 2005. [ Links ]
29 H. Sandström, S. Reeder, A. Bartha, el al., Sample preparation and analysis, Geochemical Allas ofEurope, 2005. [ Links ]
30 P.J. Rousseeuw and M. Hubert, Anomaly detection by robust statistics, WIREs Dala Mining Knowl. Discov., 2018, 8, 1-14. [ Links ]
31 M. Thompson, P.J. Potts, J.S. Kane and S. Wilson, An international proficiency test for analytical geochemistry laboratories, Geoslandards Newsleller, 1999. [ Links ]
32 J. Eastell and J.P. Willis, A low dilution fusion technique for the analysis of geological samples, 2 - Major and minor element analysis and use of influence/alpha coefficients, X-Ray Speclrom., 1993, 22, 71-79. [ Links ]
33 T.P. Rao, P.M. Metilda and M. Gladis, Preconcentration techniques for uranium (VI) and thorium (IV) prior to analytical determination an overview, Talanla, 2006, 68(4), 1047-1064. [ Links ]
Received 14 August 2019
Revised 11 March 2020
Accepted 17 May 2020
* To whom correspondence should be addressed. E-mail: cramwell.badla@tronox.com

