


Serviços Personalizados
Artigo
 Inglês (pdf)
 Artigo em XML
 Referências do artigo
Indicadores

Links relacionados
-
 Citado por Google
 -
 Similares em Google
Compartilhar

 Permalink
South African Journal of Chemistry
versão On-line ISSN 1996-840X
versão impressa ISSN 0379-4350
S.Afr.j.chem. (Online) vol.72 Durban 2019
http://dx.doi.org/10.17159/0379-4350/2019/v72a34
RESEARCH ARTICLE
Kinetics, Thermodynamics and Isothermal Modelling of Liquid Phase Adsorption of Methylene Blue onto Moringa Pod Husk Activated Carbon
G.B. AdebayoI, *; W. JamiuI; H.K.OkoroI, * ; F.O. OkeolaI; A.K. AdesinaI; O.A. FeyisetanII
IAnalytical-Environmental & Material Science Research Group, Department of Industrial Chemistry, Vacuity of Physical Sciences, P.M.B. 1515, University of Ilorin, 240003 Ilorin, Nigeria
IIDepartment of Chemistry, Federal University of Technology, Minna, Nigeria
ABSTRACT
This study focused on the liquid phase sorption of methylene blue (MB) using low cost agro-waste from moringa pod husks. Moringa pod husk was carbonized at 450 °C for 30 min, which was later activated with 0.1 M phosphoric acid. The physico-chemical properties of moringa pod activated carbon (AMP) were determined. The results of the physicochemical parameters are: moisture content (13.6 ± 0.02), ash content (2.61 ± 0.11), point of zero charge (pHZPC) (7.2) and bulk density (0.6 g L-1). The sample was also characterized using Brunaeur Emmett Teller (BET), scanning electron microscopy (SEM), energy dispersive X-ray spectroscopy (EDX) and Fourier-transform infrared spectroscopy (FTIR). The BET surface area obtained for AMP is 1340.234 m2 g -1. The effect of optimized parameters such as initial concentration, contact time, pH, adsorbent dosage, and temperature on methylene blue removal was investigated. The obtained maximum monolayer adsorption capacity value (qmax)is 9.5785 mg g-1. The three adsorption isotherm models, namely Langmuir, Freundlich and Temkin, were employed to describe the fitness of equilibrium data. The Langmuir equation fitted the adsorbent system better with a R2 value of 0.9958. The pseudo-second-order kinetic equation also fitted the data well. Thermodynamic studies showed that the AMP-MB adsorption system is spontaneous and endothermic as a negative and positive value was obtained for AG" (-0.460 KJ mol-1) and ΔΗ" (4.482 KJ mol-1), respectively.
Keywords: Moringa pod husks, characterization, methylene blue, adsorption kinetics, adsorption models.
1. Introduction
In recent years, synthetic dyes have often been used in various industrial dyeing and printing processes. The textile industry is the largest consumer of synthetic dyes utilizing about 56 % of the total world dye production per annum of7x1051.1 During the textile dyeing process, released untreated effluent may contaminate water bodies which poses a great threat to aquatic organisms and the people who use these water bodies for living purposes. In a water supply system, when a concentration as low as just 1.0 mg L-1 of dye is present in the water supply, it could be dangerous for human consumption.2
Physical and chemical properties of water such as the colour, taste, odour, alkalinity, acidity, etc., are affected when these dyes are present. Other effects include: toxicity to aquatic life, mutation of DNA, carcinogenicity, and damage to some vital organs in human beings, such as dysfunction of the kidneys, reproductive system, liver, brain and central nervous system.3 Dyes possess complex aromatic structures and therefore they may not be biodegradable.
The treatment of these water bodies before water consumption is very important. A broad number of reported methods, e.g. UV/H2O2 oxidation, adsorption, flocculation, precipitation, micro-filtration, and membrane separation processes have been applied in the removal of dyes from water.4-5 Despite the reported treatment methods, adsorption has been found to be more useful in the removal of contaminants from wastewater. Adsorption has some advantages over other methods of treatment which include low cost regeneration, known process equipment, non-sludge system operation and adsorbate recovery.6
Owing to the high cost of production of activated carbon industrially, activated carbon from agricultural wastes such as orange peel, moringa seed, cashew nut, neem seed, coconut husk rice husk, almond seed, etc.7-8, are now being considered for adsorbing contaminants onto their surfaces. These natural materials are cheap, can be produced in large quantities, and have good sorption capacity.
Therefore, this work is aimed at sorption of methylene blue from aqueous solution onto activated carbon from moringa pods.
2. Experimental
2.1. Sampling and Preparation of Adsorbent
Moringa pod (MP) husks were largely collected from the grounds of the University of Ilorin, Ilorin, Nigeria. They were washed with running tap water to remove impurities in the form of sand, dust, soluble and coloured components. The moringa pods were then dried in an oven at 110 °C for 4 h.9 The dried moringa pods were pulverized with mortar and pestle to reduce the size. 50 g of the ground MP was impregnated for 24 h. with 200 mL of 0.1 M of phosphoric acid to form 1:4 of impregnation ratio; after 24 hours of impregnation, the excess acid was decanted and the material was pyrolyzed in a muffle furnace at 723 K for 30 min.2
The prepared activated MP was washed with 200 mL of distilled water to remove the activating agent (H3PO4) used for impregnation. The washing was continued until pH of between 6.5 and 7 was achieved. It was oven-dried at 105 °C for 4 h to constant weight.10 The dried sample was sieved with 0.05 mm mesh to obtain fine powdered activated carbon denoted as AMP. The activated carbon moringa pods (AMP) were kept in airtight vials and used for further studies.
2.2. Batch Adsorption Experiments
A stock solution of 100 mg L-1 methylene blue was prepared and standard working concentrations ranging from 5-100 mgL-1 were prepared by serial dilution of appropriate volumes from the stock. The stock solution was scanned with a Beckmann Coutler UV-visible spectrophotometer to obtain maximum wavelength (Imax = 682 nm) at peak absorbance.
A batch adsorption study was done in order to determine the effect of optimum conditions such as pH, contact time, adsorbent dose and initial concentration of the dye solution. The effect of pH on the dye was carried out using 0.1 M HCl and 0.1 M NaOH, whereas the adsorbent dose and contact time were carried out by varying the quantity of the adsorbents and time, respectively. The temperature was varied between 30 °C and 80 °C. From the conducted experiments, the optimum parameters were obtained and were used for further studies. The quantity of the dye adsorbed was calculated using Equations 1 and 2, respectively.
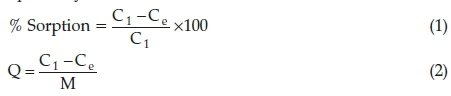
where Q = quantity of solute adsorbed in (mg g-1), V = specific volume of the adsorbate (L), Ci = concentration of adsorbate before adsorption (mg L-1), Ce = concentration after adsorption (mg L-1) and M = mass of the adsorbent used (g).
2.3. Adsorption Isotherm
Langmuir, Freundlich and Temkins equations were employed to study the adsorption isotherms of the dye.
2.3.1. Langmuir Isotherm Model
When the Langmuir equation was linearized, Equation 3 was obtained
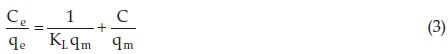
where Ce represents the equilibrium concentration of methy-lene blue (mg L-1), qe is the equilibrium quantity of methylene blue adsorbed onto the adsorbent (mg g-1), qm represents the monolayer maximum adsorption capacity of adsorbent (mg g-1) and Kl is the Langmuir adsorption constant (L mg-1).11
2.3.2. Freundlich Isotherm Model
This linearized equation can be expressed in term of a logarithmic form as follows:

When the log Q is plotted against log P the slope of 1/n and an intercept of log Kf were obtained. Hence, from the intercept and slope of the linear plot, Kf and n can be calculated.
2.3.3. Temkin Isotherm Model
The assumption of this model is based on heat of adsorption
(function of temperature) in which all layers of the molecules would decrease linearly when the lowest and largest value of concentration is ignored.12

where AT represents the Temkin equilibrium binding constant (L g-1), and B and kf are the constants of the Temkin isotherm. B = RT/b and T represents temperature (K).
2.4. Adsorption Kinetics
The sorption kinetics describes the rate at which the solute is taken up by the adsorbent, which in turn controls the time of sorption to take place. It is an important characteristic used to express the power of adsorption.13
In this study, the kinetics liquid phase sorption of methylene blue onto activated carbon from moringa pod husk (AMP) was tested with different adsorption kinetics models, including Lagergren pseudo-first-order and pseudo-second-order equations.
2.4.1. Pseudo-First-Order Equation
This model of adsorption kinetics and can be expressed by the following equations.
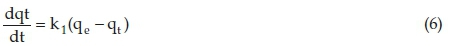
where qe and qt are the adsorption quantity at equilibrium and time t, respectively (mg g-1), and k1 is the adsorption pseudo-first-order rate constant (min-1).
By integrating Equation 6 where boundaryt=0tot=tand qt = 0 and qt = qe was applied, the integrated form becomes:

When log (qe-qt) against t was plotted, a linear relationship graph was obtained, and constant k1 and qe can be determined from slope and intercept, respectively.14
2.4.2. Pseudo-Second-Order Kinetics Equation
This adsorption kinetic rate equation can be expressed as:
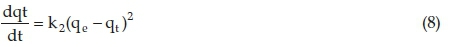
k2 is the pseudo-second-order adsorption rate constant (g mg-1 min-1).
The linear form of Equation 8 can be written as follows:
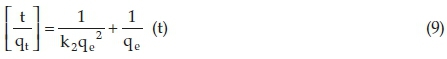
From the linearity plot of (t/qt) against t, the k2 and qe can be determined from the slope and intercept, respectively.
2.5. Thermodynamic Studies
The importance of thermodynamics in spontaneity and heat change of the adsorption route and parameters can be assessed through such parameters as free energy, enthalpy and entropy and the relationship which were calculated using the following equations.15
where R represents the universal gas constant (8.314 J mol-1 K-1) and T represents the temperature (K). The change in enthalpy ΔΗ0 and the change in the degree of disorderliness AS0 can be calculated from the slope and intercept of the plot.
3. Results and Discussion
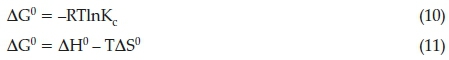
The result of the physicochemical characterization are presented in Table 1. The result of moisture content obtained could not have effect on the quantity of activated carbon adsorbed but apparently dilutes the carbon.16 The ash content obtained in this study for AMP (2.61 %) is higher compared to those reported by Sivakumar el aí.17(2.39 %). It was attributed to lower inorganic content and high fixed carbon.18 Bulk density indicates the fibre content of the precursor. It was shown that the bulk density obtained for AMP (0.64) is almost the same by those obtained from Marlynia annua L. by Sivakumar el aí.17(0.63).
Iodine number (mg g-1) and surface area (m2 g -1) of 935 and 1340.234 was observed, respectively, with higher values than those reported for Hemidesmus indicus by Srihari and Ashutosh19, base-treated and carbonized rice husks by Wuana el aí.,20 banana empty fruit bunch and Deíonix regia fruit pod by Sugumaran el aí.21 The iodine number gives an idea of the total surface area of an adsorbent. It has been reported that adsorbents with high iodine number/surface area perform better in the removal of small-sized contaminants.22 The point of zero charge (pHZPC)of AMP was obtained at 7.2. This implies that the prepared carbon is free from surface charges near neutral pH. Hence the carbon sample is suitable for the treatment of water even at the neutral medium.12
3.1.1. Fourier Transform Infra Red Spectroscopy
FTIR analysis was carried out in order to identify the different functional groups present in the adsorbent which may possibly be responsible for adsorption process. From the FTIR spectra shown in Fig. 1a, AMP shows a very broad peak at 3392.08 cm-1 which may be attributed to OH group stretching suitable for inter- and intra-molecular hydrogen bonding of polymeric compounds such as carboxylic acids, alcohols or phenols as in hemicellulose, cellulose and lignin.23 The peak observed at 2920.3 cm-1 may be attributed to C-H of sp3. The band at 1701.32 cm-1 may be attributed to C=O stretching of carbonyl group and also the band at 1606.33 cm-1 C=C stretching of alkene. After the adsorption experiments, there were obvious absorption band shifts from the spectral of the loaded adsorbent compared to the freshly prepared adsorbent. The absorption bands at 3382.59 cm-1 may be assigned to OH group stretching. Also, the band at 2923.48 cm-1 may be assigned to C-H of sp3. The band at 1694.99 cm-1 may be attributed to the C=O of carbonyl group as shown in Fig. 1b.
3.1.2. BET Analysis
The BET analysis was carried to establish the surface area of the adsorbent. Different BET methods that are used for the analysis are Multi-point Bet method and the surface area observed was 1432.923 m2 g -1. The micro-pore volume of 0.047 cc g-1 was obtained by the T plot method, micro-pore area of 92.689 m2 g-1 and external surface area of 1340.234 m2 g -1. The average half-width, adsorption energy, micro-pore volume and micro-pore surface area of AMP are given by DR method to be 14.827Â, 8.768 KJ mol-1, 0.735 cc g-1 and 2067.371 m2 g-1, respectively.
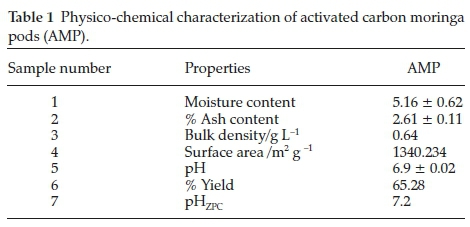
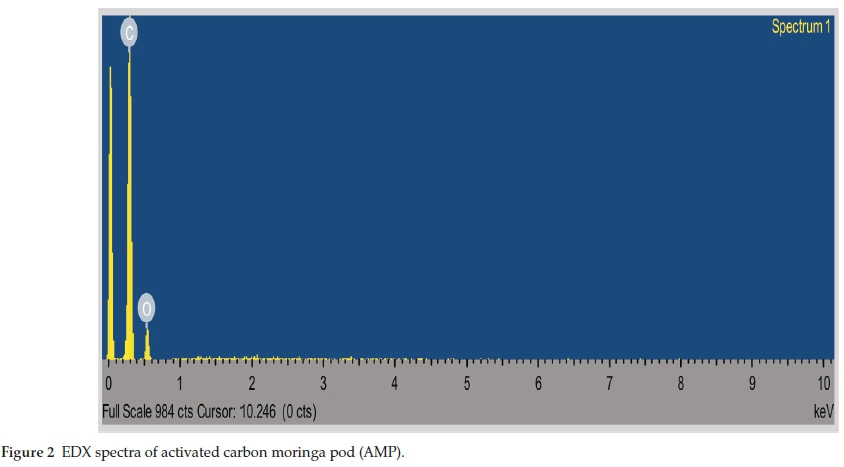
3.1.3. Energy Dispersive X- Ray (EDX)
The EDX analysis gives a semi-quantitative analysis of the adsorbent. The EDX spectrum is shown in Fig. 2 and the percentage load of the element in each adsorbent is embodied in Table 2.
3.1.4. Scanning Electron Microsocopy
A surface morphology of activated carbon moringa pod (AMP) shown in Fig. 3a and Fig. 3b was carried out at different magnifications. The micrographs of the designated sample show the occurrence of irregular and highly porous surfaces. The existence of highly porous surface may be suitable for the evaporation of the activating agent (H3PO4) used in the production of the activated carbon.24
3.2. Adsorption Experiment Results
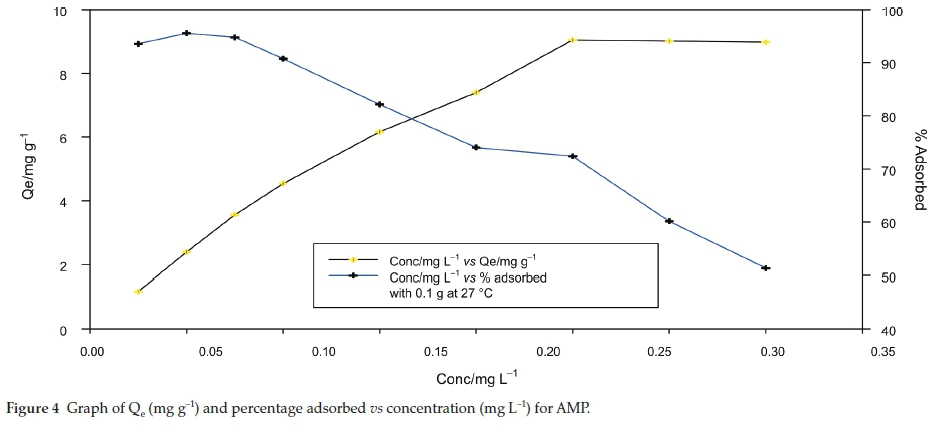
3.2.1. Effect of Initial Adsorbate Concentration
This is one of the vital parameter to be determined as it enables us to know the optimum concentration at which the methylene blue could be adsorbed from aqueous medium. This effect was done as the solution concentration was varied between 5-80 mg L-1 keeping parameters such as adsorbent dose, pH, time and temperature constant. Fig. 4 represents the graph of effect of initial concentration. A noticeable boost in the adsorption capacity from 1.1695 mg g-1 to 9.0466 mg g-1 was observed until there was no any considerable alteration in the adsorption capacity. The highest percentage (93.5593 %) of dye removed was observed at 5 mg L-1 and the least percentage (51.3075 %) was observed at 70 mg L-1 in that order. This decline in the corresponding increment with adsorbate could be traced to the fact that the available pore volume of the adsorbents had been occupied thereby reducing the interaction between the adsorbents and the subsequent dye intake.
3.2.2. Effect of Adsorbent Dose
This is one of the crucial parameters which established the capability of an adsorbent for a specified concentration of methylene blue solution. From Fig. 5 it can be shown that the increases in the quantity adsorbed can be evidenced by the decrease in the mass of the adsorbent This alteration can be elucidated on the basis on the mass balance relationship in Equation 2 which shows that mass of adsorbent is inversely proportional to the adsorption capacity.25
A gradual boost in the percentage adsorbed also occurred as the adsorbent dose increases after which an additional increase in the adsorbent dose does not have impact on the dye removal. It has been reported elsewhere that as the adsorbent dose increases, the movement of dye ions to the energetic adsorption sites will be restricted as well, hence reduced the adsorption efficiency.26
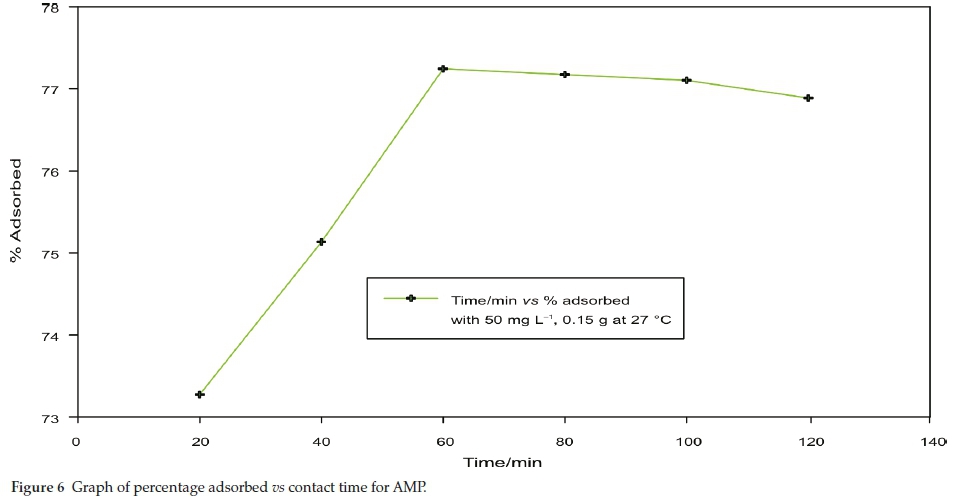
3.2.3. Effect of Contact Time
The role of contact time in the adsorption system is very essential irrespective of the other experimental parameters affecting the adsorption kinetics.27 The graph of the effect is represented in Fig. 6. In this study, it was observed that 60 min agitation time was sufficient to reach equilibrium which shows the highest percentage of adsorption unto the adsorbent.
There is an increase in the adsorption percentage of methylene blue from 73.2 to 77.2 % for the first hour, but after some time, there was no considerable transformation as the constant percentage removal tends to be observed despite an improvement in the contact time. The reduction in the percentage dye removal en route towards the end of experiment signifies the feasible monolayer of the adsorbate on the external surface and pores of the adsorbent. This causes pore diffusion onto interior surface of the adsorbent particle.27 Million et aí.22reported similar observation for the sorption capacity of methylene blue from aqueous solution onto untreated Parthenium hystrophorous weed.
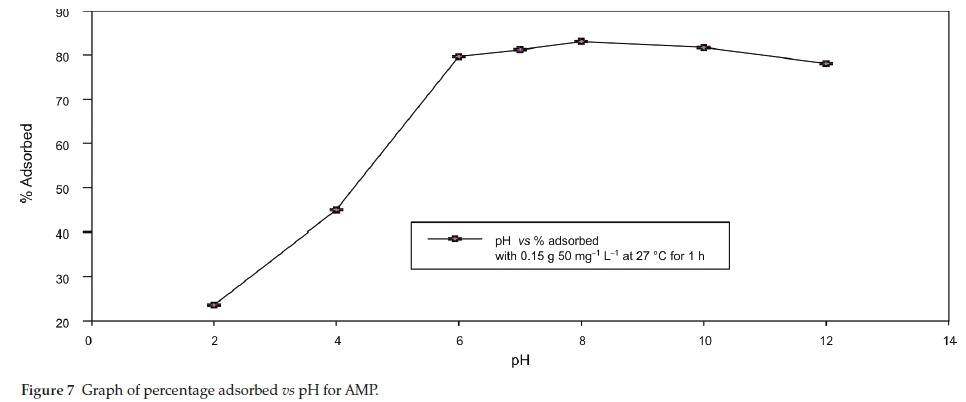
3.2.4. Effect of pH
The influence of initial pH on adsorption percentage of MB dye was examined over a range of pH values from 2 to 12 and the graph is shown in Fig. 7. At low pH, there is an increase in the percentage of removal indicating that the adsorbent showed good adsorption competence in the acidic medium than in the basic medium. This is because it was observed that towards the end of the experiment and after the pH 8 point, the percentage dye removed tends to decrease gradually for the adsorbent AMP. Incremental dye removal was not noticed beyond pH 8 and was selected forfurtherstudies. The findingobtainedinthis studyis inline withthe workreportedondye removalfromtex-tile wastewater using orange peels.26
3.2.5. Effect of Temperature
It was observed from the experiment that an increase in the temperature apparently increases the removal percentage of methylene blue. As the temperature increases from 30 °C to 55 °C, there is an increase in the quantity adsorbed from 86.47 to 88.05 % (Fig. 8). This may be as a result of increase in the mobility oflargedyeionwithtemperature. Anincreasingnumberofmol-ecules may also acquire sufficient energy to undergo an interaction with active sites on the surface of the adsorbent. This study was in agreement with some work reported by Hashem and Amin29 on the adsorption of methylene blue by activated carbon derived from various fruit peels.
3.3. Adsorption Isotherm
Several models have been reported by different researchers to show equilibrium relationships between sorbent and sorbate. The most commonly-employed models are the Langmuir and Freundlich adsorption models. In this study, to describe the relationship between the amount of methylene blue and its equilibrium concentrations, both models were employed.
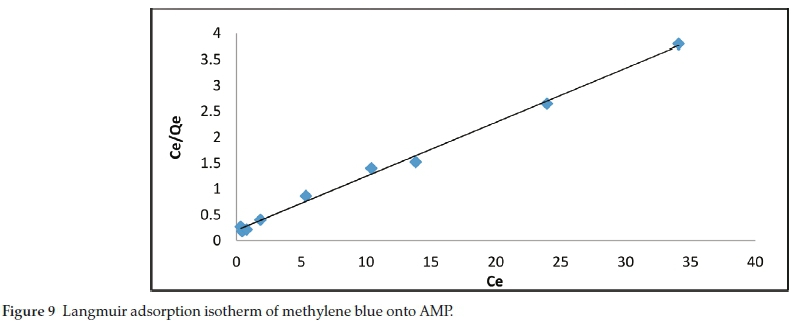
3.3.1. Langmuir Isotherm
The graph of the Langmuir adsorption is plotted in Fig. 9. It can be shown from the isotherm parameters (Table 3), that the adsorption efficiency of methylene blue from aqueous medium onto AMP is favourable as the RL value obtained is less than 1 and the adsorption data fitted well into Langmuir isotherm as the R2 value obtained for AMP is 0.9958.
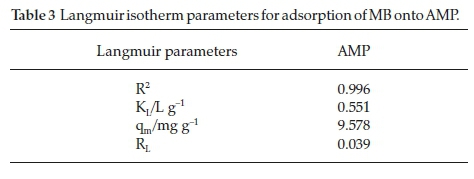
In comparison, the RLvalue (0.0391) obtained for AMP is lower than those reported by Inyinbor et aí.30 (0.19) in the 'Kinetics, isotherms and thermodynamic modelling of liquid phase adsorption of Rhodamine B. dye onto Raphia hookerie fruit epicarp' and Dada et aí.31(0.133) in the 'Langmuir, Freundlich, Temkin and Dubinin - Radushkevich isotherms studies of equilibrium sorption of Zn2 + onto phosphoric acid modified rice husk'
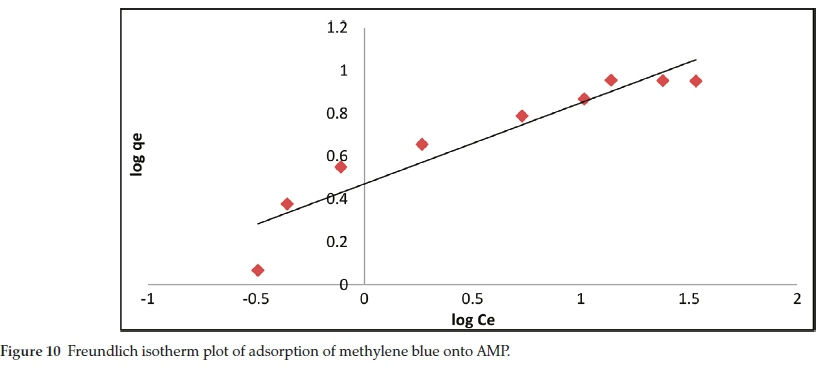
3.3.2. Freundlich Isotherm
In this study, the values obtained for Kf,R2 and n are 2.960, 0.8858 and 2.6385, respectively, as shown in Table 4. The slope from the Freundlich plot ranges between 0 and 1 adsorption intensity or surface heterogeneity (Fig. 10). The heterogeneity increases as the values get closer to zero. A value below unity implies chemisorptions process as reported by Haghseresht and Lu32. Whereas the Kf and n values obtained in this study are higher than the ones obtained by Sachin and Gaikwad33 (0.071
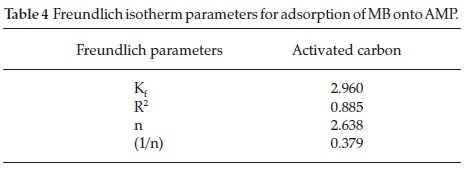
and 0.9).
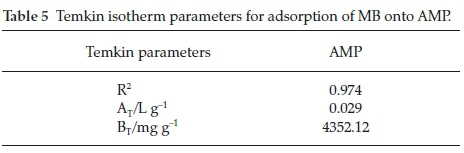
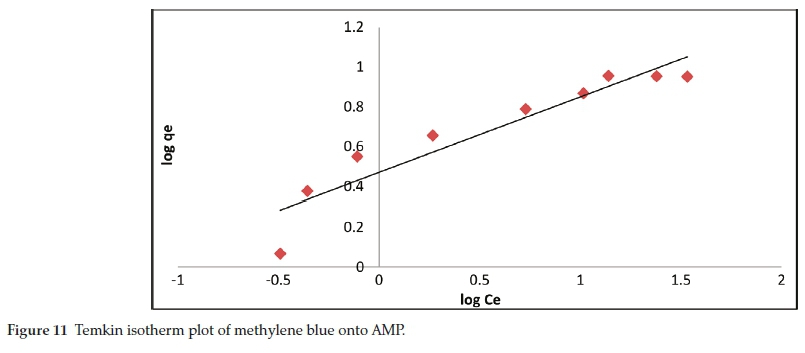
3.3.3. Temkins Isotherm Model
In this model, the value of correlation coefficient R2 obtained was establish to be 0.974 and Temkin isotherm constant BT obtained is 4352.12 (Table 5; Fig. 11), which is related to heat of sorption, indicating physicochemical nature of the sorption process.
3.4. Adsorption Kinetics
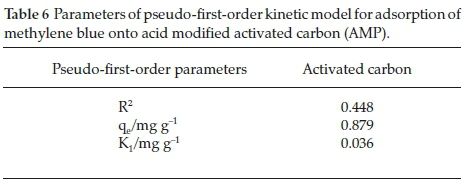
3.4.1. Pseudo-First-Order Kinetic Model
From the kinetic plot (Fig. 12) and Table 6, it can be deduced that the adsorption process did not fit well into pseudo-first-order as the R2 value (0.4489) obtained is very low compared to the other adsorption kinetic models.
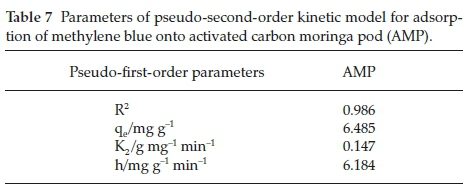
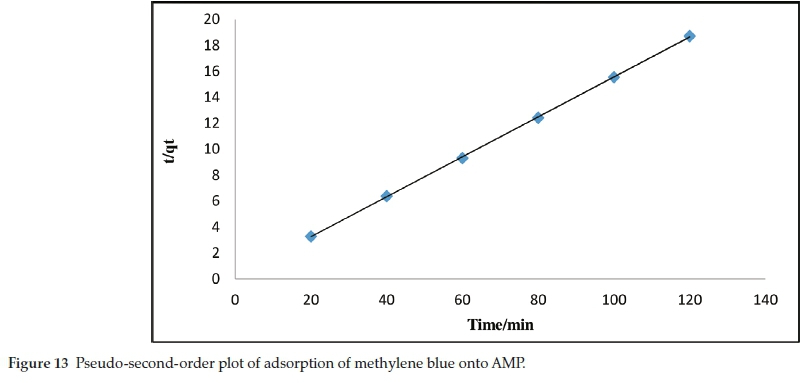
3.4.2. Pseudo-Second-Order Kinetic Model
It was revealed in Fig. 13 and Table 7, that the adsorption process followed pseudo-second-order kinetic model as the R2 value obtained is 0.999. Similar observations have been reported in the adsorption of methylene blue onto dehydrated wheat bran carbon by Özer and Dursun,34 and also in experimental study of methylene blue adsorption from aqueous solutions onto carbon nano tubes by Shahryari et aí.35
3.5. Thermodynamic Studies
The thermodynamic plots are shown in Fig. 14, and the values obtained for AG0, AS0 and AH0 at 313 K are - 0.295 KJ mol-1, 0.0158 KJ mol-1 and 4.648 KJ mol-1, respectively, as shown in Table 8. It is clear that reaction is spontaneous in nature as AG0 values for methylene blue onto AMP is negative for a spontaneous process under the applied conditions. The decrease in AG0 (i.e increase negative) values with increase in temperature indicated more efficient adsorption at higher temperature. This is because at higher temperature, ions are easily desolvated and therefore their adsorption becomes more favourable.36-37
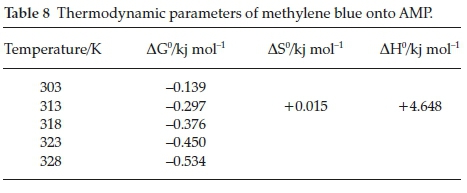
A positive AH0 and AS0 values confirmed that the adsorption processes were endothermic and showed the increase in the degree of randomness during the adsorption process. This type of adsorption can be explained in terms of the magnitude of AH0. The heat evolved during physisorption generally lies in the range of 2.1-20.9 KJ mol-1, while the heat of chemisorption falls into a range of 80-200 KJ mol-1.38 The adsorption of methylene blue onto AMP may be attributed to a physical adsorption process.
4. Conclusion
This study shows that the adsorption capacity of adsorbent can actually be affected by initial concentration of the adsorbate, adsorbent dose, contact time and temperature. Also, the percentage removal of MB increases with the increase in initial concentration, adsorbent dosage, contact time and temperature. Hence, activated carbon moringa pod (AMP) is a potential adsorbent that can remove colourants from wastewater through an adsorption process, i.e. physisorption. From this study, it is, therefore, demonstrated that adsorbents produced from low cost agricultural materials (moringa pod husk) can be used effectively to remove colourants from wastewater.
References
1 Z. Shengli, W. Zhikai, Z. Yulei, P. Hongyu and T. Lichun, Adsorption of methylene blue on organosolv lignin from rice straw, Procedia Environ. Sci., 2016, 31, 3-11. [ Links ]
2 P. Tarapitakcheevin, P. Weerayutsil and K. Khuanmar, Adsorption of acid dye on activated carbon prepared from water hyacinth by sodium chloride activation, Ind. Eng. Chem. Fund., 2013, 7, 83-90. [ Links ]
3 K. Kadirvelu, M. Kavipriya, C. Karthika, M. Radhika, N. Vennilamani and S.Pattabhi, Utilization of various agricultural wastes for activated carbon preparation and application for the removal of dyes and metal ions from aqueous solutions, J. Biores. Technol., 2003, 87, 129-132. [ Links ]
4 P. Pandit and S. Basu, Removal of ionic dyes from water by solvent extraction using reverse micelles, J. Am. Chem. Soc., 2004, 38(8), 2435-2442. [ Links ]
5 N.R. Nicomel, K. Leus, K. Folens, P. Van Der Voort and G.D. Laing Technologies for arsenic removal from water: current status and future perspectives, Int. J. Environ. Res. Public Health, 2016, 13, 62, 1-24. [ Links ]
6 K.S. Bharathi and S.T. Ramesh, Removal of dyes using agricultural waste as low cost adsorbents, Appl. Water Sci., 2013, 3, 773-790. [ Links ]
7 C. Song, S. Wu, M. Cheng, P. Tao, M. Shao, G. and Gao, Adsorption studies of coconut shell carbons prepared by KOH activation for removal of lead (II) from aqueous solutions, Sustainability, 2014, 6(1), 86-98. [ Links ]
8 Z. Ying, R. Zheng, Z. Jiaying, M. Fang, Z. Yinchao and M. Qingjuan, Characterization of H3PO4 treated rice husk adsorbent and adsorption of copper (II) from aqueous solution, BioMed. Res. Int., 2014,1-8. [ Links ]
9 O. Abdelwahab and N.K.Amin, Adsorption of phenol from aqueous solutions by Luffa cylindrica fibers: kinetics, isotherm and thermody-namic studies. Egypt. J. Aquat, Res., 2013, 39(4), 215-223. [ Links ]
10 O.S. Bello, K.A. Adegoke and O.O. Akinyunni, Preparation and characterization of a novel adsorbent from Moringa oleifera leaf, Appl. Water Sci., 2015, 1-11. [ Links ]
11 K.Y. Foo and B.H. Hameed, Insights into the modelling of adsorption isotherm systems, Chem. Eng. J., 2010, 156, 2-10. [ Links ]
12 C. Aharoni and M. Ungarish, Kinetics of activated chemisorption. Part 2, Theoretical models, J. Chem. Soc. Faraday Trans., 1977, 73, 456-464. [ Links ]
13 M. Hema, M. and S. Arivoli, Studies on adsorption efficiency and kinetics of dye removal from textile effluent using some natural bio-adsorbent, Int. J. Phys. Sci., 2007, 2(1), 010-017. [ Links ]
14 E.S. Abechi, C.E. Gimba, A. Uzairu and J.A. Kagbu, Kinetics of adsorption of methylene blue onto activated carbon prepared from palm kernel shell, Arch. Appl. Sci. Res., 2011, 3(1), 154-164. [ Links ]
15 S. Qaiser, R.S. Anwar and U. Muhammad, Biosorption of lead(II) and chromium(VI) on groundnut hull: equilibrium, kinetics and thermodynamics study. Elect. J. Biotech., 2009, 12, 4, 0717-3458. [ Links ]
16 P.C. Madu and L. Lajide, Physicochemical characteristics of activated carbon derived from melon seedhusk, J. Chem. Pharm. Res. 2013,5(5), 94-98. [ Links ]
17 B. Sivakumar, C. Kannan and S. Karthikeyan, Preparation and characterization of activated carbon prepared from Balsamodendron caudatum wood waste through various activation processes, Rasayan J. Chem., 2012, 5(3): 321-327. [ Links ]
18 A. Shukla, Y.H. Zhang, P. Dubey and S.S. Shukla, The role of saw dust in the removal of unwanted materials from water, J. Hazard. Mater., 2002, 95(12), 137-152. [ Links ]
19 V. Srihari and D. Ashutosh, Adsorption of phenol from aqueous media by an agro waste Hemidesmus indicus based activated carbon, Appl. Ecol. Environ. Res., 2009, 7(1), 13-23. [ Links ]
20 R.A. Wuana, L. Leke, D.A. Okibe and M. Okei, Aqueous phase adsorption of Cu (II) and Co (II) ions from single and bisolute solutions onto base-treated and carbonized rice husks, Niger. J. Appl. Sci., 2009, 27, 129-136. [ Links ]
21 P. Sugumaran, V.P. Susan, P. Ravichandran and S. Seshadri, Production and characterization of activated carbon from banana empty fruit bunch and Delonix regia fruit pod, J. Sustain. Energy Environ., 2012, 3, 125-132. [ Links ]
22. G.B. Adebayo, H.I. Adegoke, W. Jamiu, B.B. Balogun and A.A. Jimoh, Adsorption of Mn(II) and Co(II) ions from aqueous solution using maize cob activated carbon: kinetics and thermodynamics studies, J. Appl. Sci. Environ. Manage., 2015,19(4), 734-748. [ Links ]
23 B. Kannamba, K.L. Reddy, B.V. AppaRao, Removal of Cu(II) from aqueous solutions using chemically modified chitosan, J. Hazard. Mater., 2010, 175, 939-948. [ Links ]
24 H. Deng, G. Zhang, X. Xu, G. Tao and J. Dai, Optimization of preparation of activated carbon from cotton stalk by microwave assisted phosphoric acid - chemical activation, J. Hazard. Mater., 2010, 182, 217-224. [ Links ]
25 N.F. Cardoso, E.C. Lima, I.S. Pinto, C.V. Amavisca, B. Royer, R.B. Pinto, W.S. Alencar and S.F.P. Pereira, Application of cupuassu shell as biosorbent for the removal of textile dyes from aqueous solution. J. Environ. Manage., 2011, 92, 1237-1247. [ Links ]
26 F.B. Abdur Rahman, M. Akter and A.M. Zainal, Dyes removal from textile wastewater using orange peels, Int. J. Sci. Technol. Res., 2013, 2, 47-50. [ Links ]
27 R.M. Nageswara, R.Y. Hanumantha, C. Chakrapani, B.C. Suresh, R.B.V Rajeswara, P. Haritha and R.K. Somasekhara, Adsorption studies of methylene blue dye using prepared low-cost activated Kaza's carbons, J. Chem. Pharm. Res., 2011, 3(5), 363-375. [ Links ]
28 M. Million and L. Belisti, Removal of methylene blue (Mb) dye from aqueous solution by bioadsorption onto untreated Parthenium hystrophorous weed, Mod. Chem. appl, 2014, 2, 4. [ Links ]
29 F.S. Hashem and M.S. Amin, Adsorption of methylene blue by activated carbon derived from various fruit peels, Desalin. Water Treat., 2016, 57, 47, 22573-22584. [ Links ]
30 A.A. Inyinbor, F.A. Adekola and G.A. Olatunji, Kinetics, isotherms and thermodynamic modelling of liquid phase adsorption of Rhodamine B dye onto Raphia hookerie fruit epicarp, Water Res. Ind., 15, 14-27. [ Links ]
31 A.O. Dada, A.P. Olalekan, A.M. Olatunya and O. Dada, Langmuir, Freundlich, Temkin and Dubinin-Radushkevich isotherms studies of equilibrium sorption of Zn2+ unto phosphoric acid modified rice husk, IOSR J. Appl. Chem., 2012, 3(1), 38-45. [ Links ]
32 F. Haghseresht and G. Lu, Adsorption characteristics of phenolic compounds onto coal reject-derived adsorbents, Energy Fuels, 1988, 12, 1100-1107. [ Links ]
33 M.K. Sachin and R.W. Gaikwad, Removal of zinc ions from industrial effluent by using cork powder as adsorbent, Int. J. Chem. Eng., Appl. 2011, 2, 3. [ Links ]
34 A. Özer and G. Dursun, Removal of methylene blue from aqueous solution by dehydrated wheat bran carbon., J. Hazard. Mater., 2007, 146, 262-269. [ Links ]
35 Z. Shahryari, S.G. Ataallah and A. Mehdi, Experimental study of methylene blue adsorption from aqueous solutions onto carbon nanotubes, Int. J. Water Res. Environ. Eng., 2010, 2(2), 016-028. [ Links ]
36 C. Chen and X. Wang, Adsorption of Ni2+ from aqueous solution using oxidized multi-wall carbon nanotubes, Ind. Eng. Chem. Res., 2006, 45, 9144-9149. [ Links ]
37 J.A. Hefne, W.K. Mekhemer, N.M. Alandis, O.A. Aldayel and T. Alajyan, Kinetic and thermodynamic study of the sorption of Pb2+ from aqueous solution to the natural and treated bentonite, Int. J. Phys. Sci., 2008, 3, 11, 281-288. [ Links ]
38 Z.A. AL-Anber and M.A. AL-Anber, Thermodynamics and kinetic studies of iron(III) adsorption by olive cake in a batch system, J. Mex. Chem, Soc., 2011, 52, 2, 108-115. [ Links ]
Received 24 December 2018
Revised 1 July 2019
Accepted 7 October 2019
* To whom correspondence should be addressed. E-mail: hkoadeola@gmail.com / okoro.hk@unilorin.edu.ng

