


Services on Demand
Article
 English (pdf)
 Article in xml format
 Article references
Indicators

Related links
-
 Cited by Google
 -
 Similars in Google
Share

 Permalink
South African Journal of Chemistry
On-line version ISSN 1996-840X
Print version ISSN 0379-4350
S.Afr.j.chem. (Online) vol.72 Durban 2019
http://dx.doi.org/10.17159/0379-4350/2019/v72a24
RESEARCH ARTICLE
Kinetic Approach to Determine 3-Amino Methyl Hexanoic Acid in Pharmaceutical Formulations
Farhan Ahmad SiddiquiI, *; Nawab SherII; Asia NazIII; Najmul HasanIV; Shabana Naz ShahV; Muhamad ShehzadVI
IFaculty of Pharmacy, Federal Urdu University Arts Science and Technology, Karachi-75300, Pakistan
IIDepartment of Chemistry, University of Karachi, Karachi-75270, Pakistan
IIIDepartment of Pharmaceutical Chemistry, University of Karachi, Karachi-75270, Pakistan
IVDepartment of Environmental Sciences and Biotechnology, Hallym University, Chuncheon, Gangwon-do 24252, Republic of Korea
VFaculty of Pharmacy, Shaheed Benazir Bhutto Dewan University, Karachi-74900, Pakistan
VIDepartment of Pharmacognosy, University of Karachi, Karachi-75270, Pakistan
ABSTRACT
A simple and sensitive colorimetric spectrophotometric method based on application of chemical kinetics was produced and developed for the quantitative determination of 3-amino methyl hexanoic acid (pregabalin) in bulk and pharmaceutical preparations. Ninhydrin, a chromogenic agent was reacted with pregabalin at 70 °C and the absorbance was measured at 575 nm and kinetic correlation was evaluated between absorbance and time. The initial-rate, rate-constant and fixed-time (80 min) methods were employed for the estimation of pregabalin in the range of 10-30ug mL-1 which showed good correlation >0.9990 in all three cases with LOQ values ranging from 1.2-1.5 mL-1and LOD values ranging from 0.76-0.95 mL-1. Method validation was carried out using ICH recommendations and the variables were evaluated and optimized. The newly developed method has useful applications to determine pregabalin in pharmaceutical formulation with good recovery (98.38 to 102.12 %t) and precision (RSD < 1.4 %). Standard free energy changes and association constant were found to be 1.212 X 10³ and -4.747, respectively, as determined by the Benesi-Hildebrand equation.
Keywords: Colorimetric determination, pregabalin, ninhydrin, charge transfer complex.
1. Introduction
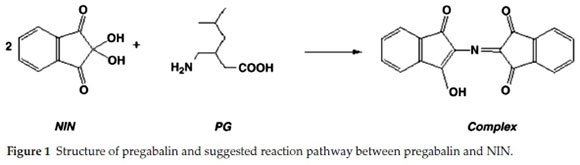
Pregabalin is chemically defined as 3-amino methyl hexanoic acid, having chemical formula C8H17NO2 (Fig. 1). It is a structural and pharmacological analogue of the mammalian neurotrans-mitter gammaamino butyric acid (GABA). It is a white crystalline solid containingboth acid and base function, i.e. zwitter ion. So it is soluble in water, both in basic and acidic range. Pregabalin is mainly used as a anticonvulsant drug, though its effects are much broader, as it is used for psychiatric diseases, treatment of partial seizures in adults, epilepsy, neuropathic pain and diabetic europathy. In addition, pregabalin has been prescribed in other physiological complications including inflammation, gastrointestinal damage, alcoholism and insomnia.1-4
Pregabalin is an established α-2-δ potential ligand, therefore it binds to the α-2-δ subunit calcium channel receptors in the brain. Neurons are activated to decrease calcium influx at nerve ending, and hence reducing the release of several neuro-transmitters such as noradrenalin and dopamine," which subsequently results in the above-mentioned activities. However, the exact mechanism of action is unknown.
Ninhydrin (NIN) attained widespread utility in quantitative determination of amino acids and proteins. Thus its importance in pharmaceutical, biomedical, forensic, food, nutritional and plant studies cannot be ignored.7-11 NIN has special application in the pharmaceutical industry by visualization of amino and azo group-containing compounds on TLC plates and in kinetic studies.12-14
A literature survey revealed that various analytical methods have been reported to quantify pregabalin, including spectro-photometery,15-19 specrtofluorimetery,20-21 high pressure liquid chromatography with UV detection,22-23 HPLC mass spectrome-try,24 HPLC with fluorescence detection25 and HPLC with pre-column26 and post-column27 derivatization.
Liquid chromatographic methods involve expansive equipment while spectrofluorimeters are not commonly available. Most of the available spectrometric methods in literatures are not highly sensitive or need comprehensive, complicated extractions procedures. Moreover, most of available methods are based on the absorbance in the near-UV region and thus specificity is questioned. Some of the methods in literature use reagents which do not produce linear response. Our endeavour was focused on development of an economical, rapid and sensitive analytical method for quantitative determination of pregabalin in pharmaceutical formulation and reference material involving kinetic approach.
Present study describes highly simple, sensitive and precise colorimetric spectrophotometric methods compared to the conventional existing spectrophotometric and expansive HPLC methods. The suggested methods involve reaction of NIN with amino group of PG developing purple colour complex called Ruhemann's purple (Fig. 1).14
The proposed method relies on simple and low-cost technique but it is sensitive enough to be reasonably compared to sophisticated and expensive techniques such as HPLC. ICH guideline was followed for various experiments to validate the methods.28 The proposed spectrophotmetrically monitoring kinetic approaches for determining pregabalin in pharmaceuticalcapsule and bulk material, using NIN as a reagent, is highly advantageous. It simply requires heating of reaction mixture and cooling. Conditions of reaction were optimized and applications of the proposed methods were established. Thermody-namic features like association constant (Kc) and the standard free energy changes (∆G°) of the complex formed were investigated, in addition to stoichiometric composition of the complex.
2. Experimental
2.1. Instruments
UV-visible spectrophotometer of Shimadzu Corporation, Japan model number 1601 was used in this study. Spectrophotometer is double-beam-based with slit width of 2 nm while cell made of quartz with path length of 10 mm, controlled and run through UVPC version 3.9 software.
2.2. Chemicals and Reagents
Analytical grade reagents were used in this study. Pregabalin pure drug was kind gift of a national pharmaceutical company. Syngab® capsules 200 mg, 50 mg, 100 mg containing pregabalin were obtained from a local pharmacy. NIN was from Merck, Germany. Distilled and deionized water was used throughout this study.
2.3. General Procedure
2.3.1. Standard Stock Preparation
To prepare 100 mL-1 solution of pregabalinin water, 100 mg of it was transferred toa1L volumetric flask, dissolved in water, diluted to the mark level and stored in a dark, cool (below 25 °C) place.
2.3.2. Preparation of Ninhydrin Solution
1 g of ninhydrin was taken in a 100 mL volumetric flask and sufficient methanol was added to dissolve; after having completely dissolved, the volume was adjusted up to the mark with methanol. NIN solution was prepared on fresh basis.
2.3.3. Reaction Procedure
Solutions of about 100 mL-1 pregabalin were taken into heating tubes, to which 2 mL of 1 % NIN solution was added and heated in a water bath for 80 min. Reaction mixture was allowed to cool down to room temperature. The mixture was shifted to a 50 mL volumetric flask and was added up to the mark level with water. Absorbance was measured at 575 nm as a function of time against a blank treated similarly (spectra 1). Absorbance time curve slope derived from different concentrations of the drug, was used to calculate the initial rate of reaction. The calibration curves were designed by plotting (i) logarithm of initial rate of reaction versus logarithm of molar concentration, (ii) rate-constant versus final concentration and (iii) absorbance measured at a fixed time versus final concentration of pregabalin.14
2.3.4. Sample Preparation of Pharmaceutical Formulations
A homogenous bulk sample was obtained by weighing twenty capsules and mixing their contents. The capsule powder equivalent to 10 mg of pregabalin was taken in to a 100 mL volumetric flask, sufficient amount of water was added and sonicated for 10 min as well as stirred for 30 min to completely dissolve the active content. Water was added up to volume and reaction procedure described above was followed.
2.3.5. Stoichiometric Study
To evaluate the stoichiometric composition of the complex, Job's continuous variation method29 was used. Equimolar solution of both drug and reagent were prepared individually. Different complementary proportions of both solutions were reacted together in a series of 5 mL flasks. These complementary proportions were 0:5,1:4, 2:3...4:1 mL. complex was measured through absorbance at 575 nm after a due time against a reagent blank treated similarly.
Excipients Interference: Common excipients such as hydroxy-propyl methyl cellulose, magnesium stearate, talcum powder, pyrrolidone, glucose, and lactose were spiked with 50 mg of pregabalin and were determined as given under General Procedure.
3. Results and Discussion
Pregabalin does not possess prominent chromophore, therefore it is a very low UV absorbing molecule.17 Thus use of conventional UV spectrophotometric methods was out of question due to its poor sensitivity. For high sensitivity and specificity HPLC is usually used but due to low specific absorption, a high concentration has to be injection onto the column to get viable peak which would cause column deterioration. In literature, derivatization techniques (post and pre-column) are found but they are always laborious tasks. There is a critical need to develop a visible range spectrophotometric analytical method that can accurately quantitate pregabalin in pharmaceutical formulations, therefore the present work was designed.
3.1. Reaction with Ninhydrin (NIN)
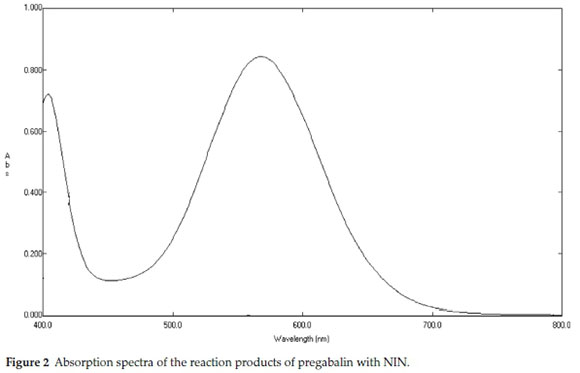
It has been found that introduction of an aromatic ring to molecule increases its UV response showing momentous increase in its absorbance; moreover, UV absorbance can be further increased by introduction of a nitrogen atom bearing a lone pair. Thus to achieve the increase in absorbance, pregabalin was reacted with NIN. NIN reagent is a recommendation for study of aliphatic primary amine or amino acids. Methanolic medium was provided for the interaction of pregabalin and NIN. The reaction takes place through an oxidation process of deamination of the amine which later on condenses with reduced NIN. A purple coloured complex results from this reaction which absorbs at 575 nm (λmax at 575 nm) as shown in Figs. 1 & 2.
Taking a hypothetical approach that various factors might interfere with the reaction, many factors were studied and it was found that temperature played a key role as the optimum colour was obtained on heating the reaction mixture at a temperature of 70±5°Cfor 80 min. Extended heating or heating at higher degrees resulted in decreased chromogenic intensity. In addition, the choice of best extracting solvent was tested by trying different solvents such as water, isopropanol, ethanol, methanol, dioxane, acetone and acetonitrile. Best results were found with methanol so it was used in subsequent analysis.
3.2. Kinetic Approach
3.2.1. Initial Rate Method
The kinetic parameters of proposed reactions were studied. For this purpose, a time curve graph of the slope of the initial tangent to the absorbance was used to determine the initial rate of reaction. In order to establish the order of reaction with respect to pregabalin, different concentrations of pregabalin were tried but the concentration of NIN was kept constant. A plot of Atf/Atf -Atversus time was obtained. A straight line was obtained that showed that the reaction is first order.
The order of reaction was also established with respect to NIN. Now the concentration of pregabalin was kept constant and that of NIN varied. The plot of log Atf/Atf -At against time was again a straight line which confirmed that it also involved first-order kinetics. For initial rate of reaction, the following equation applies:

where, k' is the rate constant, C is the concentration of pregabalin, and n represents the order of the reaction. Logarithmic form of the above equation is as follows:
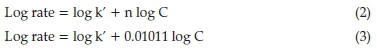
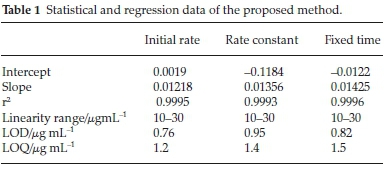
The regression equation gave rise to first-order reaction with respect to pregabalin. The concentration range was between 10 and 30 mL-1. A linear plot was obtained when absorbance of different concentrations were plotted against time. Statistical features like slope, intercept and correlation coefficient were calculated from the linear regression equation. Results are shown in Table 1.
3.2.2. Rate-constant Method
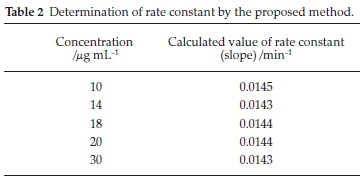
The rate constant method was used to determine different nominal concentrations of pregabalin by plotting the slopes of log Atf/Atf -At against time. Rate constant values were plotted against concentration to create a calibration curve and a linear response was obtained in the concentration range 10-30 mL-1. Table 2 gives details of the data.
3.2.3. Fixed Time Method
Fixed time assay method was carried out for pregabalin at pre-selected time. A plot of absorbance vs concentration was constructed at fixed times of 20, 40, 60 and 80 min. Regression equations were developed and related analytical parameters were calculated. These parameters were in accordance with acceptable limits. Experimental results detailed in Table 3 suggest that any of the outlined fixed time methods can be used for the assay of pregabalin.
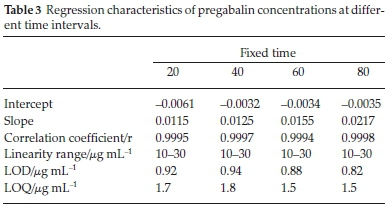
Evaluating the regression equations, good linearity was exhibited by obtaining correlation coefficients of more than 0.999. Excellent sensitivity of the method is obvious from low limit of detection and quantification values and the low value of the standard deviation indicated good precision. Pharmaceutical samples were assessed with these projected methods over a range of concentrations and results obtained in Table 4 suggest excellent accuracy of the method.
3.3. Stoichiometry of the Reaction
Job's method of continuous variation was employed to find out the molar ratio of pregabalin with NIN17,29 was used. The ratio found through method was 1:2 for NIN.
3.4. Determination of Association Constants
Benesi-Hildebrand equation30 was used to know about the association constants of the complex produced as a result of the interaction of pregabalin with NIN using 1.212 x 10³.

where Kc is the association constant, ε is the molar absorptivity and A is the absorbance of the complex. Ca and Cb are the concentrations of the acceptor and donor, respectively.
3.5. Determination of Standard Free Energy Changes
A plot of Ca versus A in Eq. 4 produced a straight line. The following equation was used to determine free energy changes (AG°= -4.747) associated with the complex which shows that the complex is fairly stable.

where ∆G° is the standard free energy change of the complex (kJ mol-1), Kc is the association constant of drug-acceptor complexes (1 mol-1), T the temperature in Kelvin (273+ °C), and R the gas constant (1.987 cal mol-1 deg-1).
3.6. Method Validation
The developed colorimetric analytical methods were validated for linearity, accuracy and precision. Calibration curves were obtained by plotting absorbance against concentration and Beer's law was obeyed in the given range. Beer's law plots were found to be linear for all the studied cases and the intercepts found for them were very small (Tables 1, 2 & 3). The values of slopes ranged from 0.01218-0.01425 while the correlation coefficient was always more than 0.9990. The limit of detection LOD and limit of quantification LOQ values for pregabalin with NIN were calculated. The cross-check was performed from theoretically calculated LOD and LOQ values by experimentally verifying these concentrations using newly developed methods. LOQ values ranging from 1.2-1.5 mL-1 and LOD values ranging from 0.76-0.95 mL-1 were calculated for the proposed methods.
In order to evaluate accuracy and precision, pregabalin was analyzed at five concentration levels; each was analyzed in replicate. Excellent accuracy is shown in Table 4 while low mean relative standard deviation (RSD) and the mean standard deviation (SD) values indicate satisfactory precision.
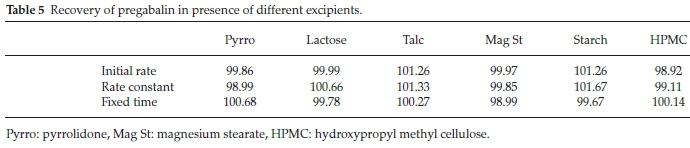
The effect of common adjutant and excipients were experimentally considered on the projected methods before applying these methods to the analysis of pharmaceutical preparations. Interference from these additives or degradation product of the parent molecules is possible which in turn depends upon donor acceptor affinities. Amine functionality in pregabalin render it highly effective for complexation with NIN compared to other additives and hence the method was found to be specific and selective for pregabalin in presence of excipients (Table 5).
3.7. Determination of PG in Dosage Forms
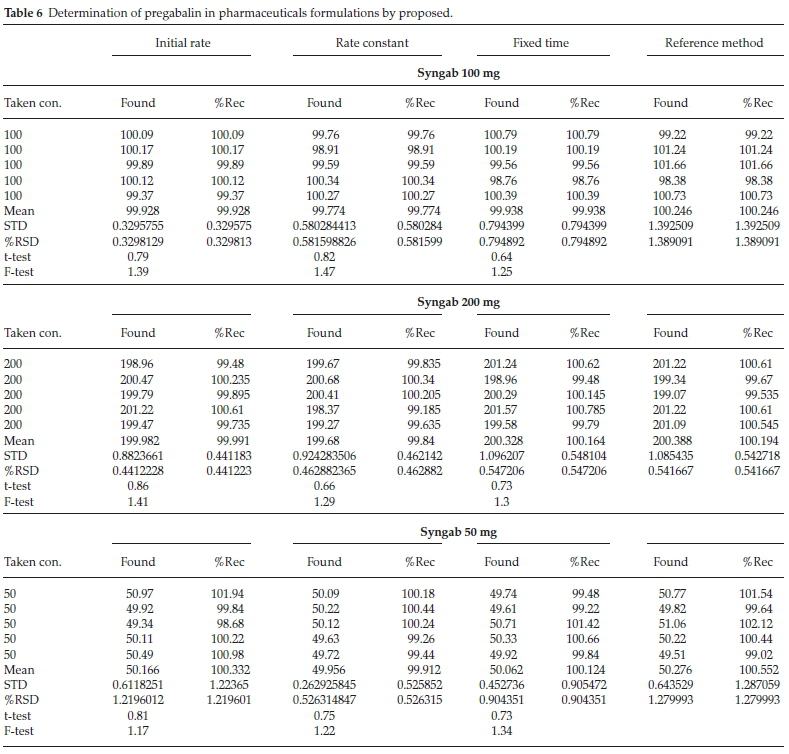
The newly developed methods were applied to determine pregabalin in pharmaceutical commercial products along with the reference method.23 Comparisons of the proposed methods were made to the reference method by employing t- and F-tests. There was no considerable difference between the developed method and the reference method at 95 % level of confidence. Data in Table 6 indicate that these procedures can be applied for quantitative determination of pregabalin in dosage form without interference. Percentage recoveries were found to be in the range of 98.38-102.12 %.
3.8. Spectroscopic Studies
3.8.1. Infrared Spectra
It was found from the IR spectra of pregabalin that a multiplet of peak is found in the region 2500-3000 cm-1 and the usual amine and carboxyl peaks at 3200-3400 cm-1 and 1710 cm-1, respectively, were absent. This can be attributed to the existence of zwitterions. It is further confirmed by the presence of asymmetric and symmetric peaks of carboxylate ion at 1600 and 1400 cm-1 as observed in amino acids31 along with NH3+ bending at 1550 cm-1. NIN spectra showed the presence of two OH groups by exhibiting two broad peaks at 3300 and 3250 cm-1 along with a stretching frequency at 1061 cm-1 owing to secondary alcohol C-O, carbonyl peaks in the region 1660-1760 cm-1 and aromatic frequency at 750 cm-1.
It is reported that NIN forms a complex called Ruhemann's purple with primary amines.20 Complex formation with pregabalin was confirmed by comparing the spectral data of NIN with complex. Doublet of the carbonyl changed into a singlet at 1680 cm-1 and the O-H stretching shifted to 3400 cm-1 which confirms the formation of complex between pregabalin and NIN.
3.8.2. Nuclear Magnetic Resonance Spectra
1H NMR spectra of pregabalin confirmed three -CH2 peaks at δ 2.443, δ 2.553 and δ 2.873 ppm and a multiplet for tertiary hydrogen at δ 1.365 ppm. Zwitterion was confirmed from the absence of NH2 peak near δ 2 ppm and that of carboxylic OH near δ 11; instead a peak at 4.849 δ ppm attributing to NH3+ was observed. NIN exhibited two singlets at δ 7.240 and δ 7.448 ppm due to four aromatic protons along with a singlet at δ 1.52 ppm for two OH protons. 1H-NMR of the complex indicated a singlet at δ 4.803 ppm representing enolic proton and amine protons (NH2) completely diminished. The experimental results coincide with the reported ones. The 1H-NMR spectra in association with UV-VIS and IR confirmed the structure of the complex.
4. Conclusion
This endeavor produced simple, low cost, sensitive and highly effective procedures for quantitative analyses of pregabalin in pharmaceutical bulk and dosage form. Low cost, rapidity and simplicity are the advantages of this method. The proposed methods are effective alternatives for other analytical methods with respect to either cost or simplicity and speed. Quality control laboratories in the pharmaceutical industry may use these methods for routine analysis of pregabalin in its raw bulk and dosage forms.
ORCID iDs
F.A. Siddiqui: orcid.org/0000-0002-6255-1778
N. Sher: orcid.org/0000-0001-9114-0241
References
1 J.L. Piechan, S.D. Donevan, C.P. Taylor, M.R. Dickerson and Z. Li, LC-MS/MS determination of pregabalin in human plasma, Soc. Neurosci. Abstr., 2014, 30, 115. [ Links ]
2 L.A. Houghton, C. Fell, P.J. Whorwell, I. Jones, D.P. Sudwort, et al, Effect of a second-generation alpha2delta ligand (pregabalin) on visceral sensation in hypersensitive patients with irritable bowel syndrome, Gut., 2007, 56, 1218-1225. [ Links ]
3 S.S. Olesen, S.A. Bouwense, O.H. Wilder-Smith, H. Van Goor and A.M. Drewes, Pregabalin reduces pain in patients with chronic pancreatitis in a randomized, controlled trial, Gastroenterology, 2011, 141, 536-543. [ Links ]
4 N.M. Gajraj, Pregabalin: its pharmacology and use in pain management, Anesth.. Analg., 2007,105, 1805-1815. [ Links ]
5 D.R. Guay, Pregabalin in neuropathic pain: a more "pharmaceutically elegant" gabapentin?, J. Am. Geriatr. Soc., 2005, 3(4), 274-287. [ Links ]
6 R. Freynhagen, K. Strojek, T. Griesing, E. Whalen and M. Balkenohl, Efficacy of pregabalin in neuropathic pain evaluated in a 12-week, randomised, double-blind, multicentre, placebo-controlled trial of flexible-and fixed-dose regimens, Pain, 2005, 115(3), 254-263. [ Links ]
7 J.C. Fehrenbacher, C.P. Taylor and M.R. Vasko, Pregabalin and gabapentin reduce release of substance P and CGRP from rat spinal tissues only after inflammation or activation of protein kinase C, Pain, 2003,105(1-2), 133-141. [ Links ]
8 F.A. Siddiqui, M.S.Arayne, N. Sultana, F. Qureshi, A.Z. Mirza, M.H. Zuberi, S.S. Bahadur, N.S. Afridi, H. Shamshad and N. Rehman, Spec-trophotometric determination of gabapentin in pharmaceutical formulations using ninhydrin and pi-acceptors, Eur. J. Med. Chem, 2010,45, 2761-2767. [ Links ]
9 C. Pieszko, I. Baranowska and A. Flores, Determination of energizers in energy drinks, J. Anal. Chem, 2010, 65, 1228-1234. [ Links ]
10 M. Friedman, Applications of the ninhydrin reaction for analysis of amino acids, peptides, and proteins to agricultural and biomedical sciences, Agric. Food Chem, 2004, 52, 385-06. [ Links ]
11 F. Parrot, R. Bedry and J.C. Fawarel-Garrigues, Glyphosate herbicide poisoning: use of a routine aminoacid analyzer appears to be a rapid method for determining glyphosate and its metabolite in biological fluids, J. Toxicol. Clin. Toxicol, 1995, 33, 695-698. [ Links ]
12 J.D. Vasta, B. Fried and J. Sherma. Determination of estivation-induced changes in the amino acid content of biomphalaria Gabrata snails by high performance thin-layer chromatography densitom-etry, J. Liq. Chromatogr. R.T., 2010, 33, 1028-1037. [ Links ]
13 M. Friedman and C.W. Sigel, A kinetic study of the ninhydrin reaction, Biochem, 1966, 5(2), 478-485. [ Links ]
14 M.S. Arayne, N. Sultana, F.A. Siddiqui, A.Z. Mirza and M.H. Zuberi, Spectrophotometric techniques to determine tranexamic acid: kinetic studies using ninhydrin and direct measuring using ferric chloride, J. Mol. Struct., 2008, 889, 475-80. [ Links ]
15 A. Önall and O. Sagirli, Spectrophotometric and spectrofluorimetric methods for the determination of pregabalin in bulk and pharmaceutical preparation, Spectrochim. Acta A, 2009, 72, 68-71. [ Links ]
16 R.S. Gujral, S.M. Haque and P. Shanker, Development and validation of pregabalin in bulk, pharmaceutical formulations and in human urine samples by UV spectrophotometery, Int. J. Biomed. Sci., 2009, 5, 175-180. [ Links ]
17 N. Sher, N. Fatima, S. Parveen, F.A. Siddiqui and A.W. Sial, Pregabalin and tranexamic acid evaluation by two simple and sensitive spectro-photometric methods, Int. J. Anal. Chem., 2015, http://dx.doi.org/10.1155/2015/241412 [ Links ]
18 K. Navneet, M. Karan, N. Rishabh, N. Kunal, T. Arti, F. Road and G. Kalan, A sensitive spectrophotometric method for the determination of pregabalin in pure drug and pharmaceutical formulations through benzoylation, IRJP, 2010,1, 175-180. [ Links ]
19 H. Salem, Analytical study for the charge-transfer complexes of pregabalin, E-J. Chem., 2009, 6, 332-340. [ Links ]
20 M.I. Walash, F. Belal, N. El-Enany and M.H. El-Maghrabey, Simple and sensitive spectrofluorimetric method for the determination of pregabalin in capsules through derivatization with fluorescamine, Luminescence, 2011, 26(5), 342-348. [ Links ]
21 D.G. Themelis, P.D. Tzanavaras and E.A. Boulimari, Generic automated fluorimetric assay for the quality control of gamma amino-butyric acid-analogue antiepileptic drugs using sequential injection, Anal. Lett., 2010, 43, 905-918. [ Links ]
22 Y. Zhang, C. Holliman, D. Tang, D. Fast and S.J. Michael, Development and validation of a direct enantiomeric separation of pregaba-lin to support isolated perfused rat kidney studies, Chromatogr. B, 2008, 875, 148-153. [ Links ]
23 G.B. Kasawar and M.N Farooqui, Development and validation of HPLC method for the determination of pregabalin in capsules, Indian J. Pharm. Sci., 2010, 72, 517-519. [ Links ]
24 V.V. Vaidya, S.M. Yetal, S.M.N. Roy, N.A. Gomes and S.S. Joshi, LC-MS-MS determination of pregabalin in human plasma, Chromatographia, 2007, 66, 925-928. [ Links ]
25 D. Berry and C. Millington, Analysis of pregabalin at therapeutic concentrations in human plasma/serum by reversed-phase HPLC, Ther. DrugMonit, 2005, 27, 451-56. [ Links ]
26 T.A.C. Vermeij and P.M. Edelbroek, Simultaneous high-performance liquid chromatographic analysis of pregabalin, gabapentin and vigabatrin in human serum by precolumn derivatization with o-phtaldialdehyde and fluorescence detection, J. Chromatogr. B, 2004, 810, 297-303. [ Links ]
27 M. Dousa, P. Gibala and K. Lemr, Liquid chromatographic separation of pregabalin and its possible impurities with fluorescence detection after postcolumn derivatization with o-phtaldialdehyde, J. Pharm. Biomed. Anal., 2010, 53, 717-722. [ Links ]
28 ICH Q2(R1), Validation of Analytical Procedures: Text and Methodology, 2005. [ Links ]
29 J. Rose, Advanced Physico-chemical Experiments; A Textbook of Practical Physical Chemistry and Calculations, Pittman, London, 1964, p. 54 [ Links ]
30 H.A. Benesi and J. Hidelbrand, A spectrophotometric investigation of the interaction of iodine with aromatic hydrocarbons, J. Am. Chem. Soc., 1949, 71, 2703. [ Links ]
31 W.W. Wright and J.M.Vanderkooi, Use of IR absorption of the carboxyl group of amino acids and their metabolites to determine pKs, to study proteins, and to monitor enzymatic activity, Biospectroscopy, 1997, 3, 457-467. [ Links ]
Received 2 October 2018
Revised 19 March 2019
Accepted 8 April 2019
* To whom correspondence should be addressed. E-mail: farhanchemist@gmail.com

