


Servicios Personalizados
Articulo
 Inglés (pdf)
 Articulo en XML
 Referencias del artículo
Indicadores

Links relacionados
-
 Citado por Google
 -
 Similares en Google
Compartir

 Permalink
South African Journal of Chemistry
versión On-line ISSN 1996-840X
versión impresa ISSN 0379-4350
S.Afr.j.chem. (Online) vol.72 Durban 2019
http://dx.doi.org/10.17159/0379-4350/2019/v72a16
RESEARCH ARTICLE
Liquid Chromatographic Determination of Dexamethasone and Fluoroquinolones; in vitro Study
Nawab SherI, *; Nasreen FatimaI; Shahnaz PerveenII; Farhan Ahmed SiddiquiIII
IDepartment of Chemistry, Faculty of Science, University of Karachi, Karachi, Pakistan 75270
IIPCSIR Laboratories Complex, Karachi, Shahrah-e-Dr. Salimuzzaman Siddiqui, Karachi-75280, Pakistan
IIIFaculty of Pharmacy, Federal Urdu University Arts, Science and Technology, Karachi, Pakistan 75300
ABSTRACT
A precise, accurate and sensitive liquid chromatographic method is presented for the simultaneous analysis of moxifloxacin, levofloxacin, ciprofloxacin and dexamethasone in reference drugs, ophthalmic dosage form and in physiological fluids. Separation was achieved on a C18analytical column with acetonitrile-phosphate buffer (35:65 v/v) as mobile phase which was pumped isocratically at a flow rate of 1.0 mL min-1 and monitored at 254 nm wavelength. The calibration curve was linear in range of 40-10 000 ng mL-1. Test results in pharmaceutical and physiological samples showed excellent drug recovery (96.5-102.3 %) with good precision (0.81-2.3 % RSD). Test results were linear to sample concentration and correlation coefficient was more than 0.9990. The small value of quantification and detection levels showed the method to be sensitive enough for use in clinical and industrial investigations of all the mentioned drugs.
Keywords: Dexamethasone, fluoroquinolones, RP-HPLC, serum, urine.
1. Introduction
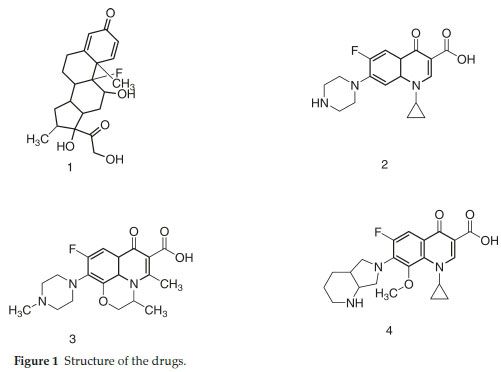
Generally, eye inflammations are caused by bacteria,1-5 therefore, recommendation of antibiotics along with anti-inflammatory agent is a mandatory choice.Since corticosteroids do not cure the fundamental cause of infection by themselves, therefore, a co-prescription with antibiotics is necessary to cure the infections. Dexamethasone (DMS) is glucocorticoid hydrocorti-sone derivative and has been widely recommended as a co-prescribed drug in combination with antibiotics such as moxifloxacin (MFC), levofloxacin (LFC) and ciprofloxacin (CFC) in ophthalmic preparations. This combination is used to treat conjunctivitis, keratitis, corneal ulcers and many other eye ailments.1-3 In this regard fluoroquinolones have been very promising which work through topoisomerase II & IV and DNA gyrase inhibitions. CFC, LFC and MFC are active against wide range of bacteria including both Gram-negative and Grampositive cultures.4-5 These fluoroquinolones have been used for various ailments such as urinary tract infections, respiratory tract infections, chronic bronchitis, lungs infection, pneumonia, eye infections, and abdominal infections, etc. The structure of DMS, CFC, LFC and MFC are shown in Fig. 1.
Literature survey reveals that there are various methods dedicated to determine these molecules simultaneously as well as individually in different samples. HPLC has been the most widely used technique.1-4,6-15 Prednisolone has been simultaneously quantified with ofloxacin and tetrahydrozoline throughHPLC.1 DMS simultaneous estimation with MFC,2 CFC3 and lomefloxacin4 in pharmaceutical samples have been reported. Various fluoroquinolones such as ofloxacin, CFC and MFC have been simultaneously quantified through liquid chromatogra-phy with pharmacokinetics detail.6 Various fluoroquinolones such as CFC, ofloxacin, enoxacin and norfloxacin have been successfully quantified with HPLC.7 An HPLC procedure established separation of five quinolones,8 while another documented simultaneous quantification of fluoroquinolones in chicken muscles.9 Seven quinolones including LFC and CFC have been determined through HPLC.10 Gatifloxacin, spar-floxacin and MFC along with LFC have been separated in a single run in HPLC with pharmacokinetics applications.11 Analysis of CFC and its metabolite,12 MFC and its metabolites,13 analysis of LFC in physiological samples14 and analysis of DMS in topical preparation15 has been achieved through HPLC.
DMS is an established combination of antibiotics especially fluoroquinolones, ideally with second, third and fourth generation. Therefore, it has been combined in this study with fluoroquinolones of these generations. The main intention behind this research was to develop the simultaneous determination of DMS with co-prescribed fluoroquinolones in various samples. Literature survey revealed that simultaneous quantification of DMS with CFC, LFC and MFC in pharmaceutical and physiological fluid has not been achieved yet. Extensive use as well as industrial malpractices flushes these drugs into the environment which triggers emergence of an early resistance.15 This research is dedicated to the development of a sensitive, fast and accurate narrow level chromatographic quantification of these drugs in pharmaceutical and physiological fluids such as serum and urine. Extensive method validation was conducted in line with ICH guideline.
2. Experimental
2.1. Apparatus
HPLC Apparatus of Shimadzu Corporation Japan was used in this study. This system was equipped with UV/VIS detector SPD 20A, LC 20 AT pump and SIL 20A auto-injector. The system was controlled by LC solution software. HPLC analytical column of Phenomenox Luna® C18 (4.6 x 250 mm; 5 μm bead size) was used for chromatographic separation. Shimadzu 1650 UV-visible spectrophotometer, Sartorius TE2145 analytical balance and Jenway 3240 pH meter was used in this study.
2.2. Material and Reagents
Five (5) g of each of DMS (98.5 %), MFC (99.2 %), LFC (99.6 %) and CFC (99.5 %), standardized against USP standard, were kind gifts from National Pharmaceutical. Acetonitrile and methanol (HPLC grade) were purchased from Fisher Scientific. Sulphuric acid, phosphoric acid, potassium hydrogen phosphate and triethylamine were from Merck, (Germany). Distilled water from Waterman, Pakistan, was acquired which was further filtered through a 0.45 μm membrane filter (Millipore, Bedford, MA, USA). Urine samples were collected from volunteers, stored at -4 °C and pH was adjusted at 3.0. Human blood was obtained from National Institute of Cardiovascular Disease, Karachi, Pakistan (NICVD), for in vitro studies. The pharmaceutical products containing DMS, MFC, LFC and CFC were procured from the local market.
2.3. Chromatographic Conditions
Phosphate Buffer (0.68 g monobasic potassium hydrogen phosphate in 500 mL water, pH was adjusted to 8.0 with triethylamine) was combined with acetonitrile (65:35 v/v) to get mobile phase. It was passed through 0.45 μm membrane filter and degassed. Mobile phase was drawn isocratically at flow rate of 1.0 mL min-1 followed by UV detection at 254 nm. The HPLC analysis was carried out at ambient temperature.
2.4. Analytical Procedure
2.4.1. Standard Solution Preparations
Individual stock solution for DMS, CFC, LFC and MFC of 2000 μg mL-1 was prepared by dissolving 200 mg of drug in 100 mL of diluent in a calibrated volumetric flask. 10 mL from each was combined in another 100 mL volumetric flask and diluted to the mark to give stock composite solution which was further sequentially diluted to a range of concentrations 40-10 000 ng mL-1 according to the requirements. Mobile phase was used as diluent.
2.4.2. Pharmaceutical Analysis
Ophthalmic dosage vials were arranged and the content was emptied in a clean and dry vial, for each drug to get a homoge-nous bulk sample. Required volume of drops was taken to a 100 mL calibrated volumetric flask followed by dissolution in mobile phase through sonication. The sample was diluted up to the mark level with the same diluent which was further diluted to the required concentration. Before analysis through HPLC system, all the samples were filtered through 0.45 μm membrane filter.
2.4.3. Serum Analysis
Serum was isolated by centrifuging blood at 2000 revolutions per min for about 10 min. The isolated serum was stored at -4 °C for pending analysis. Serum samples were deproteinized with acetonitrile (9:2 v/v) and were subjected to drug fortification experiments. For this purpose 1 mL of serum, 1 mL of stock simultaneous solution and 2 mL of mobile phase were mixed in a 5 mL calibrated volumetric flask. The sample was well mixed through sonication for few minutes. Samples were prepared in multiple and passed through 0.45 μm membrane filter, before chromatography.17-20
2.4.4. Urine Analysis
Urine samples collected from volunteers were spiked with composite stock solution. Ten male volunteers, with age range 25-40 years, participated in this study. For this purpose, 1 mL of urine, 1 mL of stock simultaneous solution and 2 mL of mobile phase were mixed ina5mLcalibrated volumetric flask. The sample was well mixed through sonication for few minutes. Samples were prepared in multiple and passed through 0.45 μm membrane filter before HPLC analysis.
2.4.5. Method Validation
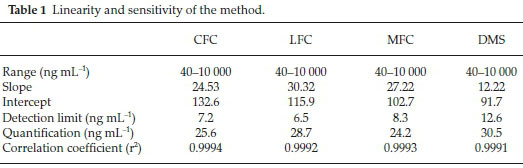
To establish validity of the projected method a comprehensive method validation study was conducted. Various aspects such as specificity and selectivity, linearity and range, limit of detection and quantification, accuracy, precision, and robustness were ascertained.16 Peak area was plotted against nominal concentration to obtain calibration curve. Linearity was ascertained from the calibration curve by using least square equation. Correlation coefficient, slope and intercept were assessed statistically. Detection and quantification limits were inferred from this curve. Limit of detection (LOD) and limit of quantification (LOQ) were calculated by applying following empirical formulae; LOD =
3.3 a/S and LOQ = 10 a/S, where σ is the standard deviation and S is the slope of the regression analysis in the calibration equation. These empirical formulae were verified practically, keeping a signal to noise ratio of 3:1 and 10:1 defined for LOD and LOQ, respectively.16 Specificity is defined as the quantification of the analyte unequivocally in presence of co-additives and other sample matrixes. Multiple spiking experiments were conducted on urine and serum samples as well as common pharmaceutical excipients to assess interference. Accuracy is known as the closeness of experimental results to the true value. Recovery test were carried out by spiking drugs in common placebo, urine and serum at 80, 100 and 120 % nominal concentrations. Samples were prepared in multiple to determine percent recovery and deviations. For the purpose of determination of precision, same bulk homogenous sample was subjected to multiple analyses and repeatability was determined by calculating percent relative standard deviation (%RSD) among the replicates. For the purpose of robustness, deliberate and minor changes were made in method parameters and were assessed against unchanged parameters. These parameters include changing components of mobile phase slightly in ratio, pH of mobile phase, temperature and flow rate of the pump as well as changing the detecting wavelength.
3. Results and Discussion
3.1. Method Development, Optimization and Validation
HPLC have been very frequently used in the determination of drugs molecules in various samples especially pharmaceutical and biological.17-20 Molecules having same physio-chemical properties such as fluoroquinolones usually co-elute and chromatography becomes a challenge. Variety of analytical column packed with various stationary phases such as C8,C18, nitrile and phenyls were comprehensively investigated with different nature of mobile phases and it was noted that mobile phase has a more profound effect on resolution and retention of molecules.21 Within the course of development of mobile phase, other features such as optimum wavelength, samples concentration and sonication time were studied. To find out suitable wavelength individual drug solutions were scanned and wavelength at 254 nm showed satisfactory absorbance for all the drugs. Preliminary experiments were conducted on simple mobile phases such as water-methanol, water-acetonitrile or water-methanol-acetonitrile in different proportions. It was found that retention time of DMS decreased when the proportion of organic modifier was increased in mobile phase, while fluoro-quinolones were least moved. This may be attributed to the presence of carboxyl functionality in fluoroquinolones. Aqueous medium was steadily changed from simple water to phosphate buffer which improved resolution and retention of fluoro-quinolones. Acetonitrile-phosphate buffer of pH 3.0 (30:70 v/v) exhibited a total run time of about 20 min, while fluoro-quinolones co-eluted with merged peaks at an early elution, however, DMS eluted last. It was also noted that with increase in ratio of phosphate buffer in mobile phase, symmetry of fluoro-quinolones peaks distorted as well as retention of DMS further drifted away up to 30 min. pH of the mobile phase was slowly and steadily increased with 1N NaOH and got better separation/ resolution of fluoroquinolones; however, owing to strong interaction of DMS with silonol group in stationary phase, the long run time was still unresolved. At this point of experimental setup, triethylamine was used instead of NaOH in order to decrease DMS-silonol interaction. This trial not only effectively improved resolution of fluoroquinolones but it reduced the elution of DMS. Thus phosphate buffer (0.68 g KHPO4in 500 mL water, pH adjusted to 8.0 with triethylamine) combined with organic modifier, i.e. acetonitrile (65:35, v/v %) turned out a suitable mobile phase with optimum results. C18 analytical column was used in analysis due to better results, although, other analytical column such as C8, phenyl and nitrile columns were also tried. Under these conditions mobile phase was run at a flow rate of 1.0 mL min-1 and all the drug molecules got eluted in 10 min, with satisfactory resolution and peak symmetry as shown in Figs. 2-6.
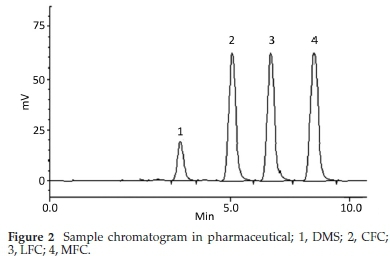
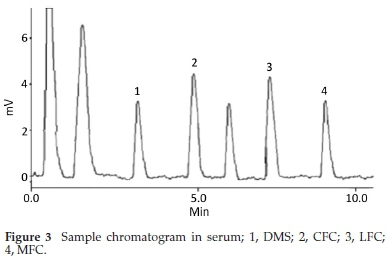
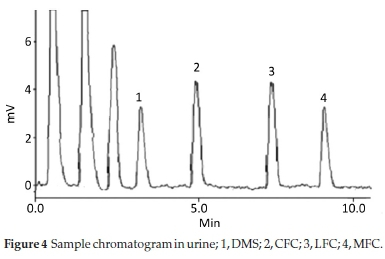
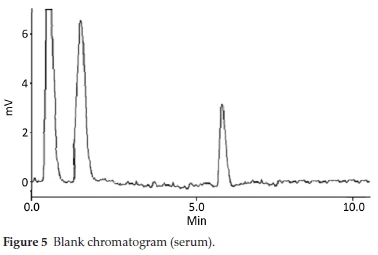
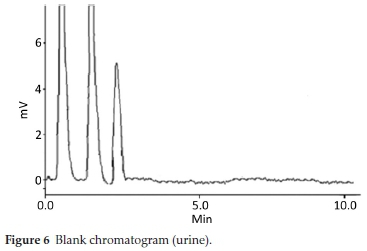
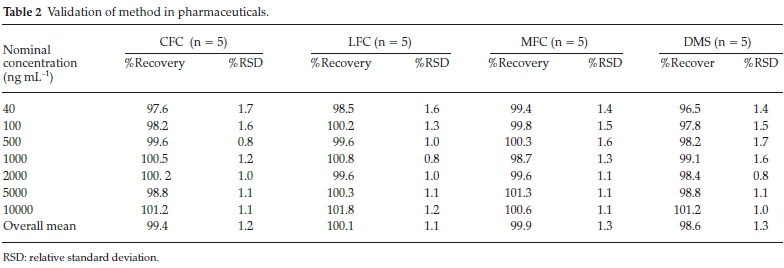
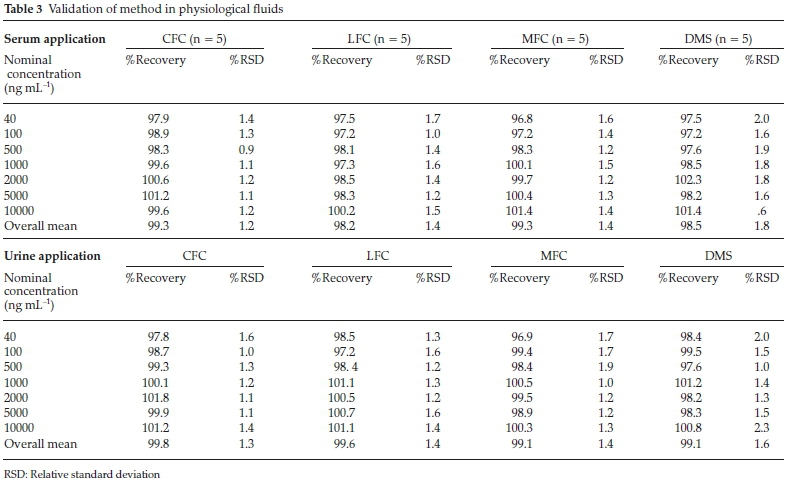
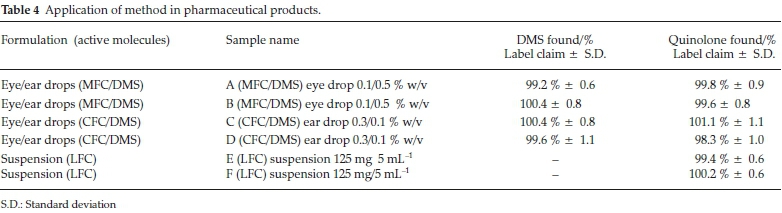
Method was comprehensively validated according to ICH guidelines.16 To investigate specificity, fluoroquinolones and DMS spiked samples were analyzed with the proposed method. Structure of drugs and resolution of peak of drugs are shown in Figs. 1, 2, 3 & 4. Figs. 2, 3 & 4 indicate well-resolved peaks from pharmaceutical dosage form, serum and urine samples, respectively. Retention time of peaks in both standard and sample chromatograms matched-up which proved excellent specificity. Blank serum and urine chromatograms are shown in Figs. 5 & 6, respectively. Selectively resolved peaks were further assessed for linearity and the resultant correlation coefficient of more than 0.9990 for all the drugs established excellent linearity with negligible intercept value and low level of quantification and detection limits Table 1. Resultant accuracy of 96.5 to 101.8 % in pharmaceuticals, 96.8 to 102.3 % in urine and serum samples, and 98.3 to 101.1 % in commercial product is a proof that method is highly accurate (Tables 2, 3 & 4). Precision studies include different days, i.e. two days multiple investigations. The pharmaceuticals analysis precision ranged from 0.80 to 1.7 %, urine and serum analysis ranged from 0.90 to 2.3 %. Results are presented in Tables 2, 3 & 4.
Chromatogram in Fig. 2 indicates excellent separation backed by Figs. 3, 4, 5 & 6 which showed prominent expression of the target molecules in in vitro investigation with co-additives, excipients and endogenous substances. Assay results were linear in range of 40-10 000 ng mL-1, with correlation coefficient of more than 0.9990 as well as low values of limit of detection and quantification were obtained as shown in Tables 1,2 & 3. Validation parameters such as accuracy and precision were assessed in a range of concentration covering low, intermediate and high concentrations. Results in Tables 2, 3 & 4 proved validity of the method. In this regard, recovery studies were carried out with physiological fluids which revealed excellent accuracy and precision. All tests results lie in the acceptable limits. The method has also been passed through robustness tests, for this purpose small and deliberate changes were made in method parameters and it was found that the proposed method withstood small and deliberate variation in method parameters. It was also noted that the stock composite solution kept in refrigerator at -4 °C remains intact and stable and can be used for 10 days.
3.2. Application of Method in Serum and Urine
Multiple analyses at different concentrations conducted on serum and urine samples indicated suitability of the projected method in the concerned domain. Table 3 demonstrates excellent applicability of the method in terms of linearity, accuracy and precision. Well-resolved peaks and selective quantification of the concerned peaks are obvious from the Figs. 4 & 5. Irrespective of concentration and type of the drugs the % recoveries were in the range of 96.8 to 102.3 %, while precision was 0.90 to 2.30 %, which grants authenticity of the proposed method in the respective applications.
4. Conclusion
The proposed new HPLC method successfully developed for simultaneous determination of DMS and fluoroquinolone. This procedure is accurate and precise and has applications in pharmaceutical as well as physiological fluid. The promising outcome of the method is the detection of the availability of fluoroquinolone in as low concentration as found in clinical as well as environmental samples. This development might have a significant impact not only in medical and pharmaceutical field but on the future of these antibiotics as well. The proposed method is highly simple, makes use of a commonly available instrument and has important applications in pharmaceutical and therapeutic monitoring.
Expression of Conflict of Interest
All the authors declare that for publication of this research article they have no conflict of interests.
Funding Disclosure Statement
There is no funding received by any author for this write-up preparation and submission.
ORCID iD
Ν. Sher: © orcid.org/0000-0001-9114-0241
References
1 M.S. Ali M. Ghori and A. Saeed, Simultaneous determination of ofloxacin, tetrahydrozoline hydrochloride, and prednisolone acetate by high-performance liquid chromatography, J. Chrom. Sci., 2002,40, 429-33. [ Links ]
2 P. Katakam and K.R. Sireesha, Liquid chromatographic method for determination of moxifloxacin and dexamethasone sodium phosphate in eye drops, Eurasian J. Anal. Chem., 2012, 7, 89-95. [ Links ]
3 P. Katakam and K.R. Sireesha, Simultaneous determination of cipro-floxacin hydrochloride and dexamethasone sodium phosphate in eye drops by HPLC, J. Chem., 2012, 9, 1077-1084. [ Links ]
4 K. Prakash and K.R. Sireesha, Liquid chromatographic method for simultaneous determination of lomefloxacin hydrochloride and dexamethasone sodium phosphate in eye drops, Asian. J. Pharm. Clin. Res., 2012, 5, 79-82. [ Links ]
5 B. Katzung, Basic & Clinical Pharmacology, 12th edn., McGraw Hill, New York, USA, 2012. [ Links ]
6 J. De Smet, K. Boussery, K. Colpaert, P.D. Sutter, P.D. Paepe, J. Decruyenaere and J.C, Bocxlaer, Pharmacokinetics of fluoroquinolones in critical care patients: a bio-analytical HPLC method for the simultaneous quantification of ofloxacin, ciprofloxacin and moxi-floxacin in human plasma, J. Chromatogr. B, 2009, 877, 961-967. [ Links ]
7 V.F. Samanidou, C.E. Demetriou and I.N. Papadoyannis, Direct determination of four fluoroquinolones, enoxacin, norfloxacin, ofloxacin, and ciprofloxacin, in pharmaceuticals and blood serum by HPLC, Anal. Bioanal., 2003, 375, 623-629. [ Links ]
8 L.A. Shervington, M. Abba, B. Hussain and J. Donnelly, The simultaneous separation and determination of five quinolone antibiotics usingisocratic reversed-phase HPLC: application to stability studies on an ofloxacin tablet formulation, J. Pharm. Biomed. Anal., 2005, 39, 769-775. [ Links ]
9 M.J. Schneider, S.E. Braden, I. Reyes-Herrera and D.J. Donoghue, Simultaneous determination of fluoroquinolones and tetracyclines in chicken muscle using HPLC with fluorescence detection, J. Chromatogr. B., 2007, 846, 8-13. [ Links ]
10 E. Nemutlu, S. Kir, Ö. Özyüncü and M.S. Beksac, Simultaneous separation and determination of seven quinolones using HPLC: analysis of levofloxacin and moxifloxacin in plasma and amniotic fluid, Chromatographia., 2007, 66, 15-24. [ Links ]
11 N. Srinivas, L. Narasu, B.P. Shankar and R. Mullangi, Development and validation of a HPLC method for simultaneous quantitation of gatifloxacin, sparfloxacin and moxifloxacin using levofloxacin as internal standard in human plasma: application to a clinical pharmaco-kinetic study, Biomed. Chrom., 2008, 22, 1288-1295. [ Links ]
12 G.J. Krol, G.W. Beck and T. Benham, HPLC analysis of ciprofloxacin and ciprofloxacin metabolites in body fluids, J. Pharm. Biomed. Anal., 1995,14,181-190. [ Links ]
13 P. Djurdjevic, A. Ciric, A. Djurdjevic and M.J. Stankov, Optimization of separation and determination of moxifloxacin and its related substances by RP-HPLC, J. Pharm. Biomed. Anal., 2009, 50, 117-126. [ Links ]
14 S. Böttcher, H.V. Baum, T. Hoppe-Tichy, C. Benz and H.G. Sonntag, An HPLC assay and a microbiological assay to determine levo-floxacin in soft tissue, bone, bile and serum, J. Pharm. Biomed. Anal., 2001, 25, 197-203. [ Links ]
15 C.V. Garcia, A. R. Breier, M. Steppe, E.E.S. Schapoval and T.P. Oppe, Determination of dexamethasone acetate in cream by HPLC, J. Pharm. Biomed. Anal., 2003, 31, 597-600. [ Links ]
16 ICH-Q2B Guideline for Industry, Validation of Analytical Procedure: Methodology, International Conference on Harmonization, Commission of the European Communities, Geneva, 2005. [ Links ]
17 N. Sher, N. Fatima, S. Perveen and F.A. Siddiqui, Determination of benzimidazole in pharmaceutical and serum sample, J. Instrum. Sci. Technol, 2016,44, 672. [ Links ]
18 F.A. Siddiqui, N. Sher, A. Zubair, H. Shamshad, N. Shafi and A.Z. Mirza, Analysis of metformin, glimepiride and pioglitazone in human serum and its application to pharmacokinetics, Anal. Methods, 2013, 5, 5096-5104. [ Links ]
19 N. Sher, F.A. Siddiqui, N. Fatima and S. Perveen, N. Shafi, New method development for hydroxyzine determination: application in stability studies, pharmaceutical formulations, and human serum, J. Liq. Chromatogr. Relat. Technol., 2015, 38, 911-918. [ Links ]
20 N. Sher, F.A. Siddiqui, N. Hasan, N. Shafi, A. Zubair and A.Z. Mirza, Simultaneous determination of antihistamine anti-allergic drugs, cetirizine, domperidone, chlorphenamine maleate, loratadine, meclizine and buclizine in pharmaceutical formulations, human serum and pharmacokinetics application, Anal. Methods., 2014, 6, 2704-2714. [ Links ]
21 J. Barbosa, R. Bergés and V. Sanz-Nebot, Solvatochromic parameter values and pH in aqueous-organic mixtures used in liquid chroma-tography. Prediction of retention of a series of quinolones, Chromatogr. A., 1996, 719, 27-36. [ Links ]
Received 4 June 2018
Revised 22 December 2018
Accepted 20 January 2019
* To whom correspondence should be addressed. E-mail: nawabsherafridi@gmail.com

