


Serviços Personalizados
Artigo
 Inglês (pdf)
 Artigo em XML
 Referências do artigo
Indicadores

Links relacionados
-
 Citado por Google
 -
 Similares em Google
Compartilhar

 Permalink
South African Journal of Chemistry
versão On-line ISSN 1996-840X
versão impressa ISSN 0379-4350
S.Afr.j.chem. (Online) vol.72 Durban 2019
http://dx.doi.org/10.17159/0379-4350/2019/v72a15
RESEARCH ARTICLE
Calcination of Precipitated Calcium Carbonate with Surfactant-assisted Agglomeration - A Non-isothermal Topochemical Approach
Debalina DasguptaI, *; Tomasz WiltowskiI, II, †
IAdvanced Coal and Energy Research Center
IIDepartment of Mechanical Engineering and Energy Processes, Southern Illinois University, Carbondale, IL 62901, U.S.A
ABSTRACT
It has been shown that precipitated calcium carbonate prepared by surfactant-assisted agglomeration (PCC-SAA) provided higher capacity for the carbon dioxide capture during calcination carbonation cycling as compared to commercially available calcium carbonate. It was also shown previously that the capacity was maintained over multiple cycles while commercially available calcium carbonate significantly lost its capacity. In order to understand the differences in the calcination behaviour of the PCC-SAA sample as compared to the commercially available laboratory-grade calcium carbonate (AC) sample, a non-isothermal topochemical approach was adopted to delineate the various controlling mechanisms for calcination of CaCO3. Activation energies were calculated using iso-conversional methods such as Friedman's method, the KSA method, and the FWO method. In addition, the mechanism was identified at different heating rates by applying the Malek's method and evaluated in some cases using the JMA kinetics. Finally, four mechanisms were used to calculate the pre-exponential (frequency factor). Some key differences such as the initiation temperature, and mechanisms were found between the two samples. Generally, it was found that the differences in the two samples were primarily due to the structural causes. It was observed that the initiation temperature for CaCO3 decomposition, activation energies and mechanisms were a function of the heating rates. D2 or D4 was identified as the controlling mechanisms at lower temperatures for the PCC-SAA sample in contrast to JMA (n > 1) kinetics for the higher heating rates. For the AC sample, 3D diffusion process appears to control the calcination of the AC sample.
Keywords: Greenhouse gas, precipitated calcium carbonate, surfactant-assisted agglomeration, calcination kinetics, diffusion, iso-conversional.
1. Introduction
CO2, a greenhouse gas, is produced in a number of industrial applications. To mitigate its effect on climate change, research is under way for its reduction from such industrial effluent streams. The approaches include pre-utilization as well as post-utilization reduction of CO2. Independent of application or the approach, the capture necessitates the use of an inexpensive cyclic process. One material that fulfils this need is CaO. CaO based CO2 capture and release cycles have been applied in the pre-combustion carbon removal,1 energy storage,2 coal hydro-gasification driven zero-emission process,3 chemical heat pump,4,5 etc. In a previous paper,1 we described a process of the production of hydrogen from syngas by reactive separation of CO2 from hydrogen following a water gas shift reaction or CO disproportionation reaction. There, we have shown that the removal of CO2 by utilizing the carbonation of calcium oxide offers distinct advantages over other processes.
Stoichiometry dictates that 0.786 g of CO2 can react with 1 g of CaO, i.e. 44 % of the resultant CaCO3 is the captured CO2. However, this high value is often not achieved due to lack of access of the CaO sites by the CO2 molecules due to limitations posed by a variety of structural issues including sintering, pore blockage (especially pore radii <2 mm due to the formation of the larger carbonate, 37 cm3 mol-1, compared to the oxide, 17 cm3 mol-1), and occlusion by surrounding molecules. Dedman and Owen7 reported 30 % CO2 uptake in 30 min at a carbonation reaction temperature of 600 °C while Mess et al.10 observed 82 % conversion in 32 h at a much higher temperature (1050 °C) and elevated pressures (11 atm). Neither study showed an acceptable rate of CO2 capture. Dasgupta et al.11showed that pore sizes larger than 3.2 nm eliminate the issue of pore pluggage leading to higher uptakes and rapid kinetics in spite of lower total surface areas. Thus, we compare the calcination characteristics of the sample prepared by surfactant-assisted agglomeration based precipitated calcium carbonate1 and chemical-grade commercially available calcium carbonate.
In addition to rapid calcination and carbonation kinetics, a suitable CO2 capture material would also exhibit robustness, i.e. negligible loss in reactivity and uptake after several CO2 capture and release cycles. Several of the past studies show rapid deterioration in CO2 uptakes in a relatively small number of cycles. In a study2,12 on limestone-derived CaO, CO2 uptake relative to the theoretical value decreased from 73 % in the initial cycle to 43 % in five cycles. Upon decreasing the CaO particle size in his latter studies, he observed sustained uptakes at 93 % over 30 cycles. In a separate but similar study, CO2 uptake relative to the theoretical value decreased from 70 % in the first cycle to 38 % in the seventh cycle.4 Curran etal.13 also observed similar reduction in CO2 uptakes on dolomite upon repeated carbon-ation and calcination. Gupta and Fan14 showed that precipitated calcium carbonate (PCC)-derived CaO reduces the limitations observed from other CaO sources. Similar results were also reported by Dasgupta el at.11in their study on surfactant-assisted agglomeration of PCC (PCC-SAA) and subsequent calcination to produce CaO for CO2 capture. CaO and its regenerability is also of interest in other applications15,16 involving CO2 capture.
Finally, from a sustainability aspect as well as for economic reasons, the use of CaO for CO2 capture would require a carbon-ation and a calcination reactor. A sequestration/utilization-ready CO2 would be obtained from the calcination reactor. For sustained reactivity and uptake, the calcination kinetics and the degree of calcination of the CaCO3 over multiple cycles would be vital for its commercial application. There have been studies,11,12,14,17-22 where the nature and degree of calcination over repeated cycles were conducted along with the estimation of the kinetic parameters for calcination of CaCO3. Even though these studies have been conducted for a long time, it still piques the interests of researchers due to the reversibility of the reaction, the endothermic nature and the operations at high temperatures. According to the results obtained from the different studies reported in literature,14,23-33 a wide variation for the Arrhenius parameters were found (Ea - 110 to 3800 kJ mol-1; frequency factor -100 to 101571s-1). The variation could be attributed to a number of factors such as shape of the crystalline phase, particle size distribution, isothermal or non-isothermal heating, heating rates, and, the partial pressure of carbon dioxide. In addition, the calculation procedure also strongly affects the estimated values. Most recently, Georgieva el at.34 conducted non-isothermal thermogravimetric studies on the calcination of a reagent grade and in silu calcium carbonate produced from calcium oxalate monohydrate at four heating rates. The kinetics and decomposition mechanism were evaluated using a variety of calculation procedures including the FWO iso-conversion method. Their results show that the selection of the proper mechanism is vital for the evaluation of the process, and thus, the use of model-independent methods to isolate and estimate some of the parameters followed by mechanism selection is necessary for analysis. In addition, no study has been conducted to evaluate the mechanisms of calcination or carbonation of PCC to understand its differences that may elucidate its enhanced performance reported by Gupta and Fan14 and Dasgupta el at.11
In this paper, a non-isothermal approach has been adopted to delineate the various controlling mechanisms for calcination of CaCO3. As mentioned earlier, commercial CaCO3-based CaO do not exceed CO2 uptakes greater than 80 % (even in the first cycle) while PCC-SAA-based CaO approaches near-complete conversion. In this study, commercial CaCO3 and PCC-SAA were compared to understand the mechanisms that lead to the differences in the performance of the two calcium carbonates. The calcination reactions were evaluated using a thermogravimetric technique at different heating rates and model-free analytical methodologies to estimate the activation energies. In addition, Malek's method was employed to identify possible mechansims and the pre-exponent factor was estimated based on the selected models.
2. Experimental
2.1. Materials
Laboratory-grade CaCO3 was obtained from Aldrich Chemicals while laboratory-grade CaO was obtained from Fisher Scientific. Didodecyl diethyl ammonium bromide (DDAB), the surfactant, was obtained from Sigma Aldrich. N2 and CO2 used for calcination and carbonation experiments were 99.999 % and 99.9 % pure, respectively. It must be noted that the mechanistic analysis was conducted on the fourth calcination cycle.
2.2. Synthesis of PCC-SAA
PCC-SAA was synthesized using a surfactant-templated precipitation method outlined in Dasgupta el at.11In this study, the initial CaO aqueous suspension used contained 3.84 g CaO L-1 water to which 0.1 g of the surfactant (DDAB) L-1 water was added. Precipitation was initiated by bubbling CO2. The agglomeration of the CaCO3 was controlled by the surfactant which resulted in a morphologically altered high surface-area particles. Upon completion of precipitation, the solids were vacuum filtered and vacuum dried at nearly 100 °C.
2.3. Physical Characterization
A Quantachrome Nova 2000 BET analyzer was used to obtain multipoint surface areas. Microtrac S3500 was used for particle size distribution determination.
2.4. Gravimetric Analysis
Thermogravimetric analysis (TGA) was employed to obtain the weight change data during calcination and carbonation. The calcination kinetic data were obtained using the PerkinElmer TGA-7 Thermogravimetric Analyzer with a TAC 7/DX control box upgrade driven by Pyris software in an IBM compatible computer. The details of the TGA experiments are provided in Dasgupta el at.11Three isothermal calcination and carbonation cycles were conducted to observe the morphological changes as well as ensure that the uptake capacity was maintained.
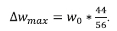
TGA experiments were conducted non-isothermally at different heating rates, namely 2,5,10,15,20,25 and 30 K min-1 under nitrogen for calcination, to evaluate the calcination kinetics and mechanism. The only difference between the description in Dasgupta el at.11and this study is that non-isothermal kinetic data was obtained. The heating programme was initiated after sample stabilization by applying a predetermined heating rate. Inert (N2) atmosphere was maintained during the calcination stage till the furnace temperature reached 900 °C. The calcination reaction was completed as this temperature was approached (i.e. 56 % of the original sample mass remained). The furnace was cooled to 25 °C and allowed to equilibrate for 30 min in the inert atmosphere prior to initiating the carbonation step. Now, CO2 was passed over the cold sample for 15 min. The temperature programme was then initiated and the upper temperature limit was set at 800 °C. Once the temperature was reached, the furnace was cooled to 25 °C and allowed to equilibrate for 30 min in the inert atmosphere and the calcination process was reinitiated. After three such cycles were completed, a final calcination cycle was initiated and the results from this calcination step were analyzed. Upon repeating two of the TGA experiments, we calculated the variation in the conversion degree to be within 2-5 % range, thereby indicating good repeatability. In addition, we believe that stable hydrodynamic regime in the TGA was obtained at 20 cm3 min-1 active gas (N2 or CO2) flow rate since no weight fluctuation was observed. In order to verify the negligible impact of external mass and heat transfer resistances, experiments were also conducted at the higher 35 and 40 cm3 min-1 of active gas flow rates.
3. Data Analysis
The TGA data provides the mass (w) as a function of time (t) and temperature (T). The extent of conversion on mass basis (aw) was calculated as:

where,
The extent of conversion for the calcination analysis on a molar basis was also extracted from the TGA data using the following:

The fundamental rate equation for solid state reactions is:

where A is the pre-exponential factor, Ea is the activation energy, R is the universal gas constant, T is the absolute temperature, a is the fraction reacted/converted and f(a) is a functional relationship of the a. For a gas-solid reaction, the concentration of the gas will also change as the reaction proceeds. However, for a large gas flow and at high concentrations as used in this study, the effect of gas concentration can be neglected and considered constant. Under non-isothermal conditions, if a heating rate of β (dT/dt = β) was employed then Eq. 1 could be rewritten as

In the above equation, A, Ea and f(a) needs to be determined to completely understand the mechanism and kinetics of the reaction.
Simple methods exist for the extraction of activation energy, Ea, from thermoanalytical data based on the assumption that Eq. 2 provides a complete description of the reaction. One such method is the Kissinger method35 using the differential thermo-gravimetric data. The Kissinger method is essentially the second derivative with respect to temperature and equated to zero at the rate maximum yielding:

Thus, plotting ln  for a number of heating rate yields a slope equal to
  and an intercept equal to
  + In
+ In  . It should be noted that the application of this method assumes that the value
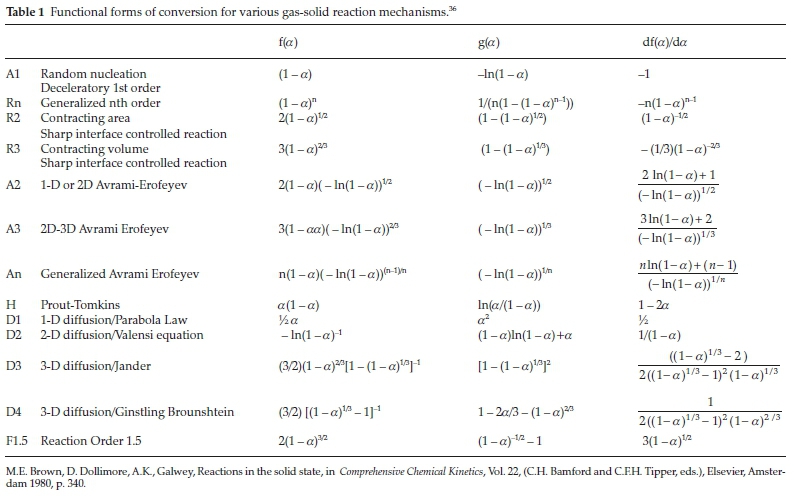
  is constant. Once the form of f(a)is determined, the value of A can also be estimated. If the above-mentioned assumptions are valid, this method can be used independent of the reaction mechanism/order. It can be seen from Table 1 that the analysis is valid primarily for random nucleation and 1-D diffusion where the f(a)isa linear function of the fractional conversion, and, to some extent, it is also valid for the other models.
Model-independent, iso-conversion-based techniques have also been used in the past to determine the activation energies. The assumptions of iso-conversional methods are that the reaction rate at a given conversion is only a function of temperature, and the reaction model is independent of the heating rates. The Friedman37 method is based on plotting ln  at a predetermined conversion. If the plot yields a straight line, then the slope of the line is -Ea/R and the intercept is ln(A*f(a)). As opposed to the differential method by Friedman, the Flynn-Wall-Osawa method (FWO) is an integral one wherein the equation in its differential form is:38-40

Here, the temperatures for each degree of conversion and heating rates are measured and the plot of ln(3) vs 1/T are plotted at given conversion values. If the plot yields as straight line, the slope of the line is  In iso-conversional methods, for a single mechanism reaction, the activation energy will be constant throughout all conversion levels. However, for changing mechanisms, the activation energy will be a function of the conversion level. According to Budurgeac,41 the Friedman method is more suitable when the activation energies are a function of the conversion.
The functional form of f(a) can be determined using the method proposed by Malek.42,43. In this procedure, two functions are first determined, Y(a) and Z(a).
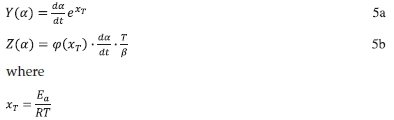
And φ(χτ) is the temperature integral which can be approximated by the following

The shape of Y(a) is then used asa diagnostic tool for the determination of the model in conjunction with the values of maximum am obtained for the Y(a) function, maximum ap obtained for the Z(a) function. Once the form of f(a) is determined, the pre-exponential factor can be determined based on the intercepts obtained from the Kissinger35,44 or Friedman37 methods.
4. Results and Discussion
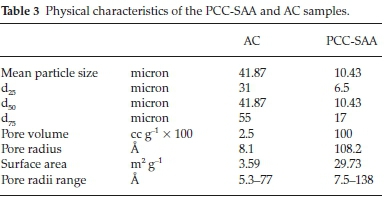
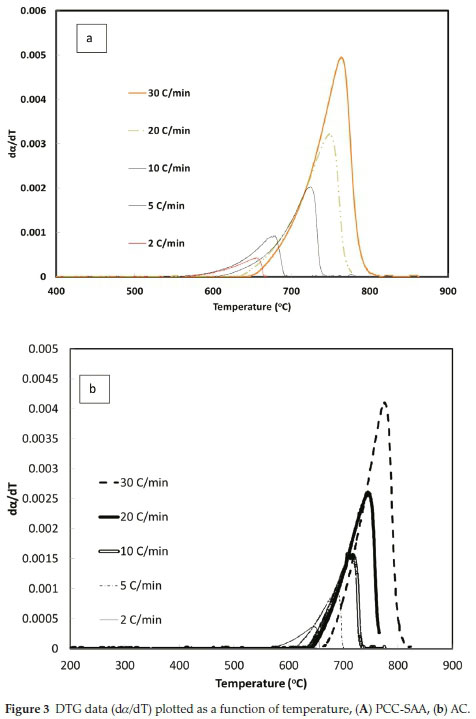
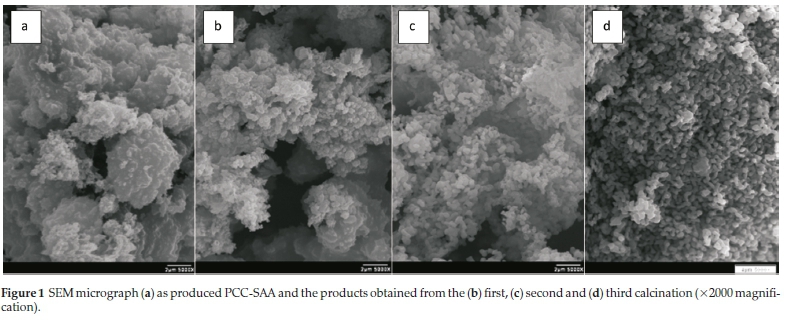
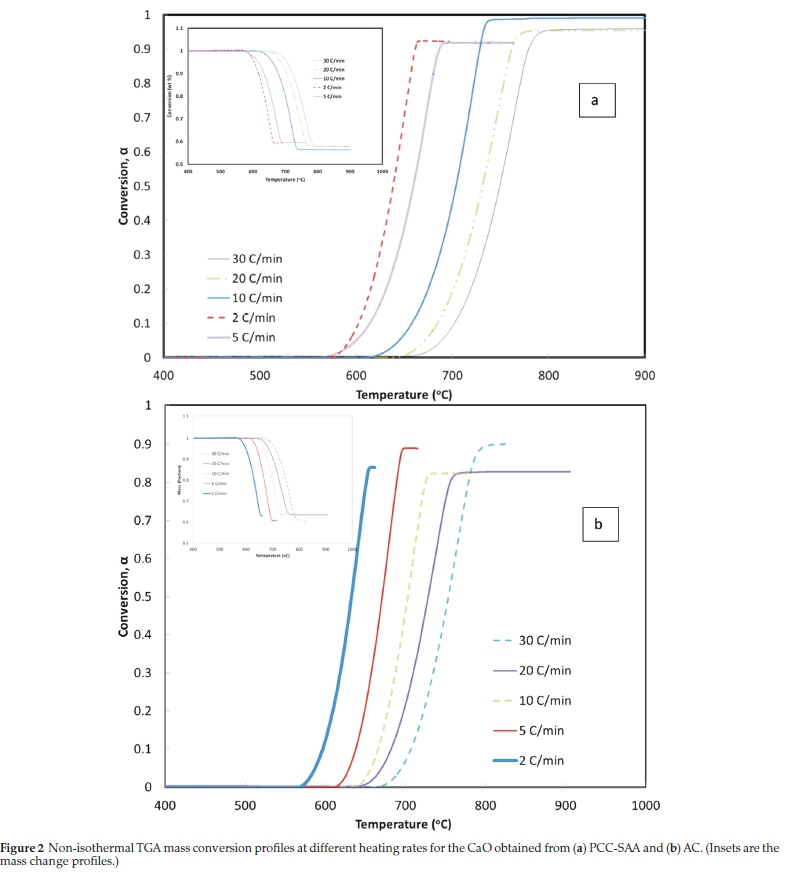
Fig. 1a is SEM micrograph of the as-produced PCC-SAA while Fig. 1b-d are the SEM micrographs of the products obtained from the first, second and third calcination - carbonation cycles conducted isothermally at 750 °C each, in pure N2 and pure CO2, respectively. The change in morphology of the products with each calcination-carbonation cycle is clearly seen these micrographs. Fig. 2a and Fig. 2b are the non-isothermal TGA mass conversion profiles at different heating rates for the PCC-SAA and AC, respectively. The insets in the figures are the mass change profiles from which the conversions were calculated. The heating rates ranged from 2 K min-1 to 30 K min-1 for both samples. It is evident from both the figures that the CaCO3 calcination initiates somewhere in the 560-675 °C although the PCC-SAA calcination appears to occur at a lower temperature than the AC samples (Table 2). In addition, it is also observed that the AC samples are calcined to a maximum degree of 90 % (82-90 %) while the 92-99 % of the PCC-SA samples were converted. It is hypothesized that larger pore radii of the PCC-SAA sample allows for more reaction control and less of product diffusion control in the pores. Table 3 contains the pore characterization and the particle size characterization of the two samples. It is seen from the table that the particle size of PCC-SAA is nearly a quarter of that of the AC sample while the specific surface area is nearly 8.3 times that of the AC sample. If the particles were non porous, the ratio of the specific surface areas would have been sixteen. The lower ratio is primarily due to the large pore volume and large pore radius. The large pore radius of the PCC-SAA in turn assists in the near-complete conversion of CaCO3. Thus, the amount of solid-state diffusion of CO2 is greatly reduced.
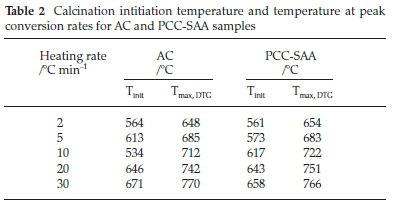
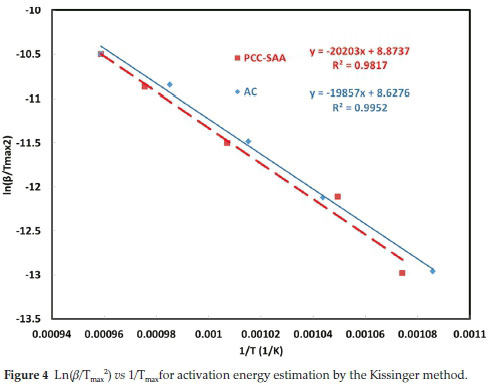
To further analyze the non-isothermal thermoanalytical data presented in Fig. 2, the DTG data (da/dT) were plotted as a function of temperature (Fig. 3). The Tmax values (Table 2) were identified for each heating rate for both the samples and each mechanism. Then the ln(3/Tmax2) was plotted as a function of 1/Tmax (Fig. 4). Using the slopes of the lines, the activation energies for each step have been calculated for both the samples. The Ea values for the calcination of AC and PCC-SAA were estimated to be 165.09 and 167.97kJ mol-1, respectively. CaCO3 calcination has been studied for a long time and various researchers have reported a wide range of activation energy. The values varied due to the differences in the origin of the sample, the experimental procedure and the analytical procedure. For example, Georgiava34 reported an activation energy of 326.4 kJ kmol-1 using the phase-boundary reaction or contracting sphere reaction mechanism (f(a) = 3(1-a)2/3). Okunev etal.26used an activation energy of 170.22 kJ mol-1 in their study on the decarbonation of CaCO3. Zsacko and Arz27 reported an activation energy for this reaction to be between 113-204 kJ mol-1. Ray28 estimated that the activation energy was between 100 and 4000 kJ mol-1 while Altorfer29 estimated Ea to be between 220 and 348 kJ mol-1. Criado and Morales30 suggested the phase-boundary contracting volume (R3) similar to Georgiova38 for the CaCO3 decomposition under vacuum. Ninan et al.,31on the other hand, found g(a)=1-(1-a)1/2 = kt to be representative of the kinetics of CaCO3 thermal decomposition, while reporting values of activation energy varying between 167.5 and 3768 kJ mol-1 depending on the experimental conditions. Halikia et al.32used isothermal analysis and found the values of activation energy at various conversion levels to be around 160 kJ mol-1. Our data show an activation energy value that is nearly half of that reported by Georgiova et al.34 Although not significant, their analysis also showed that the activation energy was a function heating rate. Using four different methodologies, they reported activation energies ranging from 325.1 to 329 kJ kmol-1. In addition, it was seen that the activation energies were a function of the extent of conversion. Thus, iso-conversion techniques were also implemented in this study.
Friedman's iso-conversional method was applied to the data from both samples. The ln  values were plotted against 1/T values for all the heating rates (Fig. 5a,b) for studies with PCC-SAA and AC sampf les, respectively. In general, it was observed that the value o
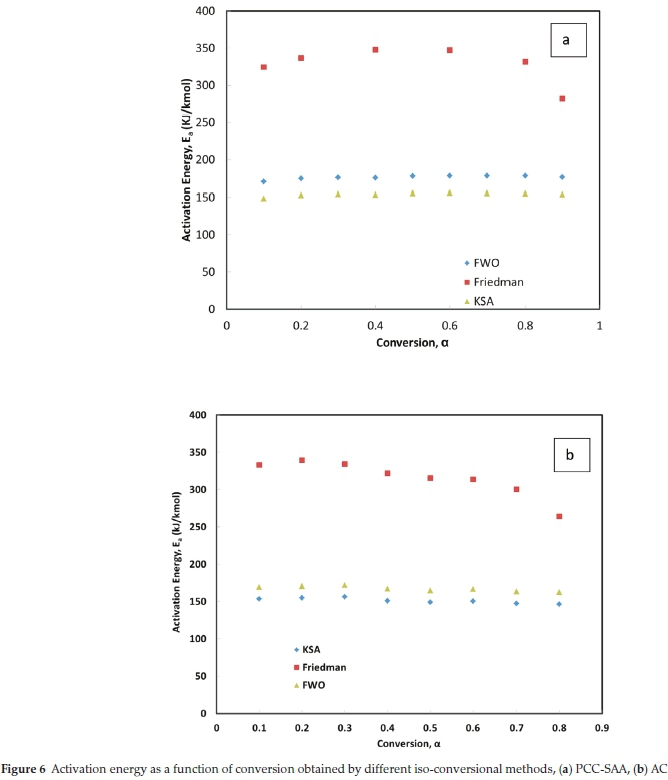
  did not vary strongly with a but it did vary with heating rates. The data for each conversion value was linearly fitted and the slopes were estimated. The Ea value at each conversion level was then evaluated for both samples. The variation of Ea as a function of the conversion is plotted in Fig. 6. Similarly, the FWO iso-conversional method was also applied to the data. Fig. 5c and Fig. 5d are the plots of ln(3) vs 1/T at different conversion levels for the PCC-SAA and AC samples, respectively. As can be seen from the plot, the data at each conversion yield straight lines. The slopes of the lines were then used to calculate the activation energies at each conversion level. Fig. 6 contains the plots of the activation energies as a function of conversion for the PCC-SAA sample. The Kissinger-Sunose-Akahira (KSA) iso-conversional method was also applied for comparison and for using the data to obtain the pre-exponential Arrhenius parameter. In this analysis, the ln(3/T2) was plotted against 1/T (Fig. 5e,f) for each conversion and the slope of the line was used to extract the activation values. The activation energies obtained by the KSA method are plotted as a function of extent of conversion in Fig. 6.
It is observed from Fig. 6, that the activation energy is a function of the conversion. The Friedman's method yielded Ea values significantly larger (nearly two times) than that obtained from the KSA and FWO methods. It was also generally observed that the KSA method estimated Ea values (148-153 kJ kmol-1 for PCC-SAA and 154-146 kJ kmol-1 for the AC sample) lower than the Kissinger method while the FWO method predicted Ea values (170-177kJ kmol-1 and 162-169kJ kmol-1 forthe PCC-SAA and AC samples, respectively) higher than that obtained by the Kissinger method. In general, the activation energy was found to increase with conversion for PCC-SAA sample while it was found to decrease for the AC sample. Decreasing activation energy alludes to an increase in the contribution of diffusion limitation to the overall rates. The pore radii range (as well as the mean pore radii) of the AC sample is significantly lower than the PCC-SAA sample. Upon calcination, the surface molecules are released first followed by the release of the CO2 from the pores. Due to the smaller radii of the pores, the rates are increasingly limited by diffusion with an increase in the conversion, resulting in a decrease in the activation energy in the case of AC sample. On the other hand, the release of CO2 from the PCC-SAA sample widens the pores further from the already larger pores. This increase in pore diameter results in a decrease in the contribution of diffusion in the rate-limiting step and the process becomes increasingly reaction controlled, and, as a result, there is an increase in the activation energy with conversion.
In order to extract mechanistic information, Malek's method was utilized. Y(a) and Z(a) functions were calculated and plotted as a function of conversion. Fig. 7 contains the data for the PCC-SAA sample. It is evident from the figure that the controlling mechanism is a function of the rate of heating. Clearly at low heating rates (2 and 5 °C min-1), the controlling mechanism is different than the higher heating rates of 10, 20 and 30 °C min-1. At the lower heating rate, we observe in Fig. 7 a that the am =0 and that the curve is concave. Thus, diffusion mechanism (D2, D3 or D4), reaction controlled with order greater than 1 or follow the Johnson-Mehl-Avrami (JMA) mechanism45-48 of random nucleation (n < 1). According to the method, apmax obtained from Z(a) curves determine the mechanism. The mechanism can be D2, D3 or D4 if the apmax is 0.834, 0.704 and 0.776, respectively.
From Fig. 7c, the value of apmax is estimated to be approximately between 0.78 and 0.835. Thus, one could use D2 or D4 for evaluating calcination mechanism. At the higher heating rates, it was observed that 0 < αm < αpmax which indicates that the mechanism may be either reaction controlled or follow the JMA kinetics (n > 1). The αpmax value was found to range between 0.835 and 0.9. We, thus, used the generalized Avrami Erofyev equation46-18 to evaluate the value of n in f(a) = n(1 - a)(-ln(1 - a))(n-1)/n. Plotting ln(3) vs ln[-ln(1 - a)], it was determined that the value of n lay between 1.739 to 1.998 with an average of 1.903 for the PCC sample. We then plotted the values of [ln(32) -g(a)] vs 1/T and obtained the slopes for each heating rate. It was found that the activation energy at the lower heating rates were between 110 and 116 kJ mol-1 for 2 °C min-1 and 5 °C min-1. The activation energies at the higher heating rates were found to be 176.34, 193.22 and 211.32 kJ mol-1 at 10, 20 and 30 °C min-1, respectively.
For the AC sample, the value of apmax is estimated to be approximately 0.71 at higher heating rates (10, 20 and 30 °C min-1) and approximately 0.78 at lower heating rates (2 and 5 °C min-1). Thus, 3D diffusion process appears to control the calcination of the AC sample. One could use D3 for evaluating calcination mechanism at the higher heating rates or D4 at the lower heating rates. Plotting [ln(/32) -g(a)] vs 1/T and corresponding analysis yielded values of the activation energies to be 113.77, 145.36, 158.38, 162.45 and 163.03 kJ mol-1 at 2, 5,10, 20 and 30 °C min-1, respectively. Thus, it is observed that there is a clear difference in the mechanism of CaCO3 decomposition due to changes in heating rates for the PCC-SAA sample, although the mechanism for the AC sample appeared to be independent of the heating rate.
The frequency factor, A, can be estimated by with the FWO-based equation (Eq. 7) or the KSA-based equation (Eq. 8).
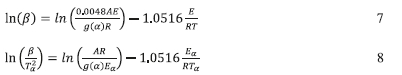
The E/R values calculated earlier from the slopes of the corresponding plots in Fig. 5c-f were used to estimate the pre-expo-nential factor, A. Four different reaction mechanisms were used to evaluate the value of A as a function of extent of calcination using the above equations. Table 4a contains the values of A for the four different mechanisms by the KSA and the FWO methods at different conversion levels for the PCC-SAA sample while Table 4b contains the same information for the AC sample. It is generally observed that the value of A as well as EA/R decrease with conversion for the AC sample while they increase with conversion for the PCC-SAA sample. Decrease in the activation energy for the AC sample has been discussed to be related an increase in the contribution of diffusion to the rate-limiting step due to opening of pore passages during calcination of surface carbonates. In the PCC-SAA, sample, the pores are further widened upon calcination and as a result, the contribution of diffusion is reduced and the process becomes more reaction rate limited. The decrease in the value of A in conjunction with the EA/R value clearly shows that for any given temperature the overall reaction rate decreases with conversion. This is often true for diffusion-limited processes such as kinetics limited by 'diffusion through ash layer'. On the other hand, the increase in both the values of A and EA/R in the PCC-SAA data indicate that at any given temperature, the overall reaction rate increases with conversion which occur when new active sites become available and diffusion limitation is decreased. This is believed to occur as calcination progresses in the PCC-SAA sample.
5. Conclusions
Based on the data obtained from this analysis, it was concluded that the initiation temperature for CaCO3 decomposition is a function of the heating rate. It was also concluded that the AC sample exhibits calcination phenomenon at a lower temperature than the PCC-SAA sample and thus have maximum rates occurring at temperatures slightly lower than the PCC-SAA sample. The activation energies for decomposition of CaCO3 obtained commercially or prepared in the laboratory are similar. It should be noted that the PCC-SAA sample has been seen to last longer through continuous calcination-carbonation cycles as compared to the AC sample.11 A window to that phenomenon is observed in the fact that more complete calcination of the CaCO3 was observed for the PCC-SAA sample as compared to the AC sample. Thus, some of the CaCO3 is not accessible in the first cycle and more such protective layers occur with repeated cycles resulting in a loss of capacity for fresh CO2 during the carbonation cycle. This is presumably due to the pore structure which limits the diffusion of CO2 out of the solids and thus the released CO2 is probably recaptured locally inside the pores. Nonetheless, the activation energies of the two samples appear to be close in value. Amongst the iso-conversional methods, Friedman's method yielded Ea values significantly larger (nearly two times) than that obtained from the KSA and FWO methods. In general, the activation energy is found to increase with conversion for PCC-SAA sample while it was found to decrease for the AC sample. Using Malek's method, the mechanism was found to be diffusion mechanism (D2, D3 or D4), reaction controlled with order greater than 1 or follow the Johnson-Mehl-Avrami (JMA) mechanism4548 of random nucleation (n < 1) and finally narrowed to D2 or D4 for evaluating calcination mechanism at lower heating rates for the PCC-SAA sample. At the higher heating rates, the mechanism was identified to be either reaction controlled or follow the JMA kinetics (n > 1) with the latter prevailing for on further analysis. On the other hand, for the AC sample, 3D diffusion process appears to control the calcination of the AC sample. It was concluded that D3 was appropriate for evaluating calcination mechanism at the higher heating rates or D4 at the lower heating rates. Thus, it is observed that there is a clear difference in the mechanism of CaCO3 decomposition due to changes in heating rates for the PCC-SAA sample, although the mechanism for the AC sample appeared to be independent of the heating rate. Frequency factors as function of the conversion was also calculated for both samples. It was observed that diffusion limitations increase with conversion for the AC sample while its impact on the reaction rate decreases for the PCC-SAA sample.
Acknowledgements
Funding for this research was provided by US Department of Energy under contract DE-FC26-00FT40974. The authors also acknowledge GE-EER for their support.
ORCID iD
D. Dasgupta: © orcid.org/0000-0003-2186-8389
References
1 T. Wiltowski, K. Mondal, A. Campen, D. Dasgupta and A. Konieczny, Reaction swing approach for hydrogen production from carbonaceous fuels, Int. J. Hydrogen Energy, 2008, 33, 293-302. [ Links ]
2 R. Barker, The reversibility of the reaction CaCO3 = CaO + CO2 J. Appl. Chem. Biotechnol, 1973, 23, 733-742. [ Links ]
3 M.J., Tinkler and C. Cheh, Towards a coal-capable solid oxide fuel cell system, in Proceedings of the 26th International Technical Conference on Coal Utilization and Fuel Systems, Coal Technology Association, Gaithersburg, Maryland, USA, 2001, pp. 569-570. [ Links ]
4 Y. Kato, D. Saku, N. Harada and Y. Yoshizawa, Utilization of high temperature heat from nuclear reactor using inorganic chemical heat pump, Prog. Nucl. Energy, 1998, 32, 563-570. [ Links ]
5 Y. Kato, N. Harada and Y. Yoshizawa, Kinetic feasibility of a chemical heat pump for heat utilization from high-temperature processes, Appl. Therm. Eng., 1999,19, 239-254. [ Links ]
6 S.K. Bhatia and D.D. Perlmutter, Effect of the product layer on the kinetics of the CO2-Lime reaction, AIChE J, 1983, 29, 79-86. [ Links ]
7 A.J. Dedman and A.J. Owen, Calcium cyanamide synthesis, Part 4. The reaction CaO + CO2 = CaCO3, Trans. Faraday Soc., 1962, 58, 2027-2035. [ Links ]
8 W.G. Oakeson and I.B. Cutler, Effect of CO2 pressure on the reaction with CaO, J. Am. Ceram. Soc., 1979, 62, 556-558. [ Links ]
9 D. Cazorla-Amoros, J.P. Joly, A. Linares-Solano, A. Marcilla-Gomis and C. Salinas-Martinez de Lecea, CO2-CaO surface and bulk reactions: thermodynamic and kinetic approach, J. Phys. Chem., 1991, 95, 6611-6617. [ Links ]
10 D. Mess, A.F. Sarofim and J.P. Longwell, Product layer diffusion during the reaction of calcium oxide with carbon dioxide, Energy, Fuels, 1999, 13, 999-1005. [ Links ]
11 D. Dasgupta, K. Mondal and T. Wiltowski, Robust, high reactivity and enhanced capacity carbon dioxide removal agents for hydrogen pro duction applications, Int. J. Hydrogen Energy, 2008, 33, 303-311. [ Links ]
12 R. Barker, The reactivity of calcium oxide towards carbon dioxide and its use for energy storage, J. Appl. Chem. Biotechnol., 1974,24,221-227. [ Links ]
13 G.P. Curran, C.E. Fink and E. Gorin, CO2 acceptor gasification process: studies of acceptor properties, in F.C. Schorda, ed., Advances in Chemistry, 69, Fuel Gasification, American Chemical Society, Washing ton, USA, 1967, pp. 141-165. [ Links ]
14 H. Gupta and L-S. Fan, Carbonation-calcination cycle using high reactivity calcium oxide for carbon dioxide separation from flue gas, Ind. Eng. Chem. Res., 2002, 41, 4035-4042. [ Links ]
15 B. Balasubramanium, O.A. Lopez, S. Kaytakoglu and D.P. Harrison, Hydrogen from methane in a single-step process, Chem. Eng. Sci., 1999, 54, 3543-3552. [ Links ]
16 L-S. Ying, Y. Suzuki and H. Hatano, Developing an innovative method, HyPr-RING, to produce hydrogen from hydrocarbons, Energy Conv. Manage., 2002, 43, 1283-1290. [ Links ]
17 Z.S. Li and N.S. Cai, Modeling of multiple cycles for sorption-enhanced steam methane reforming and sorbent regeneration in fixed bed reactor, Energy, Fuels, 2007, 21, 2909-2918. [ Links ]
18 D. Alvarez and J.C. Abanades, Determination of the critical product layer thickness in the reaction of CaO with CO2, Ind. Eng. Chem. Res., 2005, 44, 5608-5615. [ Links ]
19 N.A. Rashidi, M. Mohammed and S. Yusup, A study of calcination and carbonation of cockle shell, Int. J. Chem., Mol., Nucl., Mat. Met. Eng., 2011, 5, 1118-1123. [ Links ]
20 A. Silaban and D.P. Harrison, High temperature capture of carbon dioxide: characteristics of the reversible reaction between CaO(s) and CO2(g), Chem. Eng. Comm., 1995,137, 177-190. [ Links ]
21 E. Bouquet, G. Leyssens, C. Schõnnenbeck and P. Gilot, The decrease of carbonation efficiency of CaO along calcination-carbonation cycles: experiments and modeling, Chem. Eng. Sci., 2009, 64, 2136-2146 [ Links ]
22 G.S. Grasa, J. C. Abanades, M. Alonso and B. González, Reactivity of highly cycled particles of CaO in a carbonation/calcination loop, Chem, Eng, J., 2008,137, 561-567. [ Links ]
23 P. Sun, J.R. Grace, C.J. Lim and E.J. Anthony, Determination of intrinsic rate constants of the CaO-CO2 reaction, Chem, Eng, Sci., 2008, 63, 47-56. [ Links ]
24 P. Sun, J.R. Grace, C.J. Lim and E.J. Anthony, A discrete pore size distribution based gas-solid model and its application to the CaO- CO2 reaction, Chem, Eng, Sci., 2008, 63, 57-70. [ Links ]
25 Z. Li, H. Sun and N. Cai, Rate equation theory for the carbonation reaction of CaO with CO2, Energy, Fuels, 2012, 26, 4607-4616. [ Links ]
26 A.G. Okunev, A.S. Nesterenko and A.I., Lysikov, Rates of cycled CaO absorbents, Energy, Fuels, 2008, 22, 1911-1916. [ Links ]
27 I. Zsako and H.E. Arz, Thermal decomposition of calcium carbonate, J. Thermal Anal., 1974, 6, 651. [ Links ]
28 H.S. Ray, The kinetic compensation effect in the kinetics of the thermal decomposition of calcium carbonate, J. Thermal Anal., 1982,24,35. [ Links ]
29 R. Altorfer, Estimation of kinetic parameters from conversion curves, determined at constant heating rate, Thermochim. Acta, 1978, 24, 17. [ Links ]
30 J.M. Criado and J. Morales, Thermal decomposition reactions of solids controlled by diffusion and phase boundary processes: possible misinterpretation of the mechanism from thermogravimetric data, Thermochim. Acta, 1977,19, 305. [ Links ]
31 K.N. Ninan, K. Krishnan and VN. Krishnamurthy, Kinetics and mechanism of thermal decomposition of in situ generated calcium carbonate, J. Thermal Anal., 1991, 37, 1533. [ Links ]
32 I. Halikia, L. Zoumpoulakis, E. Christodoulou and D. Prattis, Kinetic study of the thermal decomposition of calcium carbonate by isothermal methods of analysis, Eur. J. Mineral Process. Environ. Protect., 2001, 1, 89-102. [ Links ]
33 V.N. Zernov, VM. Gropyanov and V.G. Abbakumov, Application of methods of nonisothermal kinetics to thermal decomposition of CaCO3 at constant rate, Zh. Prikl. Khim., 1982, 55, 1493 [ Links ]
34 V. Georgieva, L. Vlaev and K. Gyurova, Non-isothermal degradation kinetics of CaCO3from different origin, J. Chem., 2013, Article ID 872981, 12 pages. [ Links ]
35 H.E. Kissinger, Variation of peak temperature with heating rate in differential thermal analysis. J. Res. Nat. Bureau of Standards, 1956, 57(4), 2712. [ Links ]
36 M.E. Brown, D. Dollimore and A.K. Galwey, Reactions in the solid state, in Comprehensive Chemical Kinetics, (C.H.Bamford and C.F.H. Tipper, eds.), Vol. 22, Elsevier, Amsterdam, Netherlands, 1980. [ Links ]
37 H.L. Friedman, Kinetics of thermal degradation of char-forming plastics from thermogravimetry. Application to phenolic plastic, J. Pol. Sci., 1964, 6C, 183-195. [ Links ]
38 C.D. Doyle, Kinetic analysis of thermogravimetric data, J. Appl. Polym. Sci., 1961, 5, 285-292. [ Links ]
39 T. Ozawa, A new method of analyzing thermogravimetric data, Bull. Chem. Soc. Jpn, 1965, 38, 1881. [ Links ]
40 J.H. Flynn and L.A. Wall, General treatment of the thermogravimetry of polymers, J. Res. Bur. Stand., 1966, 70A, 487-523. [ Links ]
41 P. Budrugeac, A. Luminita Petre and E. Segal, Some problems concerning the evaluation of non-isothermal kinetic parameters of solid-gas decompositions from thermogravimetric data, J. Thermal Anal., 1996,47, 123-134. [ Links ]
42 J. Malek, A Computer program for kinetic analysis of non-isothermal thermoanalytical data, Thermochim. Acta, 1989,138, 337 [ Links ]
43 M. Criado, J. Malek and A. Ortega, Applicability of the master plots in kinetic analysis of non-isothermal data, Thermochim. Acta, 1989, 147, 377-385. [ Links ]
44 T. Akahira and T. Sunose, Method of determining activation deterioration constant of electrical insulating materials, Res. Report Chiba Inst. Technol., 1971, 16, 22-23. [ Links ]
45 W. Johnson and R. Mehl, Reaction kinetics in processes of nucleation and growth, Trans AIME, 1939,135, 416 [ Links ]
46 M. Avrami, Kinetics of phase change. I. General theory, J. Chem. Phys, 1939, 7, 1103-1112. [ Links ]
47 M. Avrami, Kinetics of phase change. II. Transformation-time relations for random distribution of nuclei, J. Chem. Phys., 1940, 8, 212-224. [ Links ]
48 M. Avrami, Kinetics of phase change. III. Granulation, phase change, and microstructure, J. Chem. Phys, 1941, 9, 177-184. [ Links ]
Received 5 February 2019
Revised 7 May 2019
Accepted 7 May 2019
† Deceased.
* To whom correspondence should be addressed. E-mail: deballna@slu.edu

