


Services on Demand
Article
 English (pdf)
 Article in xml format
 Article references
Indicators

Related links
-
 Cited by Google
 -
 Similars in Google
Share

 Permalink
South African Journal of Chemistry
On-line version ISSN 1996-840X
Print version ISSN 0379-4350
S.Afr.j.chem. (Online) vol.72 Durban 2019
http://dx.doi.org/10.17159/0379-4350/2019/v72a14
RESEARCH ARTICLE
Development of a Thiol-capped Core/Shell Quantum Dot Sensor for Acetaminophen
Hanieh Montaseri; Oluwasesan Adegoke; Patricia B.C. Forbes*
Department of Chemistry, Faculty of Natural and Agricultural Sciences, University of Pretoria, Lynnwood Road, Pretoria, 0002, South Africa
ABSTRACT
Acetaminophen (AC) is a frequently used pharmaceutical which has been detected in water systems and is of concern due to its potential environmental impacts. In this study, three quantum dot (QD)-ligand systems, namely L-cysteine (L-cys)-, N-acetyl-L-cysteine (NAC)- and glutathione (GSH)-capped CdSe/ZnS quantum dots, were synthesized and tested for the fluorescence detection of acetaminophen. Among the synthesized aqueous core/shell quantum dots, L-cys-CdSe/ZnS QDs were found to be optimal with high sensitivity for the fluorescence detection of acetaminophen. The L-cys-CdSe/ZnS QDs were of a zinc blende crystal structure and displayed excellent fluorescence intensity and photostability and provided a photoluminescence quantum yield of 77 % . The fluorescence of L-cys-CdSe/ZnS QDs was enhanced by the introduction of AC enabling the development of a fast and simple method for the detection of AC. Under optimal conditions, F-F0 was linearly proportional to the concentration of AC from 3.0-100 nmol L-1 with limits of detection and quantification of 1.6 and 5.3 nmol L-1, respectively. Some related pharmaceutical compounds including epinephrine hydrochloride (EP), L-ascorbic acid (AA), uric acid (UA), dopamine hydrochloride (DA) and 4-aminophenol (4-AP) did not interfere with the sensing of AC. The probe was also successfully applied in the determination of AC in tap and river water matrices.
Keywords: Acetaminophen, FRET, pharmaceuticals, quantum dots, fluorescence spectroscopy.
1. Introduction
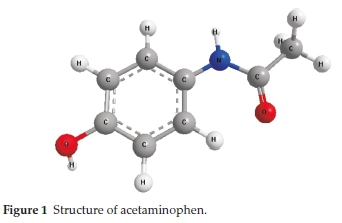
Acetaminophen or paracetamol (N-acetyl-p-aminophenol, Fig. 1) is an acylated aromatic amide with log Kow 0.46,1 which was introduced in 1893 by Von Mering as antipyretic/analgesic medicine. It has a pKa of 9.46,2 with a solubility of 1.4 χ 104 mg L-1 in water at 25 °C.3
Acetaminophen (AC) is frequently prescribed or purchased over the counter, and falls within the pharmaceuticals and personal care products (PPCPs), a subclass of organic contaminants. Studies have shown that a large volume of pharmaceutical compounds is constantly entering the aquatic environment as well as sewers and drains from hospital waste, improper disposal of pharmaceutical waste, and from healthcare and veterinary facilities.4 In spite of the fact that the detected concentrations thereof are low, a wide variety of potential deleterious effects, including acute and chronic toxicity on the aquatic environment5 and accumulation in tissues6 have been reported even at these low levels.
In order to avoid adverse effects of PPCPs to humans, fast and sensitive analytical methods are needed for detecting low concentrations of PPCPs in water systems. AC has been reported to occur within the 6.5-11.8 nmol L-1 range in river waters in South Africa,7,8 while it was detected in Kenyan river waters up to 708.0 nmol L-1.9 The concentration range of AC in water has been found to range from 0.86-1627 nmol L-110,11 in wastewater influent and 0.07-460 nmol L-112 in wastewater effluent.
At present, detection of PPCPs is carried out under laboratory conditions utilizing highly expensive instruments, trained personnel, environmentally unfriendly solvent use and long analysis times. Techniques include high performance liquid chromatography,13 electrochemical analysis14 spectrophoto-metry15 and chemiluminescence.16 To circumvent these issues, simple analytical methods are being developed to detect low concentrations of AC. Among them, optical measurement methods have gained attention due to advantages including high sensitivity, ease of implementation, and generally fast response times.17 Fluorescence techniques are a popular subset of optical methods, which use a fluorophore material as a sensing receptor to detect the analyte(s). Examples of fluorophore nanomaterials are carbon nanoparticles (CNPs), graphene quantum dots (QDs) and semiconductor QDs of the class of group II-VI and III-V.18
QDs comprise a semiconductor core and a shell which protects them against oxidation and photodegradation. In addition, QDs are photo electrochemically active which make them reliable optical labels in environmental analysis.19
Although the core QDs are toxic due to the use of Cd, stabilization thereof with an inorganic shell such as ZnS and also surface coating with a capping agent (e.g. L-cysteine or glutathione) can reduce ion leakage, thereby reducing toxicity in use.20
QD-based sensing applications are due to Fõrster resonance energy transfer (FRET) where QDs serve as donor, and reports of their application as acceptor are less common. The photolumi-nescence (PL) 'turn-on' mode is more desirable compared to the 'turn-off' mode, as many other factors can also induce the PL 'off' state resulting in false positives.21
It has been previously shown that high lattice mismatch (~16 %) between ZnS and CdTe may cause incomplete coating of the core QDs with ZnS which makes the QDs susceptible to degradation.22 Lower lattice mismatch (~12 %) for CdSe and ZnS however, results in less degradation.23 Therefore, CdSe/ZnS QDs are more stable and less toxic than CdTe/ZnS QDs. Moreover, CdSe/ZnS QDs have exhibited the least cytotoxicity and the most biocompatibility with high sensing ability among CdSe, CdSe/ZnS and CdSe/CdS QDs.24
Core/shell QDs have a number of advantageous properties regarding their use as analytical sensors and they have found many applications across disciplines.25,26
Even though AC has been detected by several analytical techniques, there is still a lack of a reliable, fast and cost-effective screening method for this analyte. Herein, three QD-thiol ligand combinations were synthesized and their sensitivity towards AC detection was examined in order to find the optimum QD-ligand system. We then describe a simple turn-on fluorescence detection approach for AC sensing based on L-cys-CdSe/ZnS QDs as these provided the highest sensitivity. Although many studies have been published regarding the application of CdSe/ZnS QDs, there is no study to date regarding their use in the determination of AC in environmental water samples.
2. Experimental Procedures
2.1. Materials
Cadmium oxide (99.5 %), octadec-1-ene (ODE, 90 %), L-cysteine (L-cys, 96 %), sulfur powder (>99.5 %), trioctylphosphine oxide (TOPO, 90 %), zinc oxide (99 %), oleic acid (OA, 90 %), N-acetyl-L-cysteine (NAC, >99 %) and acetaminophen (AC, analytical standard) were purchased from Sigma Aldrich (St. Louis, MO, USA). Epinephrine hydrochloride (EP, 95 %), L-ascorbic acid (AA, reagent grade), dopamine hydrochloride (DA, >98 %), and uric acid (UA, >99 %) and 4-aminophenol (4-AP, 99.9 %) as potential interfering analytes were also purchased from Sigma Aldrich. Methanol (99.5 %), acetone (99.5 %), sulfuric acid (98 %), potassium hydroxide (85 %), chloroform (99 %), glutathione (GSH, >98 %) and selenium powder (99 %) were purchased from Merck (Darmstadt, Germany). Water was provided by an ultrapure Milli-Q Water System (18.0 Q.cm at 25 °C).
2.2. Instrumentation
A Horiba Jobin Yvon Fluoromax-4 spectrofluorometer was employed to record fluorescence emission spectra and UV-vis absorption spectra were taken using a Cary Eclipse (Varian) spectrophotometer.
The PL quantum yields of the QDs in Millipore water were determined as previously reported.27 A PANalytical X'Pert Pro powder diffractometer in Θ-Θ configuration with a X'Celerator detector, variable divergence and receiving slits with Fe filtered Co-Ka radiation (λ = 1.789 A) was used to analyze powder X-ray diffraction (XRD) patterns. IR measurements were obtained from a Spectrum RXI FT-IR System from Perkin Elmer. Transmission electron microscopy (TEM) images were recorded using a JEOL JEM 2100F operated at 200 kV. The particle size distributions of QDs were estimated using ImageJ software (http:// imagej.nih.gov/ij/, U.S. National Institutes of Health [NIH], Bethesda, Maryland, USA). Raman spectra were recorded using a WITec Alpha 300 micro-Raman imaging system with 488 nm excitation laser and CCD detector at room temperature with laser power below 2 mW in order to minimize heating effects. All pH measurements were made with a Metrohm 780 pH-meter that was calibrated with Accsen standards of pH 4.0 and 7.0. Energy dispersive X-ray spectroscopy (EDS) analysis was carried out using a HRSEM integrated EDS Zeiss Crossbeam 540 with software AZtech version 3 by Oxford Instruments. PhotochemCAD was used to compute the Fõrster distance.28
2.3. Fabrication of Water-soluble CdSe/ZnS Core/Shell QDs
A one pot organometallic approach was utilized for the preparation of the CdSe/ZnS core/shell QDs which has previously been reported by our group.27 Conversion of hydrophobic QDs to water-soluble QDs was then carried out by a ligand exchange reaction. A stock solution of thiol ligand-KOH in 40 mL metha-nol was prepared using2gofthiol ligand (L-cys, GSH or NAC) and 3.0 g of KOH with ultrasonication. After purification, the hydrophobic capped CdSe and CdSe/ZnS QDs were re-dispersed separately in chloroform and the ligand exchange solution was added followed by Millipore water. In order to separate the organic phase from the aqueous phase, the solutions were stirred for 1 h. The water-soluble CdSe and CdSe/ZnS QDs were then purified using ethanol and acetone to efficiently remove all hydrophobic capping substituents. The purified water-soluble QDs were finally dried in a fume hood.
2.4. Fluorescence Experiments
1.0 mg of water-soluble CdSe/ZnS QDs was dissolved in 3 mL Millipore water and a standard solution containing a specific amount of AC was added and after 5 min the resulting PL spectrum was determined. The same conditions were applied for all PL measurements: 5 nm slit width was chosen for the excitation and emission of the spectrofluorometer with a 300 nm excitation wavelength. An AC stock solution (1.4 x 10⁻³ mol L-1) was prepared by dissolution of the solid in Millipore water and was diluted to prepare standard solutions. Sensing was carried out as follows: 2 mL of QDs solution was placed in a quartz cuvette followed by addition of 500 of AC standard solution. The PL intensity was taken after 5 min as F and F0 was PL intensity of QDs in 500 of water. A series of F-F0 values were obtained by varying the AC concentration.
Real water samples for fluorescence measurements were collected in pre-cleaned glass bottles from a river and municipal tap in Pretoria, South Africa, and were transported to the laboratory in a cooler box filled with icepacks. The water samples were centrifuged at 4500 rpm for 5 min and filtered using 110 mm pore size filter paper prior to analysis.
3. Result and Discussion
3.1. Comparison of PL Intensity of L-cys-CdSe/ZnS, NAC-CdSe/ZnS and GSH-CdSe/ZnS QDs
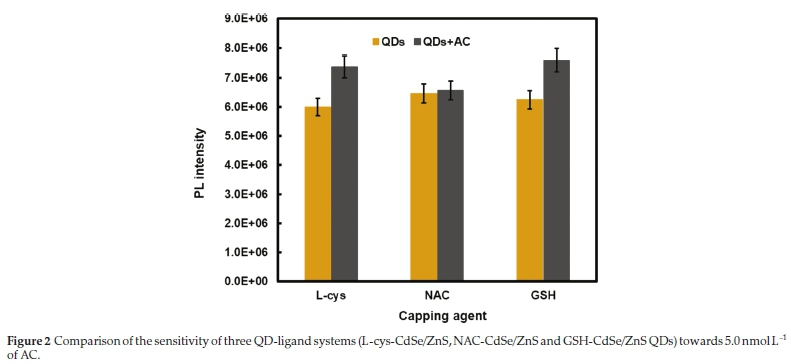
The synthesized CdSe/ZnS QDs capped with three different capping agents, L-cys, NAC and GSH, respectively, were utilized to investigate the optimum QD-ligand system for the determination of AC. The relative fluorescence intensity of the QD-ligand combinations was measured by the amount of enhancement observed for 5.0 nmol L-1 of AC relative to the fluorescence signal of the QDs in the presence of Millipore water. It was observed that the NAC-capped CdSe/ZnS QDs provided the lowest sensitivity while the fluorescence intensities of the L-cys and GSH-CdSe/ZnS QDs were easily influenced by the addition of AC and showed greater sensitivity (Fig. 2). There was a 23 % increase in the relative PL intensity of the L-cys-capped core/shell QDs while only an increase of 2 % was found for the NAC-capped QDs and 21 % for the GSH-capped QDs. In contrast, GSH-CdSe/ZnS QDs were previously found to provide sensitive detection of triclosan by our group.27 In this case, L-cys-CdSe/ZnS QDs provided the most sensitivity and were thus chosen as a fluorescent sensor for the determination of AC and all subsequent characterizations and experiments were performed on L-cys-CdSe/ZnS core/shell QDs.
In a previous study,27 the Fõrster distance was found to be 4.0 nm for the system of GSH-CdSe/ZnS QDs-TCS while this distance in the case of L-Cys- and NAC-CdSe/ZnS QDs for TCS was 7.9 nm and 7.8 nm, respectively. Therefore, GSH-CdSe/ZnS QDs provided higher sensitivity with better energy transfer. In this study, the calculated Fõrster distance for both L-cys- and NAC-CdSe/ZnS QDs for AC target molecules were 6.1 nm (the Fõrster distance of L-cys-CdSe/ZnS QDs-AC system is discussed in Section 3.11). It was therefore concluded that the lower sensitivity of NAC-CdSe/ZnS QDs arose most likely from the structure of NAC which could not efficiently H-bond to AC molecules relative to L-cys for which three H-bonds are possible.
3.2. Optical Characterization of Aqueous L-cys-CdSe and L-cys-CdSe/ZnS QDs
An overlay of the emission and absorption spectra of core and core/shell QDs is shown in Fig. S1. where a characteristic broad absorption and narrow emission peak are evident. Table 1 compares the optical parameters of the water-soluble core and core-shell QDs.
Surface passivation with the ZnS shell increased the size of the core-shell QDs, as evident from the red shift. Stokes shift is one of the most important parameters of semiconductor QDs for the elucidation of their optical properties which is known as the red shift of the emission spectra in respect of the absorption spectra.29 Accordingly, the Stokes shift of L-cys-CdSe and L-cys-CdSe/ZnS QDs were determined to be 30 nm and 15 nm, respectively. The significant fluorescence enhancement of CdSe/ZnS QDs is a result of the influence of the larger band gap induced by the ZnS shell which efficiently traps the electrons in the core, and also due to the removal of dangling surface bonds in the QD core upon addition of the shell (Scheme S1).30
The extinction coefficient of L-cys-CdSe and L-cys-CdSe/ZnS QDs were calculated according to a published method.31 The concentrations of L-cys-CdSe and L-cys-CdSe/ZnS QDs in Milli-pore water can be therefore calculated from the Beer-Lambert law.
The calculated emission band gap values for the synthesized QDs were calculated to be 2.18 and 2.09 nm for L-cys-CdSe and L-cys-CdSe/ZnS QDs, respectively. The PLQY of core/shell QDs increased dramatically due to the passivation of surface vacancies and non-radiative recombination sites after coating with the ZnS shell.32 A red shift of 26 nm was observed in the PL emission of L-cys-CdSe/ZnS QDs in comparison to the L-cys-CdSe core at the optimum excitation wavelengths, which is due to the formation of the shell layer. The strong PL band with narrow FWHM of L-cys-CdSe/ZnS QDs provides evidence for the formation of a uniform particle distribution.24
3.3. Structural and Composition Characterization of L-cys-capped Core/Shell QDs
EDS analysis was performed to prove the presence of the metal components in the structure of the L-cys-CdSe and L-cys-CdSe/ ZnS QDs (Fig. S2). The signals of Cd and Se were found in the core while the presence of Zn and S in the core/shell QDs confirmed the addition of the ZnS shell on the core. In the EDS spectra additional C, N and O signals arose from the capping ligand L-cys. For these core QDs, the capping agent also resulted in a S signal.
The X-ray diffraction patterns of L-cys-CdSe and L-cys-CdSe/ ZnS QDs were compared. Fig. S3 indicates a typical zinc blende crystal structure with planes at {111}; 2Θ = 31.56, {220}; 2Θ = 52.71 and {311}; 2Θ = 62.74 for CdSe/ZnS QDs. The peaks for CdSe QDs were at 29.57°, 49.18° and 58.44° corresponding to {111}, {220} and {311} according to the standard JCPDS (Card No.19-0191) of bulk cubic CdSe. The diffraction peaks for the CdSe/ZnS QDs were shifted slightly to higher Bragg angles compared to the CdSe core. The broadening of the diffraction peak can also be attributed to the nano-sized dimensions of the nanocrystals.33 The zinc blende crystal structure was still predominant for CdSe QDs but with weaker diffraction peaks compared to CdSe/ZnS QDs.
FT-IR analysis allowed for the characterization of the functional groups on the surface of the QDs (Fig. 3). Functional groups and IR absorption bands of L-cys-CdSe and L-cys-CdSe/ZnS QDs are summarized in Table S1. Carboxylic acid and amino groups were found on the surface of the L-cys capped CdSe/ZnS and CdSe QDs while the S-H group vibration was absent on the surface of the QDs, which is attributed to the formation of ZnS onto the surface of the core, and core/shell QDs.

3.4. Raman Analysis
The Raman spectra of L-cys CdSe and L-cys-CdSe/ZnS QDs are shown in Fig. S4. Generally, nanomaterials with small dimensions from group II-VI show broad spectra. The Raman lines of the CdSe core illustrate longitudinal optical LO and 2LO phonons in the region of 200 cm-1 and 400 cm-1, respectively while a weaker mode of the second-order transverse acoustic (TA) appeared at around 103 cm-1.34 This multi phonon scattering in semiconductor QDs is characteristic of the resonantly excited Raman processes.35 The Raman lines of LO and 2LO phonons in CdSe/ZnS QDs are located at around 190.5 cm-1 and 577 cm-1, respectively. Moreover, the LO line of the ZnS shell was observed at about 300 cm-1. The D-band at 1350 cm-1 confirms the presence of disorder in sp2-hybridized carbon systems and the G-band (1580 cm-1) arises from the stretching of the C-C bond of all pairs of sp2-hybridized carbon atoms in both the rings and chains,36 which are evidence of the presence of graphitic carbon from L-cys.
3.5. Comparison of Particle Size of the Water-soluble L-cys-CdSe/ZnS QDs
The particle size of L-cys-capped core and core/shell QDs were estimated by using three approaches including first excitonic absorption peak, XRD and TEM (Table 2).

The particle size of the L-cys-CdSe and L-cys-CdSe/ZnS QDs determined from the first excitonic absorption peak using a published method31 and the average crystallite size of the L-cys-CdSe and L-cys-CdSe/ZnS QDs were estimated from the Debye Scherrer's equation.37 The average particle size of the core/shell QDs shows that each particle of the synthesized L-cys-CdSe/ZnS QDs consists of two or more individual crystallites.
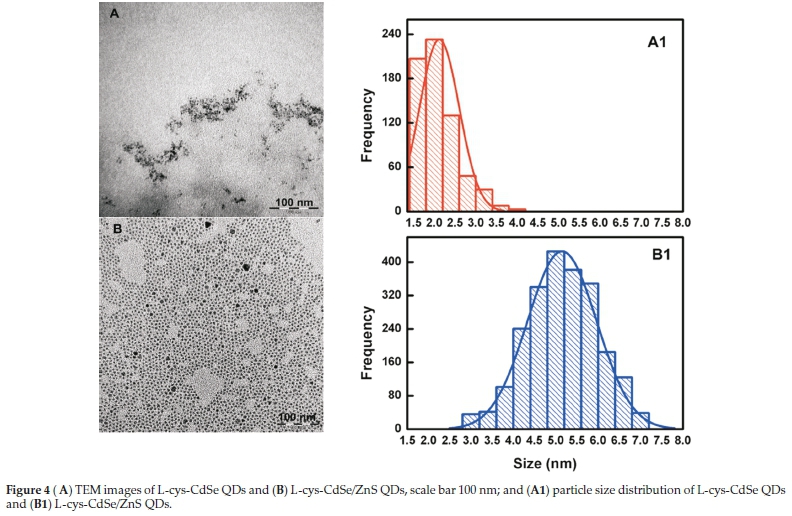
In addition, the average particle size distributions ± standard deviation of the QDs were estimated to be 2.1 ± 0.5 and 5.1 ± 0.8 nm for L-cys-CdSe and L-cys-CdSe/ZnS QDs, respectively from the TEM micrographs, which were in agreement with the sizes estimated from the first excitonic absorption peak. As an indirect approach38 the shell thickness of ZnS was calculated to be 1.5 nm. The morphological display of the QDs showed that they were nearly homogenous in nature, monodispersed and also spherical in shape (Fig. 4A,B). TEM also showed narrow particle size distributions for L-cys-CdSe and L-cys-CdSe/ZnS QDs with a standard deviations below 1 % (Fig. 4A1-B1).
3.6. Fluorescence Properties of AC
The possible influence of AC on the PL spectrum of L-cys-CdSe/ZnS QDs was evaluated by recording its PL using different excitation wavelengths as AC itself fluoresces. The highest emission intensity was around 400 nm at the excitation wavelength of 300 nm (Fig. S5). FRET is therefore a possible mechanism for the fluorescence enhancement noted upon interaction of AC with the QDs, because there are overlapping bands between the absorption spectrum of the QDs and the emission spectrum of AC in the range 350-650 nm.
3.7. Investigation of Photostability
The fluorescence intensity of L-cys-CdSe/ZnS QDs in Millipore water increased over time and became stable after 24 h. No major changes in the fluorescence intensity of 1.0 mg3.0 mL-1 QD solutions were noted even after storage for 5 days in solution under ambient light conditions (Fig. S6) although the band gap of the L-cys-CdSe/ZnS QDs decreased which can be seen from the red shift in the PL emission of the QDs. Aggregation can induce such a red shift in the QD fluorescence which would also be accompanied by PL quenching. The slight decrease in fluorescence intensity between day 1 to day 5 may also be due to desorption of L-cys from the surface of CdSe/ZnS QDs, as L-cys acts as a surface passivating agent, which eliminates surface defects.39 Subsequent analytical measurements were thus performed after the fluorescence intensity of QDs had become stable after one day.
3.8. Optimization of Aqueous L-cys-CdSe/ZnS QD Concentration and Incubation Time
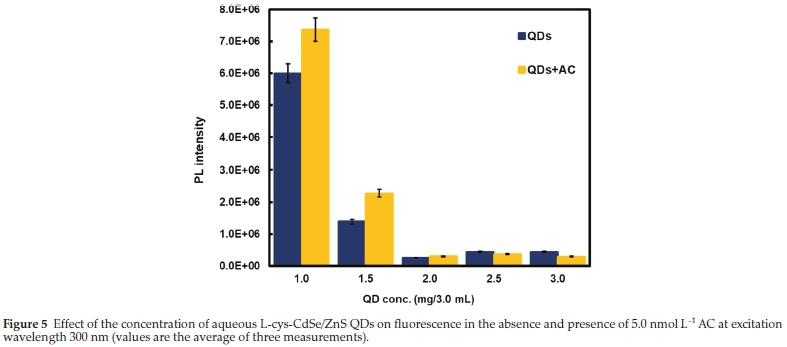
Taking into consideration that the concentration of QDs can influence the fluorescence intensity, different concentrations of L-cys-CdSe/ZnS QDs (1.0, 1.5, 2.0, 2.5, and 3.0 mg in 3.0 mL water) were prepared and 5.0 nmol L-1 of AC was added to each. Briefly, 500 of a fixed concentration of AC was added to 2 mL of each concentration of QDs and the fluorescence intensity was recorded after 5 min. It was observed that the sensitivity reduced at high concentrations of water-soluble L-cys-CdSe/ZnS QDs likely due to self-quenching or agglomeration effects, whereas very low concentrations of QDs led to a narrowing of the linear range. The optimum concentration of 1.0 mg of L-cys-CdSe/ZnS QDs in 3.0 mL water was found, indicating an increase in the interaction of AC with QDs in solution (Fig. 5).
In order to determine the optimum interaction time of L-cys-CdSe/ZnS QDs with AC, the fluorescence intensity of the system was examined at different time intervals in the presence of 5.0 nmol L-1 AC (Fig. S7). The data obtained showed the highest fluorescence enhancement after 5 min incubation time and thereafter a quenching effect of the PL intensity of the QDs was observed after 10 min, indicating a potential reversible interaction. The results show that although AC can be detected within 5 to 35 min of incubation time, a shorter incubation time is more effective.
3.9. Influence of AC on the Fluorescence Behaviour of L-cys-CdSe/ZnS QDs
Under optimal conditions (i.e. 1.0 mg 3.0 mL-1 of L-cys-CdSe/ ZnS QDs and 5 min as incubation time), the introduction of acetaminophen to the L-cys-CdSe/ZnS QDs solution led to luminescence enhancement (Fig. 6A). This signal enhancement could be due to FRET from analyte which served as donor to QDs. The emission of the acceptor enhances and simultaneously the luminescence of the donor quenches. In this case, due to the weak fluorescence intensity of the AC, the quenching of AC fluorescence could not be seen in Fig. 6A.
3.10. Analytical Figures of Merit
The fluorescence calibration curve of F-F0versus AC concentration is illustrated in Fig. 6B, where F and F0 are the fluorescence intensities of the QDs in the presence and absence of different concentrations of acetaminophen, respectively. A good linear relationship between F-F0 and [AC] was found from 3.0-100 nmol L-1 at an emission wavelength of 595 nm (r2 = 0.99). Thus, AC can be sensed fluorescently using this method.
The limit of detection (LOD) and quantification (LOQ) are defined as 3d/m and 10d/m, respectively, where δ is the standard deviation of blank measurement (with n = 10) and m is the slope of the calibration curve. LOD and LOQ were found to be 1.6 nmol L-1 and 5.3 nmol L-1, respectively. The data thus revealed that the proposed method is suitable for the determination of AC at environmentally relevant levels. The LOD value is lower than the guidance value of 1.3 x 10³ nmol L-1 (or 200 ppb) for acetaminophen in drinking water given by the Department of Health in Minnesota.40
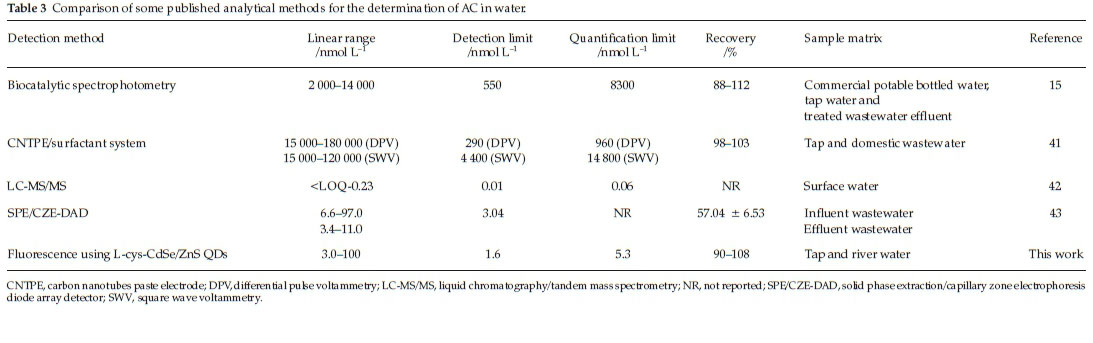
The linear range and detection limit of some other methods for the detection of AC in water samples are summarized in Table 3 for comparison purposes. The results indicate the potential of our sensor for detecting the low concentrations of AC typically present in water samples.
3.11. Proposed Mechanism
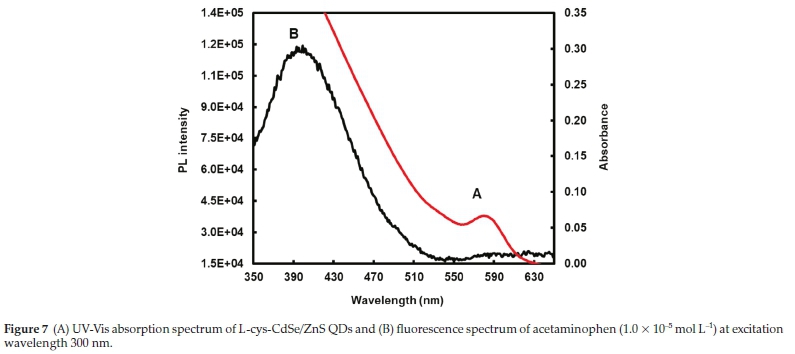
In theory, Fõrster resonance energy transfer (FRET) is a non-radiative process and if the emission spectra of target compounds overlap with the absorption spectra of the QDs, energy transfer from the analyte to the QDs could occur upon excita-tion.44 In this study, the absorption spectrum of L-cys-CdSe/ZnS QDs at 430-650 nm (the highest absorbance is at 580 nm) (Fig. 7A) overlaps with the emission spectrum of acetaminophen at 350-650 nm (Fig. 7B). Hence the QDs can absorb the emission energy from acetaminophen resulting in the enhancement of the PL emission of QDs, which was also found experimentally.
Scheme 1 shows the enhancement mechanism of the QDs in the presence of the AC via FRET. The electrons of AC can absorb energy resulting in an excited state. When the excited electron of AC returns to the ground state, the electrons of the QDs can transit to the excited states due to the polar-polar resonance of the donor acceptor. The coupled transitions result in quenching of the fluorescence of donor (AC molecules) and enhancement in fluorescence intensity of the acceptor (L-cys-CdSe/ZnS QDs).45
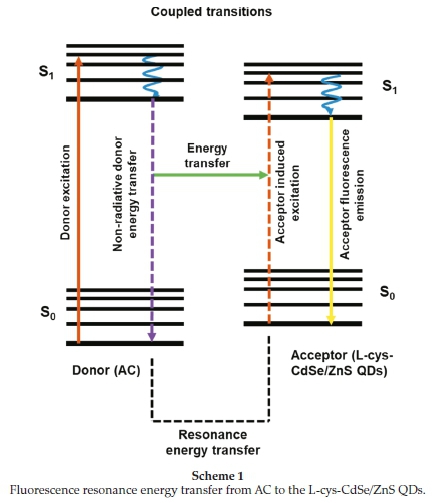
The distance between donor and acceptor is also a critical parameter of FRET processes since FRET depends on the donor quantum yield and will occur over a limited distance (Fõrster distance (A)) when the overlap between the emission spectrum of the donor and the absorption spectrum of the acceptor is greater than 30 % and the distance is less than 10 nm.46 The Fõrster distance in the L-cys-CdSe/ZnS QDs-AC system was found to be 6.1 nm which meets this distance requirement for FRET to occur.
3.12. Effect of Potential Interfering Analytes on the Fluorescence of L-cys-CdSe/ZnS QDs
The possible influence of other related pharmaceutical analytes was assessed under optimum conditions of 2 mL of 1.0 mg 3.0 mL-1 L-cys-CdSe/ZnS QDs and 5 min equilibrium time. Although the photoluminescence intensity of the L-cys-CdSe/ZnS QDs was slightly enhanced in the presence of these pharmaceutical analytes (Fig. 8), it is clear that the prototype QD probe is the most sensitive to AC which provided the highest relative fluorescence intensity whereas the other analytes investigated did not produce as significant a fluorescence enhancement with the QDs (Table S2). These compounds therefore do not interfere significantly with the detection of AC.
The selectivity of the QDs sensor could be enhanced by the application of a surface molecularly imprinted polymer, for example, should other structurally related compounds be found to interfere with the detection of AC.
3.13. Sensing Application
The method was applied to AC in water from a river and tap to investigate the effectiveness of the fluorescence sensor for AC determinations in real samples. As can be seen from Table 4, the recoveries of different known amounts of AC spiked in both types of water ranged from 95 to 108 % and 90 to 108 %, respectively. The fluorescence sensing method developed in this study was thus found to be practical and reliable for the determination of AC in the aqueous environment.
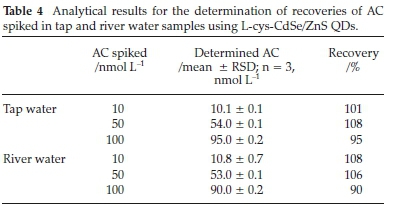
Regarding the effect of pH, the average three replicate pH value of L-cys-CdSe/ZnS QDs in Millipore water was 7.6 while after addition of 500 of tap or river water into 2 mL of L-cys-CdSe/ZnS QDs solution (containing 0.67 mg of L-cys-CdSe/ZnS QDs), the pH values changed to 7.1 and 7.5, respectively. Therefore, no significant pH changes took place upon addition of real water samples to the L-cys-CdSe/ZnS QDs solution and the effect of sample pH can consequently be considered negligible. HPLC-MS/MS analysis confirmed that AC was not found in tap and river water samples prior to spiking. Therefore, different amounts of AC were spiked to tap and river water samples in order to investigate the applicability of the method.
4. Conclusion
A comparison study was performed by applying three water-soluble L-cys, NAC and GSH functionalized CdSe/ZnS QDs to optimize a QD-ligand system for acetaminophen fluorescence sensing. L-cys-CdSe/ZnS QDs were selected due to their enhanced sensitivity for use as a fluorescence sensor for the determination of acetaminophen in water for the first time. The operating mechanism of the designed probe was based on the fluorescence 'turn-on' mode. Advantages of this method include its simplicity, as well as stability and resistivity of QDs against photobleaching under ambient light conditions. Under optimum conditions, with the addition of acetaminophen to QDs in aqueous solution, the original PL intensity of the QDs was enhanced most likely due to fluorescence resonance energy transfer from analytes to QDs which was found to be linear within the concentration range of 3.0-100 nmol L-1 AC with detection and quantification limits of 1.6 and 5.3 nmol L-1, respectively. The method could therefore be applied to detect AC at environmentally relevant nanomolar concentrations.
Acknowledgements
Research funding from the University of Pretoria, the Water Research Commission (Grant K5/2438/1 and K5/2752) as well as the Photonics Initiative of South Africa (Grant PISA-15-DIR-06) is gratefully acknowledged. We also thank the Microscopy and Microanalysis Laboratory of the University of Pretoria, for assistance with microscopy measurements and Wiebke Grote of UP for the XRD measurements.
Supplementary Material
Supplementary information is provided in the online supplement.
ORCID iDs
H. Montaseri: orcid.org/0000-0002-6433-9594 P.B.C. Forbes: orcid.org/0000-0003-3453-9162
References
1 P. Westerhoff, Y. Yoon, S. Snyder and E.C. Wert, Fate of endocrine-disruptor, pharmaceutical, and personal care product chemicals during simulated drinking water treatment processes, Environ. Sci. Technol., 2005, 39, 6649-6663. [ Links ]
2 Y. Ishihama, M. Nakamura, T. Miwa, T. Kajima and N. Asakawa, A rapid method for pKa determination of drugs using pressure-assisted capillary electrophoresis with photodiode array detection in drug discovery, J. Pharm. Sci., 2002, 91, 933-942. [ Links ]
3 A. Achilleos, M. Ines Vasquez Hadjilyra, E. Hapeshi, C. Michael, S.M. Monou, M. and D. Fatta Kassinos, presented in part at the International Conference on the Protection and Restoration of the Environment IX, Kefalonia, Greece, 29 June - 03 July 2008. [ Links ]
4 K.H. Langford and K.V. Thomas, Determination of pharmaceutical compounds in hospital effluents and their contribution to waste-water treatment works, Environ. Int., 2009, 35, 766-770. [ Links ]
5 M. Crane, C. Watts and T. Boucard, Chronic aquatic environmental risks from exposure to human pharmaceuticals, Sci. Total Environ., 2006, 367, 23-41. [ Links ]
6 M.M. Schultz, E.T. Furlong, D.W. Kolpin, S.L. Werner, H.L. Schoen-fuss, L.B. Barber, V.S. Blazer, D.O. Norris and A.M. Vajda, Antidepres-sant pharmaceuticals in two US effluent-impacted streams: occurrence and fate in water and sediment, and selective uptake in fish neural tissue, Environ. Sci. Technol., 2010,44, 1918-1925. [ Links ]
7 S. Matongo, G. Birungi, B. Moodley and P. Ndungu, Occurrence of selected pharmaceuticals in water and sediment of Umgeni River, KwaZulu-Natal, South Africa, Environ. Sci. Pollut. Res. Int., 2015, 22, 10298-10308. [ Links ]
8 S. Matongo, G. Birungi, B. Moodley and P. Ndungu, Pharmaceutical residues in water and sediment of Msunduzi River, Kwazulu-Natal, South Africa, Chemosphere, 2015,134, 133-140. [ Links ]
9 O. K'Oreje, K.L. Vergeynst, D. Ombaka, P. De Wispelaere, M. Okoth, H. Van Langenhove and K. Demeestere, Occurrence patterns of pharmaceutical residues in wastewater, surface water and ground-water of Nairobi and Kisumu city, Kenya, Chemosphere, 2016, 149, 238-244. [ Links ]
10 M. Gros, M. Petrovic and D. Barcelo, Development of a multi-residue analytical methodology based on liquid chromatography-tandem mass spectrometry (LC-MS/MS) for screening and trace level determination of pharmaceuticals in surface and wastewaters, Talanta, 2006, 70, 678-690. [ Links ]
11 M.J. Gómez, M.J.M. Bueno, S. Lacorte, A.R. Fernández-Alba and A. Agüera, Pilot survey monitoring pharmaceuticals and related compounds in a sewage treatment plant located on the Mediterranean coast, Chemosphere, 2007, 66, 993-1002. [ Links ]
12 P.H. Roberts and K.V Thomas, The occurrence of selected pharmaceuticals in wastewater effluent and surface waters of the lower Tyne catchment, Sci. Total Environ., 2006, 356, 143-153. [ Links ]
13 Ç. Dinç, O.A. Dõnmez, B. Aşçi and A.E. Bozdogan, Chromatographic and chemometrics-assisted spectrophotometric methods for the simultaneous determination of allobarbital, adiphenine hydrochlo-ride, and paracetamol in suppository, J. Liq. Chromatogr. Relat. Technol., 2014, 37, 560-571. [ Links ]
14 B. Zheng, C. Li, Y. Li, Y. Gu, X. Yan, L. Tang, R. Chen and Z. Zhang, One-step electrochemical preparation of a reduced graphene oxide/ poly (sulfosalicylic acid) nanocomposite film for detection of acetaminophen and its application in human urine and serum studies, Anal. Methods, 2015, 7, 8248-8254. [ Links ]
15 A. Méndez-Albores, C. Tarín, G. Rebollar-Pérez, L. Dominguez-Ramirez and E. Torres, Biocatalytic spectrophotometric method to detect paracetamol in water samples, J. Environ. Sci. Health A., 2015, 50, 1046-1056. [ Links ]
16 D. Easwaramoorthy, Y.-C. Yu and H.-J. Huang, Chemiluminescence detection of paracetamol by a luminol-permanganate based reaction, Anal. Chim. Acta, 2001, 439, 95-100. [ Links ]
17 L. Yuan, W. Lin, K. Zheng, L. He and W. Huang, Far-red to near infrared analyte-responsive fluorescent probes based on organic fluorophore platforms for fluorescence imaging, Chem. Soc. Rev., 2013, 42, 622-661. [ Links ]
18 Q. Liu, Q. Zhou and G. Jiang, Nanomaterials for analysis and monitoring of emerging chemical pollutants, Trends Anal. Chem., 2014, 58, 10-22. [ Links ]
19 R. Gill, M. Zayats and I. Willner, Semiconductor quantum dots for bioanalysis, Angew. Chem. Int. Ed., 2008, 47, 7602-7625. [ Links ]
20 Y. Su, Y. He, H. Lu, L. Sai, Q. Li, W. Li, L. Wang, P. Shen, Q. Huang and C. Fan, The cytotoxicity of cadmium based, aqueous phase-synthesized, quantum dots and its modulation by surface coating, Biomaterials, 2009, 30, 19-25. [ Links ]
21 H. Xu, R. Miao, Z. FangandX. Zhong, Quantum dot-based"turn-on" fluorescent probe for detection of zinc and cadmium ions in aqueous media, Anal. Chim. Acta, 2011, 687, 82-88. [ Links ]
22 S. Ithurria, P. Guyot-Sionnest, B. Mahler and B. Dubertret, Mn2+ as a radial pressure gauge in colloidal core/shell nanocrystals, Phys. Rev. Lett., 2007, 99, 265501. [ Links ]
23 K.T. Yong, W.C. Law, I. Roy, Z. Jing, H. Huang, M.T. Swihart and P.N. Prasad, Aqueous phase synthesis of CdTe quantum dots for biopho- tonics, J. Biophotonics., 2011,4, 9-20. [ Links ]
24 R.K. Ratnesh and M.S. Mehata, Investigation of biocompatible and protein sensitive highly luminescent quantum dots/nanocrystals of CdSe, CdSe/ZnS and CdSe/CdS, Spectrochim. Acta A. Mol. Biomol. Spectrosc., 2017,179, 201-210. [ Links ]
25 A.J. Nozik, M.C. Beard, J.M. Luther, M. Law, R.J. Ellingson and J.C. Johnson, Semiconductor quantum dots and quantum dot arrays and applications of multiple exciton generation to third-generation photovoltaic solar cells, Chem. Rev., 2010,110, 6873-6890. [ Links ]
26 H. Huang and J.-J. Zhu, The electrochemical applications of quantum dots, Analyst, 2013, 138, 5855-5865. [ Links ]
27 H. Montaseri and P.B. Forbes, A triclosan turn-ON fluorescence sensor based on thiol-capped core/shell quantum dots, Spectrochim. Acta A. Mol. Biomol. Spectrosc., 2018, 204, 370-379. [ Links ]
28 H. Du, R.C.A. Fuh, J. Li, L. A. Corkan and J.S. Lindsey, Photochem- CAD: a computer-aided design and research tool in photochemistry, Photochem. Photobiol, 1998, 68, 141-142. [ Links ]
29. A. Bagga, P.K. Chattopadhyay and S. Ghosh, Stokes shift in quantum dots: origin of dark exciton, Physics of Semiconductor Devices, 2007. IWPSD 2007. International Workshop on, IEEE, 2007, pp. 876-879. [ Links ]
30 O. Adegoke, T. Nyokong and P.B.C. Forbes, Structural and optical properties of alloyed quaternary CdSeTeS core and CdSeTeS/ZnS core-shell quantum dots, J. Alloys Compd., 2015, 645, 443-449. [ Links ]
31 W.W. Yu, L. Qu, W. Guo and X. Peng, Experimental determination of the extinction coefficient of CdTe, CdSe, and CdS nanocrystals, Chem. Mater., 2003,15, 2854-2860. [ Links ]
32 B.O. Dabbousi, J. Rodriguez-Viejo, F.V. Mikulec, J.R. Heine, H. Mattoussi, R. Ober, K.F. Jensen and M.G. Bawendi, (CdSe) ZnS core-shell quantum dots: synthesis and characterization of a size series of highly luminescent nanocrystallites, J. Phys. Chem. B., 1997, 101, 9463-9475. [ Links ]
33 O. Adegoke, M.-W. Seo, T. Kato, S. Kawahito and E.Y. Park, Gradient band gap engineered alloyed quaternary/ternary CdZnSeS/ZnSeS quantum dots: an ultrasensitive fluorescence reporter in a conjugated molecular beacon system for the biosensing of influenza virus RNA, J. Mater. Chem. B., 2016, 4, 1489-1498. [ Links ]
34 A.V. Baranov, Y.P. Rakovich, J.F. Donegan, T.S. Perova, R.A. Moore, D.V. Talapin, A.L. Rogach, Y. Masumoto and I. Nabiev, Effect of ZnS shell thickness on the phonon spectra in CdSe quantum dots, Phys. Rev. B., 2003, 68, 165306. [ Links ]
35 M. Klein, F. Hache, D. Ricard and C. Flytzanis, Size dependence of electron-phonon coupling in semiconductor nanospheres: the case of CdSe, Phys. Rev. B., 1990, 42, 11123-11132. [ Links ]
36 S.N. Alam, N. Sharma and L. Kumar, Synthesis of graphene oxide (GO) by modified hummers method and its thermal reduction to obtain reduced graphene oxide (rGO), Graphene, 2017, 6, 1-18. [ Links ]
37 D.K. Gupta, M. Verma, K. Sharma and N.S. Saxena, Synthesis, characterization and optical properties of CdSe/CdS and CdSe/ZnS core-shell nanoparticles, Indian J. Pure Appl. Phys., 2017, 55, 113-121. [ Links ]
38 C.-T. Cheng, C.-Y. Chen, C.-W. Lai, W.-H. Liu, S.-C. Pu, P.-T. Chou, Y.-H. Chou and H.-T. Chiu, Syntheses and photophysical properties of type-II CdSe/ZnTe/ZnS (core/shell/shell) quantum dots, J. Mater. Chem., 2005, 15, 3409-3414. [ Links ]
39 M. Koneswaran and R. Narayanaswamy, L-Cysteine-capped ZnS quantum dots based fluorescence sensor for Cu2+ ion, Sens. Actuators B. Chem., 2009,139, 104-109. [ Links ]
40 Toxicological Summary for: Acetaminophen. (2010). Retrieved from www.health.state.mn.us/divs/eh/risk/guidance/dwec/sumacetamin.pdf, accessed February 2018. [ Links ]
41 F.A. Gorla, E.H. Duarte, E.R. Sartori and C.R.T. Tarley, Electrochemical study for the simultaneous determination of phenolic compounds and emerging pollutant using an electroanalytical sensing system based on carbon nanotubes/surfactant and multivariate approach in the optimization, Microchem. J., 2016, 124, 65-75. [ Links ]
42 C.D.S. Pereira, L.A. Maranho, F.S. Cortez, F.H. Pusceddu, A.R. Santos, D.A. Ribeiro, A. Cesar and L.L. Guimarães, Occurrence of pharmaceuticals and cocaine in a Brazilian coastal zone, Sci. Total Environ., 2016, 548, 148-154. [ Links ]
43 L. Capka, P. Lacina and M. Vavrova, Development and application of SPE/CZE method for detection and determination of selected non-steroidal anti-inflammatory drugs in wastewater, Fresen. Environ. Bull., 2012, 21, 3312-3317. [ Links ]
44 K.E. Sapsford, L. Berti and I.L. Medintz, Materials for fluorescence resonance energy transfer analysis: beyond traditional donor-acceptor combinations, Angew. Chem. Int. Ed., 2006, 45, 4562-4589. [ Links ]
45 X. Wang, J. Yu, Q. Kang, D. Shen, J. Li and L. Chen, Molecular imprinting ratiometric fluorescence sensor for highly selective and sensitive detection of phycocyanin, Biosens. Bioelectron., 2016, 77, 624-630. [ Links ]
46 M. Elangovan, R. Day and A. Periasamy, Nanosecond fluorescence resonance energy transfer-fluorescence lifetime imaging microscopy to localize the protein interactions in a single living cell, J. Microsc., 2002, 205, 3-14. [ Links ]
Received 19 November 2018
Revised 24 April 2019
Accepted 5 June 2019
* To whom correspondence should be addressed. E-mail: patricia.forbes@up.ac.za
Supplementary Data
The supplementary data is available in pdf: [Supplementary data]

