


Services on Demand
Article
 English (pdf)
 Article in xml format
 Article references
Indicators

Related links
-
 Cited by Google
 -
 Similars in Google
Share

 Permalink
South African Journal of Chemistry
On-line version ISSN 1996-840X
Print version ISSN 0379-4350
S.Afr.j.chem. (Online) vol.71 Durban 2018
http://dx.doi.org/10.17159/0379-4350/2018/v71a15
RESEARCH ARTICLE
Development and validation of an ecofriendly chemiluminescence method for the determination of citalopram in pharmaceutical preparations using Cu2+-grafted Oxidized multiwall carbon nanotubes
Muhammad Naeem KhanI, II, *; Rainaz BegumIII; Zarbad ShahI; Sang Hak LeeI, IV
IDepartment of Chemistry, Kyungpook National University, Daegu, 702-701, South Korea
IIDepartment of Chemistry, Bacha Khan University, Charsadda, Pakistan
IIIInstitute of Chemical Sciences, University of Peshawar, Pakistan
IVKorea Basic Science Institute Daegu Center, Daegu 702-701, South Korea
ABSTRACT
A novel and sensitive chemiluminescence (CL) method was developed and validated for the determination of Citalopram in bulk dosage form and in pharmaceutical preparations. The method is based on the use of Cu2+-grafted oxidized multiwall carbon nanotubes (Cu/ox-MWCNTs). The weak CL signal arising from the reaction of an alkaline luminol-H2O2 system was significantly enhanced by the addition of citalopram in the presence of ox-MWCNTs/Cu2+. Furthermore, ox-MWCNTs/Cu2+ exhibited exceptional catalytic activity towards the oxidation of luminol in the luminol-H2O2 CL reaction. Multiwalled carbon nanotubes (MWCNTs) were characterized by scanning electron microscopy (SEM), which also showed the attachment of Cu2+ to MWCNTs. Various factors affecting CL intensity were carefully investigated and optimized for citalopram quantitation. The CL intensity was proportional to citalopram concentration in the range 0.2-8.0 mL-1, with a correlation coefficient of 0.996. The limit of detection (LOD) and limit of quantification were 2.29 X 10⁻⁵ mL-1 and 7.64 X 10⁻⁵ mL-1, respectively, and its reproducibility was satisfactory with a relative standard deviation (RSD) of 2.59 % (n = 5). The interference effects of common excipients were studied, and the developed method was effectively applied for the determination of citalopram in pure form and in pharmaceutical preparations. Percentage recoveries were calculated and ranged from 98.67 to 101.46 % for the pure form and from 97.38 to 101.72 % for pharmaceutical preparations.
Keywords: Chemiluminescence, Citalopram, Luminol, oxidized multiwall carbon nanotubes.
1. Introduction
Citalopram (CIT; 1- (3-dimethylaminopropyl)-1-(4-fluoro-phenyl)-1, 3-dihydroisobezofuran-5-carbonitrile)1 is a second generation selective serotonin reuptake inhibitor, which belongs to the group of drugs known as antidepressants. CIT has broad-spectrum therapeutic activity against depression, anxiety, and obsessive and impulse control disorders.2,3 It has also been reported to reduce the symptoms of diabetic neuropathy and premature ejaculation 4,5, and may be effective for the treatment of post-stroke pathological crying.6
CIT is normally taken as a single daily dose in the morning or evening with or without food. Food does not increase the absorption of CIT but helps to prevent nausea. In the therapeutic dose range, CIT is safe and well tolerated. Recommended doses range from 20 to 40 mg daily, which results in a plasma concentration range from 30-130 ng mL-1.7 Overdosage may cause drowsiness, vomiting, dizziness, sweating, nausea, coma, confusion, and heartbeat anomalies.8
Citalopram is absorbed by cytochrome P to its demethylated metabolites, desmethylcitalopram and didesmethylcitalopram. Desmethylcitalopram is the chief metabolite and can also prevent 5-HT reuptake, but is less potent than citalopram.9 Until recently, citalopram was sold as a racemic mixture, consisting of 50 % R-(-)-citalopram and 50 % S-(+)-citalopram, but as the S-(+)-enantiomer has the desired antidepressive effect10,itwas recently introduced under the generic name escitalopram.
Various analytical techniques have been developed to determine citalopram levels in commercial formulations and biological samples. These include gas chromatographic, gas chromato-graphic/mass spectrometric (GC/MS)11,12, high performance liquid chromatographic (HPLC) with fluorescence13-16,UV16-18, and MS detectors 19,20, and electrophoretic methods.21-26 Spectro-fluorimetric27-30 and spectrophotometric31-33 methods have also been reported for the citalopram determination in pharmaceutical formulations. Few CL methods have been recently reported for the determination of citalopram in pharmaceutical preparations and biological samples.34,35
Chemiluminescence (CL) is a powerful analytical technique with widespread applications in numerous fields because of its high sensitivity, rapidity, wide linear range, high signal to noise ratios (due to the absence of a light source), instrumental simplicity and affordability, and the comparative absence of toxic effects.36-41
On the other hand, carbon nanotube (CNT) materials are attracting considerable research interest. In particular, in addition to being small sizes, CNTs have huge surface areas, hollow or layered structures, high mechanical strengths, and significant electrical conductivities. These properties are of interest in various applications, such as, field emission, reinforcing materials for composites, nanoprobes, and chemical sensors.42-46 CNTs are available as singled-walled carbon nanotubes or multiwall carbon nanotubes (MWCNTs) according to the number of layers carbon atom in their walls. Furthermore, when MWCNTs are treated with a mixture of H2SO4 and HNO3, carboxyl groups are produced on their walls and some physical properties are changed. In addition, the presence of oxygen containing functional groups on side walls provides a means of introducing positively charged species.47-52
In the present study, a CL-based method involving the use of oxidized multiwall carbon nanotubes (ox-MWCNTs) grafted with Cu2+ was devised to quantify citalopram levels in pharmaceutical preparations. We found that ox-MWCNTs/Cu2+ enhanced the CL signal arising from the reaction between alkaline luminol and H2O2, and that CL intensities were further boosted by the presence of citalopram. Based on these observations, we developed a sensitive CL method for the quantification of citalopram in pharmaceutical preparations. Citalopram was found to markedly increase the CL intensity of the luminol-H2O2-ox-MWCNTs/Cu2+ system and this enhance was proportional to the concentration of citalopram present. After optimizing experimental parameters, CL intensity was found to be linear to citalopram concentration in the range 0.2-8.0 mL-1 with a detection limit of 2.29 X 10⁻⁵ μ-g mL-1.
2. Experimental
2.1. Materials and Reagents
Reagents used were of high grade purity and double-deionized water (DI) was used throughout. Luminol (5-amino-2, 3-dihydro-1, 4-phthalazinedione) was purchased from Sigma-Aldrich (St. Louis, Missouri, US). Hydrogen peroxide and sodium hydroxide were from the Junsei Chemical Co., Ltd. Quality Assurance Section 1-6, Ohmano-cho, Koshigaya-shi, Saitama, 4-0844, Japan. MWCNTs (>93 % purity, 10-10 nm average diameter, and 1-25 μm long) were brought from CNT (Daegu, South Korea). Standard reference citalopram was provided by Z-Jan's Pharmaceutical Industry (Peshawar, Pakistan). Commercial formulations of citalopram, Lopram 20 mg tablets (manufactured by Hansel Pharmaceuticals (Pvt) Ltd, Lahore, Pakistan), Citalo 20 mg tablets (manufactured by Platinum Pharmaceuticals (Pvt) Ltd, Karachi, Pakistan) and Pramcit 20 mg tablets (manufactured by Nabiqasim Industries (Pvt) Ltd, Karachi, Pakistan) were purchased locally.
2.2. Preparation of Reagents and Sample Solutions
Luminol stock solution (4 X 10⁻³ M) was prepared by dissolving 0.035g of luminol in 4.5 mL of0.1M NaOH, diluted to 50 mL with deionized (DI) water, and stored at 4 °C. Hydrogen peroxide solution (4 M) was prepared by diluting 10.213 mL of 30 % H2O2 to 25 mL with DI water. Sodium hydroxide (0.1 M) solution was prepared by dissolving 2.0 g of NaOH in 50 mL DI water. Working solutions were prepared freshly before use from stock solutions by proper dilution with DI water. A standard stock solution of citalopram (250 mL-1) was prepared by dissolving 0.0125 g of citalopram standard in 2 mL of distilled ethanol, and diluting to 50 mL with DI water. Working solutions of 10 mL-1 and5^gmL-1 citalopram were prepared daily by diluting proper amounts of the stock solution with DI water.
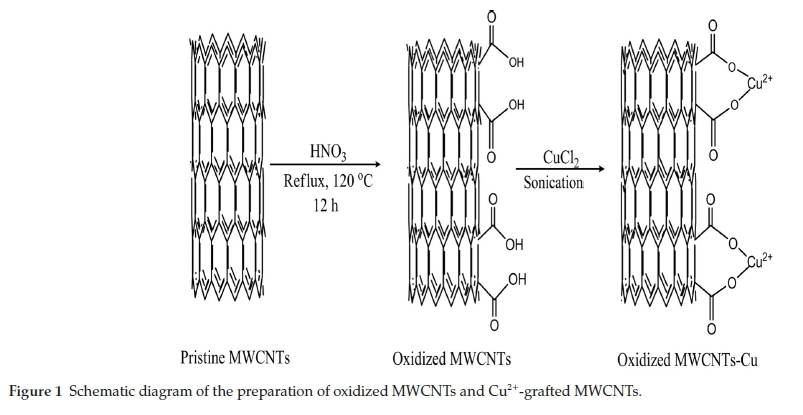
2.3. Synthesis of Oxidized MWCNTs
Ox-MWCNTs were prepared as previously described by Rosca et al.5354Briefly, 0.5 g pristine MWCNTs (p-MWCNTs) were added to 200 mL nitric acid solution in a round-bottomed glass flask. p-MWCNTs were dispersed by sonication for 1 h using an ultrasonic bath (JAC Ultra-sonic 4020p, KODO, South Korea), and the mixture was then refluxed at 120 °C for 12 h under nitrogen. After cooling, the MWCNTs were washed and filtered several times using DI water and a 0.22μm membrane nitrocellulose filter (Millipore, USA). The MWCNTs so obtained were then dried in an oven at 60 °C for 48 h (Fig. 1).
2.4. Synthesis of Cu2+-grafted Oxidized Multiwall Carbon Nanotubes
Oxidized MWCNTs (0.1 g) were added to 20 mL of a 1 X 10⁻³ M Cu (II) solution and dispersed by sonication for 30 min. After cooling, the ox-MWCNTs/Cu2+ were washed and filtered through a nitrocellulose filter (0.20 μm Millipore, USA). The obtained ox-MWCNTs/Cu2+ were then dried at 60 °C for 24 h (Fig. 1).
2.5. Instrument
A Hitachi F-4500 spectrofluorometer was used to detect and record CL produced by the luminol-H2O2-ox-MWCNTs/Cu2+ system. For CL measurements, the light source of the spectro-fluorometer was switched off and only the photomultiplier tube (Model, R 928, Hamamatsu, Japan) was used. The slit width of the emission monochromators was 5 nm and the power supply of the photomultiplier tube used to detect CL signals was 700 V. Light-producing reactions were carried out in a standard 1x1cm quartz cell placed in the spectrofluorometer cell holder.
2.6. Analytical Procedure
Analytical procedure consisted of adding the following quantities of equilibrated solutions to the CL reaction cell using a micropipette. Citalopram stock solution to give final concentration of 0.2-8.0 Mg mL-1,4x10⁻⁴ g ox-MWCNTs/Cu2+, 400 of NaOH solution (8 x 10⁻³ mol L-1), and 400 luminol (4 x 10⁻³ mol L-1). The kinetic-curve of the CL signal was measured at 430 nm after injecting of 400 (4 x 10⁻² mol L-1)ofH2O2 into cells to initiate the CL reaction. CL intensities (AI) were calculated using AI = Is-Io, where Isand Ioare CL signals in the presence and absence of citalopram, respectively.
2.7. Application to Pharmaceutical Preparations
Five tablets each containing 20 mg of active citalopram were weighed and weights were averaged. The tablets were then powdered in a mortar. The powder equivalent of 0.0125 g citalopram was dissolved in 2 mL of ethanol, approximately 10 mL of DI water was added, and mixture sonicated for 10 min. The resultant solution was then filtered and diluted to 50 mL with DI water. An appropriate volume of this solution was then diluted with DI water to provide a citalopram concentration in the working range. A certain volume of this solution was then analyzed using the above described procedure and amount of citalopram present per tablet was calculated by the calibration equation.
3. Results and Discussion
3.1. Characterization of MWCNTs, Oxidized MWCNTs and Cu2+/ox-MWCNTs
The morphologies of pristine-MWCNTs, ox-MWCNTs, and ox-MWCNTs/Cu2+ were examined by scanning electron microscopy (SEM) (S-4200, HITACHI, Japan). The Pristine-MWCNTs appeared as separate thread-like carbon fibres (Fig. 2(a)), whereas ox-MWCNTs were aggregated (Fig. 2(b)), and Cu2+ coated ox-MWCNTs were more aggregated (Fig. 2(c)).
3.2. CL Characterization
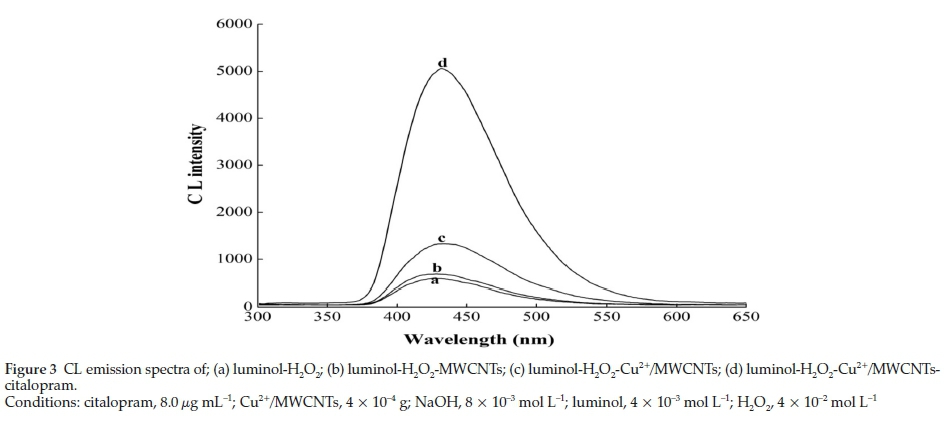
A CL emission spectrum of the luminol-H2O2-citalopram-MWCNTs/Cu2+ system is presented in Fig. 3. As shown in Fig. 3(a), the luminol-H2O2 system produced a weak CL signal, which was not enhanced by the addition of ox-MWCNTs (Fig. 3(b)). However, the addition of ox-MWCNTs/Cu2+ to the luminol-H2O2 system augmented the CL signal (Fig 3(c)), and the addition of citalopram markedly enhanced the signals obtained (Fig 3(d)), which exhibited maximum intensity at 430 nm. Furthermore, the CL intensity of the luminol-H2O2-citalopram-MWCNTs/Cu2+ system was proportional to the concentration of citalopram present.
3.3. Optimization of the Reagents Concentration
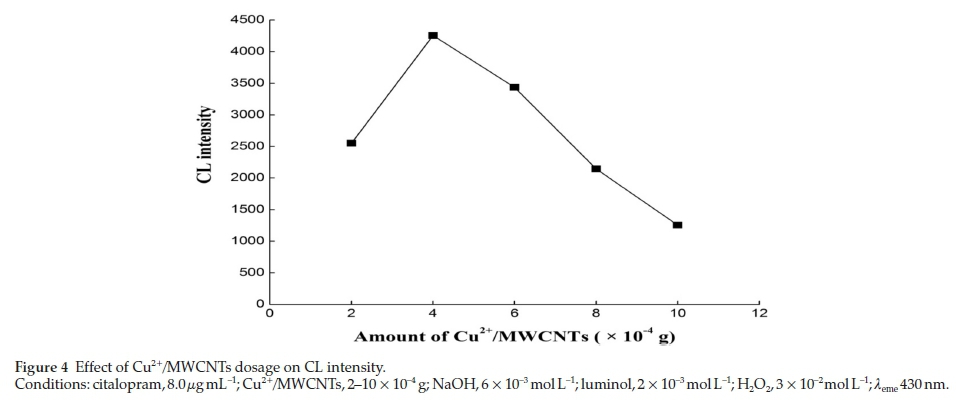
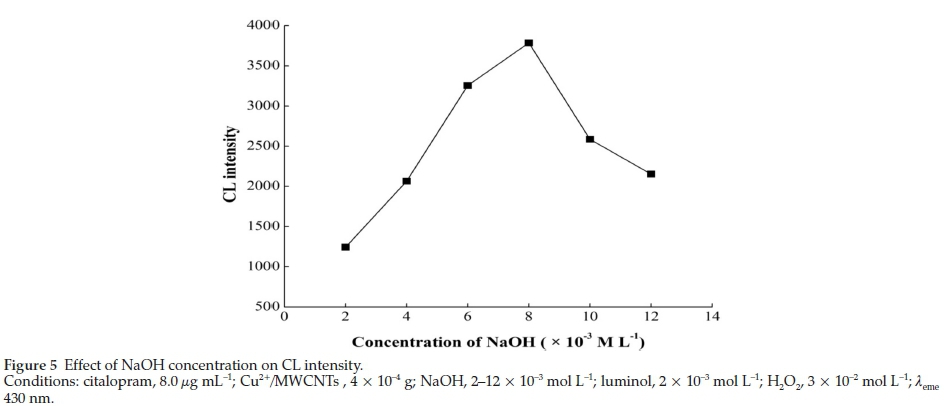
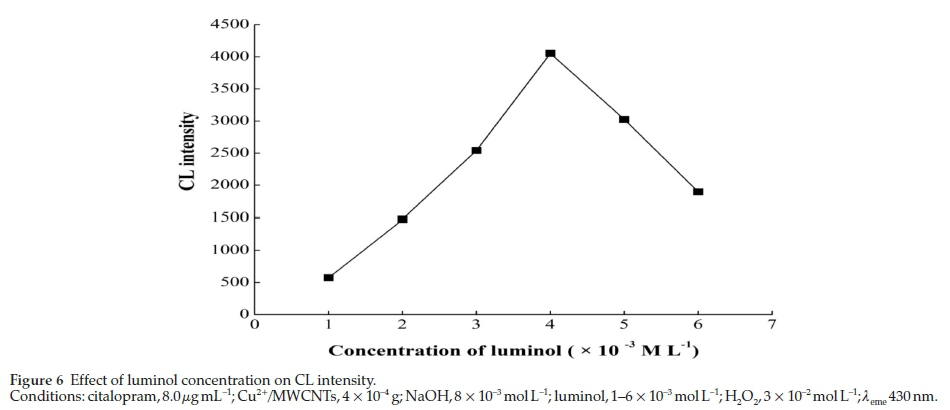
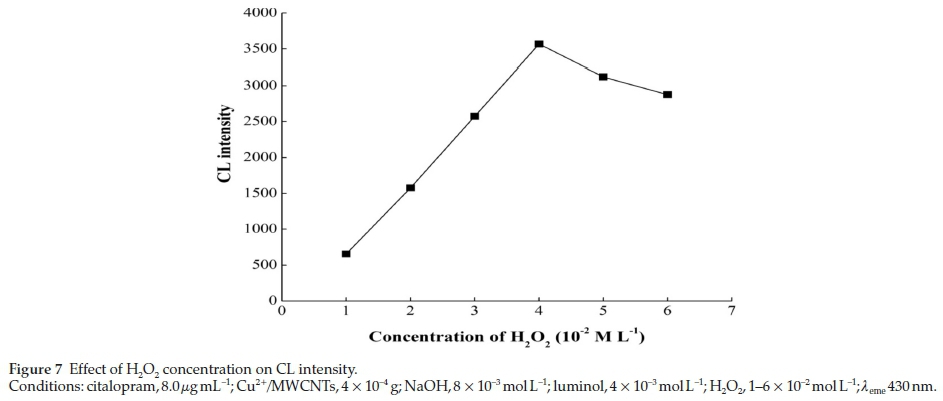
The effect of the amount of MWCNTs/Cu2+ used was investigated in the range 2-10 x 10-4 g. Maximum CL intensity of the luminol-H2O2-citalopram-MWCNTs/Cu2+ system was achieved at4x10-4 g (Fig. 4), and thus, this amount was used in further experiments. The effect of sodium hydroxide concentration on the luminol-H2O2-citalopram-MWCNTs/Cu2+ system was investigated in the range 2-12 x 10-3 mol L-1. CL intensity was found to peak at a NaOH concentration of8x10-3 mol L-1 (Fig. 5). The effect of luminol concentration on CL intensity was also studied in the range 1-6 x 10⁻³ mol L-1. CL intensity peaked at a luminol concentration of4x10-3 mol L-1 (Fig. 6). The effects of H2O2 concentration were examined in the range 1-6 x 10⁻² mol L-1.CL intensity increased with H2O2 concentration to4x10-2 mol L-1 and then plateaued (Fig 7).
3.4. Analytical Features of Merit
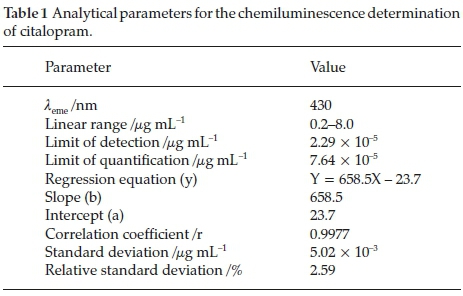
Under optimum experimental conditions, the concentration of citalopram and chemiluminescence intensity exhibited a linear relationship in the range 0.2-8.0 μg mL-1 with a correlation coefficient of 0.996-0.9977 (Fig. 8a, b). Limit of detection (LOD) was defined as the concentration of citalopram that produced a CL intensity three times the blank standard deviation (LOD = 3 Sb/m), whereas limit of quantification (LOQ) was defined as the concentration of the citalopram that produced a CL intensity ten times the blank standard deviation (LOQ = 10 Sb/m). Calculated LOD and LOQ values were 2.29 X 10⁻⁵ μg mL-1 and 7.64 X 10⁻⁵ μg mL-1 respectively. The linear regression equation, its slope, intercept, and correlation coefficient, and the relative standard deviation of the response factor are provided in Table 1. The sensitivity of the developed method is compared with other described citalopram methods in Table 2. The table shows that the sensitivity of the devised method is greater than that of any of the previously described methods.
3.5. Interference Effects
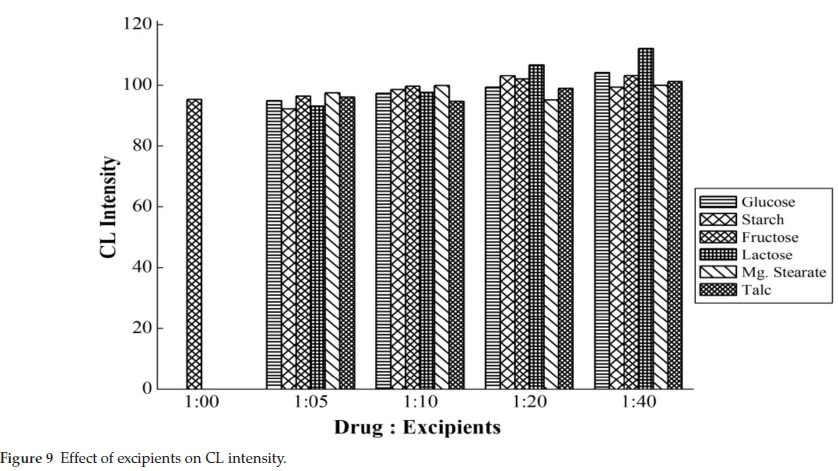
Interference by common excipients like glucose, starch, fructose, lactose, magnesium stearate, and talc were studied. The interference study was conducted by preparing samples containing fixed amounts of citalopram (0.2 μg mL-1) and different concentrations (5, 10, 20, and 40-fold concentrations) of excipients. No interferences were observed by these common excipients (Fig. 9).
3.6. Reliability of the Method
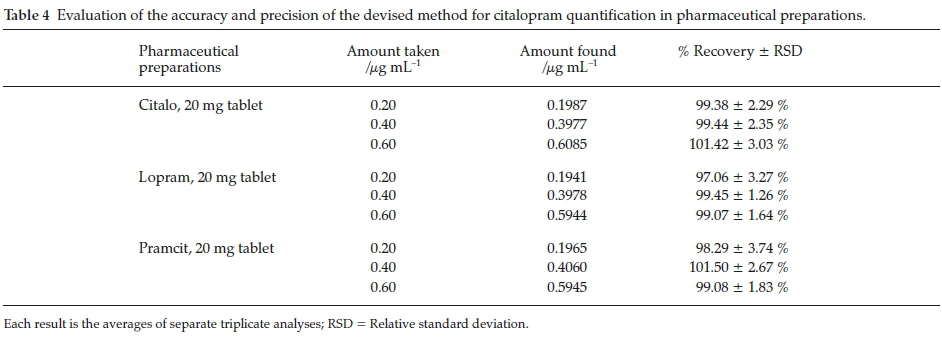
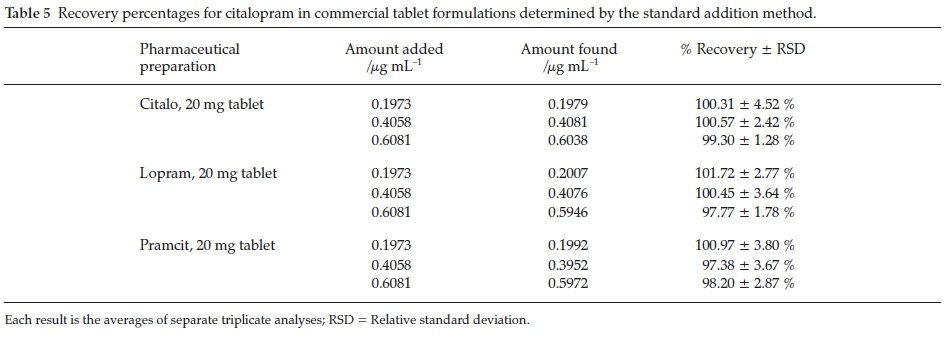
The precision of the proposed method was studied by analyzing pure citalopram and pharmaceutical formulations using three different concentrations of each in triplicate. Results are given in Table 3 for pure citalopram and in Table 4 for pharmaceutical formulations. Percent recoveries were calculated and obtained in the range of 98.67-101.46 % for the pure form and 97.06-101.50 % for commercial formulations with low relative standard deviation value. The accuracy of the method was studied by the standard addition method using three different tablet brands Citalo, Lopram, and Pramcit (each containing 20 mg of citalopram). Definite amounts (0.1973, 0.4059, and 0.6081 μg mL-1) of pure citalopram solution were added to tablet solutions (0.20μg mL-1) and analyzed using the described procedure.
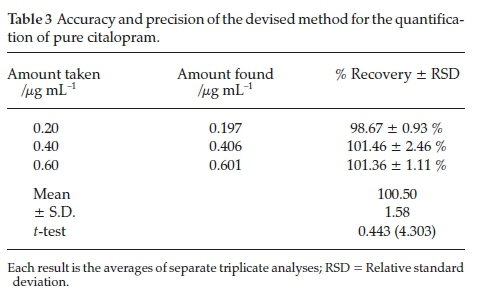
Recoveries were calculated and obtained in the range of 97.38-101.72 % (Table 5), demonstrating the excellent accuracy of the developed method for the determination of citalopram in commercial formulations.
3.7. Applicability
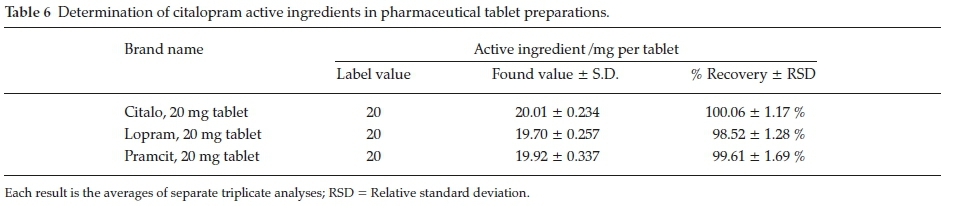
The proposed method was fruitfully applied to the determination of Citalopram in three different pharmaceutical preparations. The results obtained agreed well with manufacturers' claims (Table 6), indicating that the method can be used to quantify citalopram levels in commercial formulations.
4. Conclusion
A simple precise accurate and sensitive method was developed for the quantification of citalopram. The method is based on the enhancement of citalopram CL of the luminol-H2O2-MWCNTs/Cu2+ system. The method has a wider linear range and lower limits of detection and quantification than other described methods. In addition, it was successfully applied for the determination of citalopram in pharmaceutical preparations with good recovery and excellent reproducibility. The commonly present excipients in commercial formulations did not interfere with the analysis. Accordingly, we conclude that the developed method is appropriate for the quantification of citalopram in quality control laboratories and industrial fields.
Acknowledgement
The authors are grateful to the Higher Education Commission Islamabad, Pakistan, for providing financial support.
References
1 S. Budavari, The Merck Index, 14th edn., Merck and Co, Inc., White-house Station, NJ, 2007, 387. [ Links ]
2 R.W. Fuller, Pharmacologic modification of serotonergic function: drugs for the study and treatment of psychiatric and other disorders, J. Clin. Psychiatry, 1986,47, 4-8. [ Links ]
3 P. Baumann, Pharmacology and pharmacokinetics of citalopram and other SSRIs, Int. Clin. Psychopharmacol., 1996,11, 5-11. [ Links ]
4 S.H. Sindrup, U. Bjerre, A. Dejgaard, K. Brosen, T. Aaes-Jorgensen and L.F. Gram, The selective serotonin reuptake inhibitor citalopram relieves the symptoms of diabetic neuropathy, Clin. Pharmcol. Ther., 1992, 52, 547-552. [ Links ]
5 M. Atmaca, M. Kuloglu, E. Tezcan and A. Semercioz, The efficacy of citalopram in the treatment of premature ejaculation: a placebo-controlled study, Int. J. Impot. Res, 2002,14, 502-505. [ Links ]
6 G. Andersen, K. Vestergaard and J.O. Riis, Citalopram for post-stroke pathological cryin, Lancet, 1993, 342, 837-839. [ Links ]
7 L. Bjerkenstedt, L. Flyckt, K.F. Overo and O. Lingjaerde, Relationship between clinical effects, serum drug concentration and serotonin uptake inhibition in depressed patients treated with citalopram. A double-blind comparison of three dose levels, Eur. J. Clin. Pharmacol., 1985, 28, 553-557. [ Links ]
8 S. Stahl, Stahl's Essential Psychopharmacology. The Prescriber's Guide. Cambridge University Press, New York, NY, 2009. [ Links ]
9 P. Popik, Preclinical pharmacology of citalopram, J. Clin. Psychopharmacol., 1999,19, 4-22. [ Links ]
10 C. Sanchez, K.P Bogeso, B. Ebert, E.H. Reines and C. Braestrup, Escitalopram versus citalopram: the surprising role of the R-enatio-mer, Psychopharmacol. (Berl.) 2004,174, 163-176. [ Links ]
11 C.B. Eap, G. Bouchoux, M. Amey, N. Cochard, L. Savary and P Baumann, Simultaneous determination of human plasma levels of citalopram, paroxetine, sertraline, and their metabolites by gas chromatography-mass spectrometry, J. Chromatogr. Sci., 1998, 36, 365-371. [ Links ]
12 P. Reymond, M. Amey, A. Souche, S. Lambert, H. Konrat, C.B. Eap and P. Baumann, Determination of plasma levels of citalopram and its demethylated and deaminated metabolites by gas chromatography and gas chromatography-mass spectrometry, J. Chromatogr. Biomed. Appl, 1993, 616, 221-228. [ Links ]
13 Q. Meng and D. Gauthier, Simultaneous analysis of citalopram and desmethylcitalopram by liquid chromatography with fluorescence detection after solid-phase extraction, Clin. Biochem., 2005, 38, 282-285. [ Links ]
14 M.A. Raggi, V. Pucci, R. Mandrioli, C. Sabbioni and S. Fanali, Determination of recent antidepressant citalopram in human plasma by liquid chromatography-fluorescence detection, Chromatographia, 2003, 57, 273-278. [ Links ]
15 E. Matsui, M. Hoshino, A. Matsui and A. Okahira, Simultaneous determination of citalopram and its metabolites by high-performance liquid chromatography with column switching and fluorescence detection by direct plasma injection, J. Chromatogr. B Biome. Appl., 1995, 668, 299-307. [ Links ]
16 L. Kristoffersen, A. Bugge, E. Lundanes and L. Slordal, Simultaneous determination of citalopram, fluoxetine and their metabolites in plasma and whole blood by high-performance liquid chromatogra-phy with ultraviolet and fluorescence detection, J. Chromatogr. B, 1999, 734, 229-246. [ Links ]
17 C. Duverneuil, G.L. De La Grandmaison, P. De Mazancourt and J.C. Alvarez, A high-performance liquid chromatography method with photodiode-array UV detection for therapeutic drug monitoring of the nontricyclic antidepressant drugs, Ther. Drug. Monit., 2003, 25, 56-573. [ Links ]
18 C. Frahnert, M.L. Rao and K. Grasmader, Analysis of eighteen anti-depressants, four atypical antipsychotics and active metabolites in serum by liquid chromatography: a simple tool for therapeutic drug monitoring, J. Chromatogr. B, 2003, 794, 35-47. [ Links ]
19 U. Gutteck and K.M. Rensch, Therapeutic drug monitoring of 13 anti-depressant and five neuroleptic drugs in serum with liquid chroma-tography-electrospray ionization mass spectrometry, Clin. Chem. Lab. Med., 2003, 41, 1571-1579. [ Links ]
20 M. Kollroser and C. Schober, An on-line solid phase extraction-liquid chromatography-tandem mass spectrometry method for the analysis of citalopram, fluvoxamine and paroxetine in human plasma, Chromatographia, 2003, 57, 133-138. [ Links ]
21 S. Pedersen-Bjergaard and T.G. Halvorsen, Analysis of pharmaceuticals by microemulsion electrokinetic chromatography in a suppressed electroosmotic flow environment, Chromatographia, 2000,52, 593-598. [ Links ]
22 T. Buzinkaiova and J. Polonsky, Determination of four selective serotonin reuptake inhibitors by capillary isotachophoresis, Electrophoresis, 2000, 21, 2839-2841. [ Links ]
23 J.R. Flores, J.J.B. Nevado, A.M.C. Salcedo and M.P.C. Diaz, Development of capillary zone electrophoretic method to determine six anti-depressants in their pharmaceutical preparations. Experimental design for evaluating the ruggedness of method, J. Sep. Sci., 2004,27, 33-40. [ Links ]
24 T.G. Halvorsen, S. Pedersen-Bjergaard and K.E. Rasmussen, Reduction of extraction times in liquid-phase microextraction, J. Chromatogr. B, 2001, 760, 219-226. [ Links ]
25 L. Labat, M. Deveaux, P. Dallet and J.P. Dubost, Separation of new antidepressants and their metabolites by micellar electrokinetic capillary chromatography, J. Chromatogr. B, 2002, 773, 17-23. [ Links ]
26 A. Bjorhovde, T.G. Halvorsen, K.E. Rasmussen and S. Pedersen-Bjergaard, Liquid-phase microextraction of drugs from human breast milk, Anal. Chim. Acta, 2003, 491, 155-161. [ Links ]
27 S.G. Vasantharaju and S.L. Prabu, Spectrofluorimetric method for determination of citalopram in bulk and pharmaceutical dosage forms, A. Jacob. Indian J. Pharm. Sci., 2008, 70, 647-648. [ Links ]
28 H.E. Satana, N. Ertas and G.G. Nilgun, Spectrofluorimetric determination of citalopram HBr in tablets, FABAD J. Pharm. Sci., 2007, 32, 73-77. [ Links ]
29 M.N. Khan, J. Shah, M.R. Jan, and S.H. Lee, A validated spectro-fluorimetric method for the determination of citalopram in bulk and pharmaceutical preparations based on the measurement of the silver nanoparticles-enhanced fluorescence of citalopram/terbium complexes, J. Fluoresc., 2013, 23, 161-169. [ Links ]
30 J. Shah, M.R. Jan, M.N. Khan and Inayatullah, Spectrofluorimetric method for quantification of citalopram in pharmaceutical preparations and biological fluids through oxidation with Ce(IV), J. App. Spectrosc., 2013, 79, 922-928. [ Links ]
31 R. Asad, Development and application of spectrophotometric methods for the determination of citalopram hydrobromide in dosage forms, Chem. Pharm. Bull., 2006, 544, 432434. [ Links ]
32 R. Asad, A.M. Tariq and N.B. Shahida, Spectrophotometric determination of citalopram in pharmaceutical formulations, J. Chem. Soc. Pak., 2008, 30, 241-245. [ Links ]
33 N. Badiadka and V Kunnummel, Spectrophotometric determination of citalopram hydrobromide in pharmaceuticals, J. Mex. Chem. Soc., 2010, 54, 98-102. [ Links ]
34 A.A. Nawal, A.A. Fatma and A.A. Abeer, Flow-injection chemi-luminescence and electrogenerated chemiluminescence determination of escitalopram oxalate in tablet form, Luminescence, 2013, 28, 84-92. [ Links ]
35 M.N. Khan, M.R. Jan, J. Shah, and S.H. Lee, A validated silver- nanoparticle-enhanced chemiluminescence method for the determination of citalopram in pharmaceutical preparations and human plasma, Luminescence, 2014, 29, 266-274. [ Links ]
36 A.M. Garcia-Campana and W.R. Baeyens, Chemiluminescence in Analytical Chemistry, Marcel Dekker, New York, 2001. [ Links ]
37 Y.F. Zhang, X.L. Cai, J.S. Yu and H.X. Ju, Flow injection chemi-luminescence analysis for highly sensitive determination of nosca-pine, J. Photochem. Photobiol. A: Chem, 2004,162, 457-462. [ Links ]
38 J. Kang, Y. Zhang, L. Han, J. Tang, S. Wang and Y. Zhang, Utilizing the chemiluminescence of 2-substituted-4,5-di(2-furyl)-1H-imidazole-H2O2-Cu2+ system for the determination of Cu2+, J. Photochem. Photobiol. A: Chem., 2011, 217, 376-382. [ Links ]
39 X. Shichao, L. Wenwen, H. Bingcheng, C. Wei and L. Zuliang, Biomimetic enhanced chemiluminescence of luminol-H2O2 system by manganese (III) deuteroporphyrin and its application in flow injection determination of phenol at trace level, J. Photochem. Photobiol. A: Chem., 2012, 227, 32-37. [ Links ]
40 L. Bo, H. Yi, D. Chunfeng, L. Na and C. Hua, Platinum nanoparticle-catalyzed lucigenin-hydrazine chemiluminescence, J. Photochem. Photobiol. A: Chem, 217, 2011, 62-67. [ Links ]
41 M.N. Khan, M.R. Jan, J. Shah, S.H. Lee and Y.H. Kim, Determination of sulpiride in pharmaceutical preparations and biological fluids using a Cr (III) enhanced chemiluminescence method, Luminescence, 2013, 28, 915-921. [ Links ]
42 S. Sotiropoulou and N.A. Chaniotakis, Carbon nanotube array-based biosensor, Anal. Bioanal. Chem., 375, 2003, 103-105. [ Links ]
43 A. Salmi, C.E. Banks and R.G. Compton, Abrasive immobilization of carbon nanotubes on a basal plane pyrolytic graphite electrode: ap plication to the detection of epinephrine, Analyst, 2004,129,225-228. [ Links ].
44 A. Javey, J. Guo, Q. Wang, M. Lundstrom and H. Dai, Ballistic carbon nanotube transistors, Nature, 2003, 424, 654-657. [ Links ]
45 S. Kamlesh and W. Hui-Fen, Oxidized multiwalled carbon nanotubes for quantitative determination of cationic surfactants in water samples using atmospheric pressure matrix-assisted laser desorption/ ionization mass spectrometry, Anal. Chim. Acta, 2008, 628, 198-203. [ Links ]
46 P. Seok-Hwan, J. Hong-Ryun, K. Bo-Kyoung and L. Wan-Jin, MWCNT/mesoporous carbon nanofibers composites prepared by electrospinning and silica template as counter electrodes for dye-sensitized solar cells, J. Photochem. Photobiol. A: Chem., 2012,246,45-49. [ Links ]
47 E. Ballesteros, M. Gallego and M. Valcarcel, Analytical potential of fullerene as adsorbent for organic and organometallic compounds from aqueous solutions, J. Chromatogr. A, 2000, 869, 101-110. [ Links ]
48 J.R. Baena, M. Gallego and M. Valcarcel, Group speciation of metal dithiocarbamates by sorption on C60 fullerene, Analyst, 2000, 125, 1495-1499. [ Links ]
49 J.R. Baena, M. Gallego and M. Valcarcel, Speciation of lead in environmental waters by preconcentration on a new fullerene derivative, Anal. Chem., 2002, 74, 1519-1524. [ Links ]
50 H. Zhao, L. Wang, Y. Qiu, Z. Zhou, W. Zhong and X. Li, Multiwalled carbon nanotubes as a solid-phase extraction adsorbent for the determination of three barbiturates in pork by ion trap gas chromatogra-phy-tandem mass spectrometry (GC/MS/MS) following microwave assisted derivatization, Anal. Chimica. Acta, 2007, 586, 399-406. [ Links ]
51 X. Liu, Y. Ji, Y. Zhang, H. Zhang and M. Liu, Oxidized multiwalled carbon nanotubes as a novel solid-phase microextraction fiber for determination of phenols in aqueous sample, J. Chromatogr. A, 2007, 1165, 10-17. [ Links ]
52 J.X. Wang, D.Q. Jiang, Z.Y. Gu and X.P. Yan, Multiwalled carbon nanotubes coated fibers for solid-phase microextraction of poly-brominated diphenyl ethers in water and milk samples before gas chromatography with electron-capture detection, J. Chromatogr. A, 2006, 1137, 8-14. [ Links ]
53 I.D. Rosca, F. Watari, M. Uo and T. Akasaka, Oxidation of multiwalled carbon nanotubes by nitric acid, Carbon, 2005, 43, 3124-3131. [ Links ]
54 Y.H. Kim, H.K. Lee, Y. Park, A.I. Gopalan, K.P. Lee and S.J. Choi, Preparation and characterization of an oxidized MWCNT-reinforced nafion nanocomposite membrane for direct methanol fuel cell, J. Nanoelectron. Optoelectron, 2010, 5, 208-211. [ Links ]
Received 2 October 2017
Revised 9 October 2018
Accepted 11 October 2018
* To whom correspondence should be addressed. E-mail: mnaeemchemist@yahoo.com

