


Serviços Personalizados
Artigo
 Inglês (pdf)
 Artigo em XML
 Referências do artigo
Indicadores

Links relacionados
-
 Citado por Google
 -
 Similares em Google
Compartilhar

 Permalink
South African Journal of Chemistry
versão On-line ISSN 1996-840X
versão impressa ISSN 0379-4350
S.Afr.j.chem. (Online) vol.71 Durban 2018
http://dx.doi.org/10.17159/0379-4350/2018/v71a11
RESEARCH ARTICLE
Determination of Dichlorodiphenyltrichloroethane (DDT) And metabolites residues in fish species from eastern lake tanganyika
John A.M. MahugijaI, *; Lutamyo NambelaII; Aviti J. Mmoch
IChemistry Department, University of Dar es Salaam, P.O. Box 35061 Dar es Salaam, Tanzania
IICollege of Engineering and Technology, University of Dar es Salaam, P.O. Box 35131 Dar es Salaam, Tanzania
IIIInstitute of Marine Sciences, University of Dar es Salaam, P.O. Box 668 Zanzibar, Tanzania
ABSTRACT
In this study, the levels and status of dichlorodiphenyltrichloroethane (DDT) residues in fish samples collected from Eastern Lake Tanganyika were investigated. The analytes were determined using gas chromatography equipped with an electron capture detector (GC-ECD) and by gas chromatography-mass spectrometry (GC-MS). The compounds p,p'-DDE (4,4'-DDE), p,p'-DDD (4,4'-DDD), o,p'-DDT (2,4'-DDT) and p,p'-DDT (4,4'-DDT) were detected in all the samples, with total DDT concentrations ranging from 23 ± 8.3 to 339 ± 27 kg-1 fresh weight and 1736 ± 1388 kg-1 to 25 552 ± 4241 kg-1 lipid weight. The highest concentrations of total DDT were detected in Lates stappersii species. The ratios of the metabolites (DDD + DDE) to the parent compound (p,p'-DDT) were low (< 1) in all the fish samples, indicating exposure to fresh DDT. The concentrations of the DDT residues exceeded the extraneous maximum residue limit of 1.0 /ug kg-1, indicating risks and concerns for public health and the environment because of the indication of fresh application of banned pesticides and bioaccumulation. There is need for continued monitoring of the residues in Lake Tanganyika environs and controlling the pesticides used in the area.
Keywords: Pesticides, DDT, fish, lake, Tanzania.
1. Introduction
Dichlorodiphenyltrichloroethane (DDT) is among the organo-chlorine pesticides that are described as persistent in the environment hence their effects last for a long time. The organo-chlorine pesticides have high solubility in lipids and low solubility in water, and because of these properties they tend to bio-accumulate and biomagnify in the food chains.1 They are linked with public and environmental health effects.2,3,4
Pesticides are distributed by various mechanisms and agents in the environment. When pesticides are applied, large amounts of them reach the soil and atmosphere. Pesticide residues in the atmosphere are washed out by precipitation or fall into the soil and water. Also contaminated leaves or crops are important sources of pesticide residues in the soil when they fall to the ground or due to washing by rainfall.2,5 Soil acts as a reservoir from which chemical contaminants such as pesticides find their ways to nearby water bodies, e.g. streams and rivers, and finally get discharged into lakes and seas or are broken down depending on their physico-chemical properties.5 Water is therefore the main receiver of the pesticide residues.2,5
DDT residues (o,p'-DDT, p,p'-DDT and metabolites such as p,p'-DDD and p,p'-DDE) are soluble in fats and lipids of animals and plants; therefore, when water is contaminated, fish and other aquatic organisms have the capacity to absorb them from water and concentrate them in their fatty tissues.4 DDT is almost universally banned for use in agriculture because of its impacts on public health and the environment. However, it is still used in developing countries including Tanzania for the control of vectors of diseases such as malaria and visceral leishmaniasis (mainly indoors).6
Lake Tanganyika sustains important fisheries and is relied upon by local communities for their livelihood and as one of their major sources of income. Varieties of fish are widely distributed throughout the lake. Fish from the lake are used in the riparian countries and exported to various parts of the world. Numerous agricultural activities which involve the use of pesticides take place in the Lake Tanganyika basin.7 There are several rivers and streams crossing the fields within the basin which suggests that they may carry pesticides into the lake. Due to the solubility of the pesticides in fat and lipids, fish and other aquatic organisms concentrate and accumulate pesticide residues in their fatty tissues.
To the best of our knowledge, there is no any comprehensive previous study that had been conducted on pesticide residues in fish in the eastern Lake Tanganyika in Tanzania and there is no established recent status of the pesticide residues in this area. The only similar study found in literature is that of Foxall et al.7 which screened pesticide residues and heavy metals in fish and molluscs. However, the above-mentioned study involved only two fish species (Limnothrissa miodon and Stolothrissa tanganicae) and it was a rough estimate of the DDT and DDE residues without assessing the compositions of the main isomers of the parent compounds and the metabolites. Similarly, there is very limited information on pesticide residues in fish in other parts of the lake, although some work was conducted in the northwestern part of the lake in Burundi as reported by Manirakiza et al.8 Their study determined organochlorine pesticides (including DDT) and polychlorinated biphenyls in cichlid fish species and found generally low levels in the samples. Therefore, this study was undertaken to investigate the levels, composition and status of DDT residues in fish samples and to gauge the contamination status of the fish species in the eastern part of the lake.
2. Experimental
2.1. Study Area
The study area is located in Eastern Lake Tanganyika in Kigoma region, Tanzania. The location and characteristics of Lake Tanganyika are described in Wikipedia9 and in various studies that were conducted in that area including those reported by Foxall et al7and West.10 Briefly, Lake Tanganyika is situated in the western part of the East African Rift valley. The lake is bordered by Burundi, the Democratic Republic of Congo, Tanzania, and Zambia, with the largest part (46 %) of the lake being possessed by Tanzania. It is the largest rift lake in Africa, the second largest lake by volume in the world, the deepest lake in Africa, the second deepest lake in the world and contains the greatest volume of fresh water, holding about 18 % of the world's available fresh water. It is the longest freshwater lake in the world, with a maximum length of 676 km. Its widths range from 50 to 80 km and its surface area is 32 900 km2. Two main rivers flow into the lake, as well as numerous smaller rivers and streams. The major rivers flowing into the lake are the Ruzizi River, which enters the north of the lake from Lake Kivu in Rwanda, and the Malagarasi River (the second largest river in Tanzania), which enters the east side of Lake Tanganyika.7
The lake holds at least 325 species of fish (cichlid and non-cichlid fish) and most of them live along the shoreline.10,11 The largest biomass of fish is in the open waters (pelagic zone) and is dominated by four species of predatory Lates and two species of Tanganyika sardines. Most of the cichlid and non-cichlid fish species are endemic to the lake.10,11,12
2.2. Sample Collection
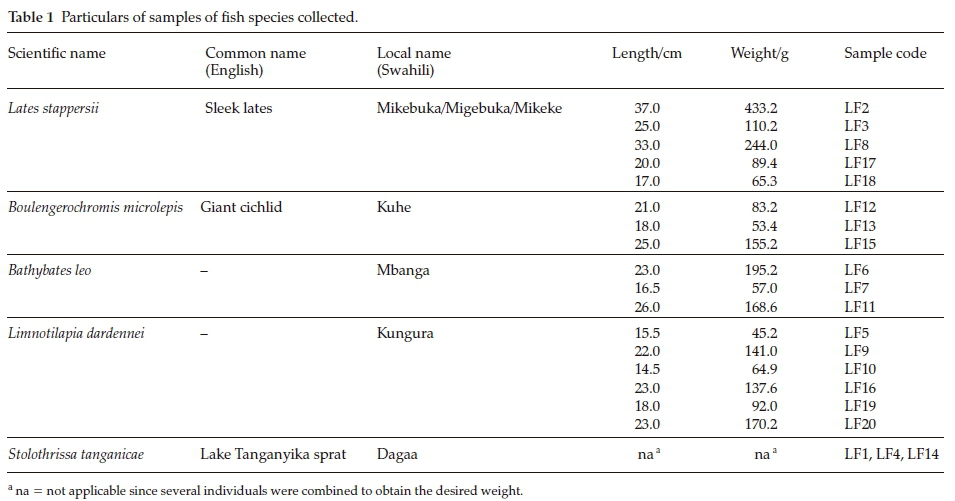
The fish samples were caught from Lake Tanganyika by fishermen and were collected or bought at the landing stations and from the markets located along the Lake Tanganyika (Fig. 1) at Ilagala (GPS coordinates: latitude -5.1924529 and longitude 29.8381239) and Kibirizi (GPS coordinates: latitude -4.8544733 and longitude 29.6238368). The fish samples were collected in April 2012 and were selected considering the species, sizes and weight. For each species, fish samples of various sizes (lengths and weights) and age (old and relatively young) were sampled. The descriptions of the samples selected among the fish species are shown in Table 1. A total of 20 samples were collected among five species. Each sample was placed in aluminium foil, labelled, then kept in a polyethylene bag. The samples were frozen before placing them in an icebox for transportation to the laboratory where they were kept deep frozen at -18 °C until further processing and analysis.
2.3. Sample Preparation and Processing
The procedures described by Henry and Kishimba14 were employed for sample preparation and processing. Each sample was de-boned and then the muscle tissues were homogenized using a blender. A subsample (10 g) was taken and ground together with anhydrous sodium sulfate (30 g) to free floating powder. The resulting powder was extracted by shaking for 1 h successively with ethyl acetate (60,20,20 mL). The extracts were filtered through anhydrous sodium sulfate into round-bottomed flasks. The extracts were concentrated using a rotary evaporator to about 2 mL and dissolved into 5 mL of n-hexane. The sample was again concentrated to about 2 mL and the volume was adjusted to 5 mL by adding n-hexane. A portion of the sample extract (1.5 mL) was taken in a pre-weighed dry vial for determination of fat content that involved placing it in a hood to evaporate the solvent. The weight of fat was determined and the percentage fat content was calculated on the basis of the whole extract and the sample weight. The remaining extract (3.5 mL) was kept in a graduated test tube and subjected to clean-up.13
The extracts were cleaned-up using saturated concentrated sulfuric acid treatment to remove fat and other impurities. Clean-up of sample extracts by treatment with concentrated sulfuric acid is applicable for certain pesticides of interest. Strong acids destroy most organic compounds including interferences, but most organochlorines remain stable in strong acids. The method is applicable for the screening of organochlorine pesticides with exceptions (e.g. dieldrin and endrin are destroyed).13 In the present study, the extracts (3.5 mL) were treated with concentrated sulfuric acid (2 mL) saturated with n-hexane. The test tubes containing the extracts were carefully inverted by an inverter 30 times, and then centrifuged for 5 min to separate the two layers. The upper clean organic phase was taken into a clean and dry vial for gas chromatographic analysis. For each sample, the experiments (preparation and analysis) were carried out in duplicate or triplicate using other subsamples.
2.4. Gas Chromatographic Analysis of Samples
The determination of the contaminants (analytes) in the fish samples was carried out using gas chromatography (GC). A gas chromatograph (GC-2010, Shimadzu) equipped with 63Ni Electron Capture Detector (ECD) and a non-polar (HP-5MS) capillary column of 30 m length x 0.25 mm i.d. x 0.25 μm film thickness was used. Nitrogen was used as both a carrier and make-up gas at a flow rate of 23.7 mL min-1. The temperature programme was: initial temperature of 120 °C held for 2 min, then increased at a rate of 10 °C min-1 to 270 °C held for 1 min, and at a rate of 2 °C min-1 to the final temperature of 290 °C held for 3 min. The injector and detector temperatures were 220 °C and 290 °C, respectively. The GC was operated in a splitless mode with an injection volume of 1 uL. The standard mixture was injected in the beginning and after every six samples. Samples were injected in duplicate.
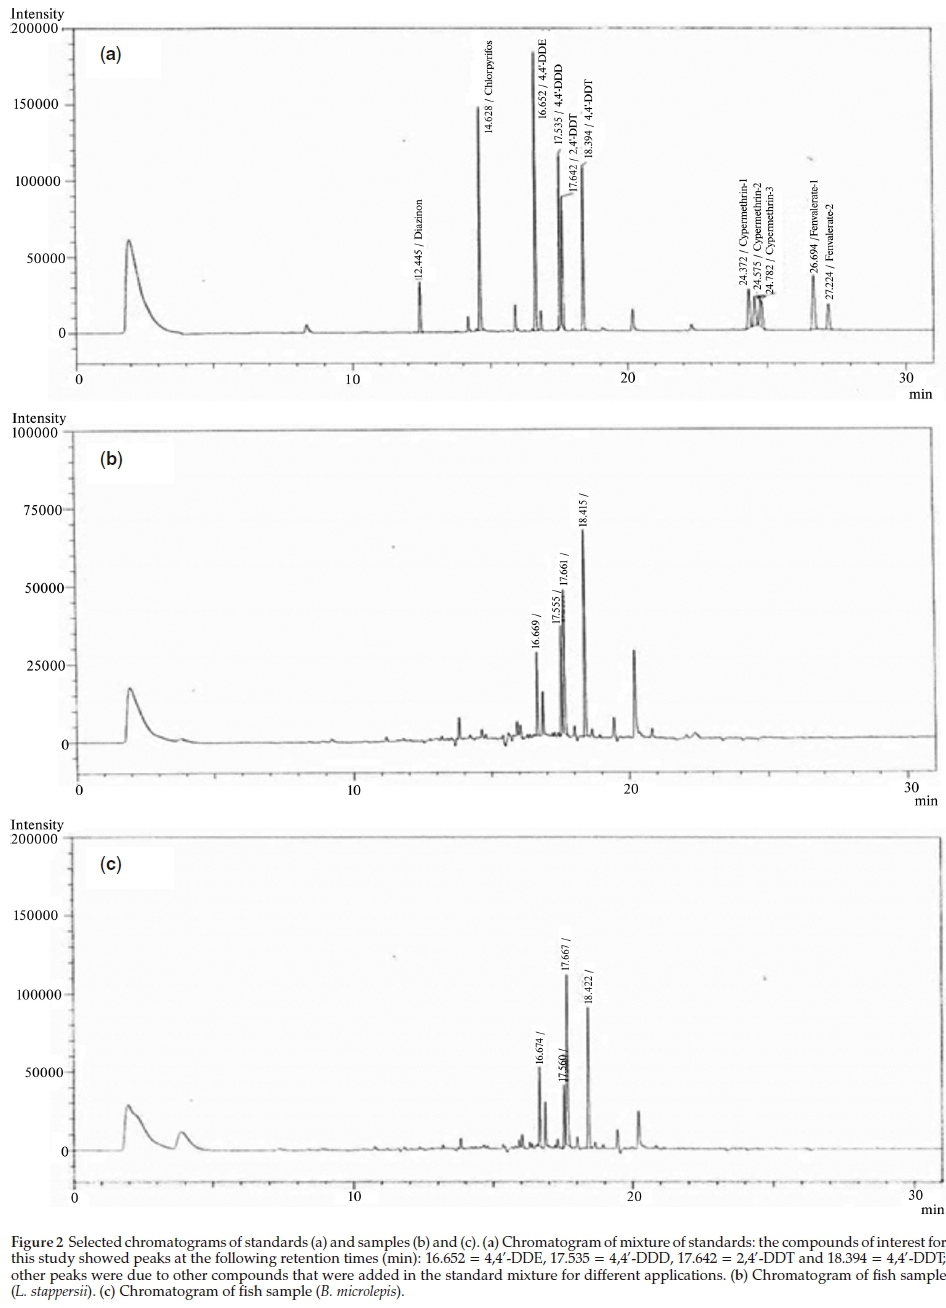
The confirmation of the findings was done using gas chroma-tography-mass spectrometry (Shimadzu GC-MS QP 2010 Ultra equipped with a mass selective detector-MSD, fused silica capillary column Rtx-5MS of 30 m length x 0.25 mm id x 0.25 μm film and an autosampler) at the Chemistry Department, University of Dar es Salaam applying the procedures described by Mahugija et al.15 The GC-MS was performed in splitless injection mode and the mass spectrometer was operated in electron impact (EI) ionization and full scan mode. The calibration/working standard solutions were prepared by dissolving portions of the stock solutions in the same solvents as used for the samples. Calibration curves were prepared by running series of mixtures of standard solutions and plotting the peak areas against concentrations. Identification of the compounds employed similar procedures to those reported by Mahugija et al.15that concisely involved checking the matching of the retention times and the mass spectra of the analytes in samples to those of external reference standards that were prepared and run at the same conditions as for the samples. Selected GC-ECD chromatograms are presented in Fig. 2. Quantification was carried out by linear integration of the standards and sample data based on peak areas. The use of peak areas was suitable since the sample extracts were thoroughly cleaned-up to remove the interferences.
2.5. Analytical Quality Assurance
The glassware and tools were thoroughly cleaned by detergent and tap water; rinsed with distilled water, air-dried, and then rinsed with analytical grade acetone before use. All the chemicals (such as solvents, reagents and standards) used were of analytical grade with high purity. The pesticide stock standards were from Dr. Ehrenstorfer analytical standards, Germany. For procedural blanks, a 50 mL aliquot of each solvent was concentrated to 2 mL and analyzed to check for contamination. For matrix blank tests, Labeo rohita (Rohu) samples collected from a pond in an area where no pesticides were used in the vicinity, were used after thorough testing and found that they were not contaminated by DDT residues. A total of three fish blanks were processed and analyzed using the same procedures as for the fish samples. Working standard solutions were used to prepare spiked samples for the determination of recovery, precision, limit of detection (LOD) and limit of quantification (LOQ). Accuracy of the method was calculated as recovery from blank matrix samples (10 g each), spiked with working pesticide standard solutions of p,p'-DDT, o,p'-DDT, p,p'-DDD and p,p'-DDE at concentrations of 2.5, 5,10, 25, 50,125 and 250 μg kg-1. Linearity was checked using these concentrations and the experiments were repeated six times for each compound. Repeatability precision (expressed as relative standard deviation or RSD) was determined at fortification level of 50 μg kg-1 on the same day with six replicates. For LOD determination, blank samples were fortified at the lowest detectable concentrations and analyzed. The LOD was expressed as the concentration corresponding to three times the standard deviation and LOQ was three times the LOD.
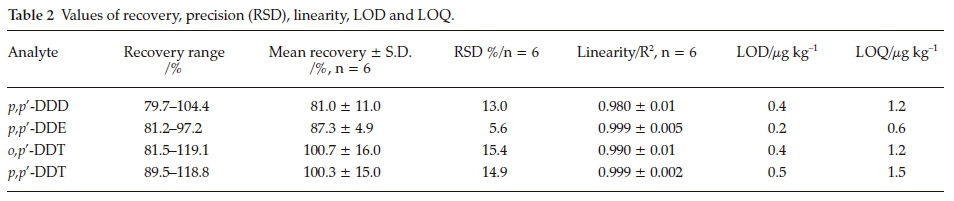
The results for analytical quality assurance procedures are presented in Table 2. Linearity of the tested concentrations ranged from R2 = 0.98 to R2 = 1.00. Accuracy (percentage recoveries) and precision (RSD) ranged from 79.7 to 119.1 % and 5.6 % to 15.4 %, respectively, and were within the acceptable ranges.16 The LOD values ranged from 0.2 to 0.5 μg kg-1 and the LOQ ranged from 0.6 to 1.5 μg kg-1. All the quality assurance results were considered to be suitable.
2.6. Data Analysis
Statistical analyses were performed using SPSS software 19.0. The correlations in the concentrations of the related compounds were computed using Pearson's r coefficient.
3. Results and Discussion
3.1. Levels and Distribution of DDT Residues in Fish Samples
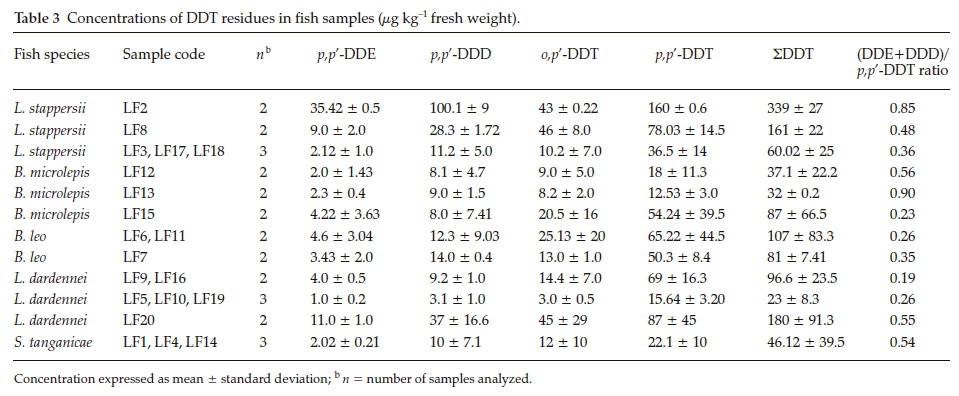
The DDT residues were detected in all the fish samples analyzed. Table 3 shows the levels of DDT residues in the fish samples. The concentrations of total DDT (p,p'-DDE + p,p'-DDD + o,p'-DDT + p,p'-DDT) ranged from 23 ± 8.3 to 339 ± 27μg kg-1 fresh weight (fw). The proportions of the metabolites (p,p'-DDD and p,p'-DDE) indicated that anaerobic degradation was the dominant degradation pathway as the concentrations of p,p'-DDD were greater than the concentrations of p,p'-DDE in all the fish samples. These metabolites are formed by anaerobic degradation and aerobic degradation, respectively, in the environment and organisms.2 The composition of the parent compounds (DDT isomers) indicated contamination by technical DDT, which contains p,p'-DDT as the main active ingredient since the concentrations of p,p'-DDT were greater than the concentrations of o,p'-DDT2,17 in all the fish samples. The (p,p'-DDE + p,p'-DDD)/p,p'-DDT ratios were less than 1 in all the fish samples, and they ranged from 0.19 to 0.9 with a mean value of 0.46, indicating that recent inputs were the main sources of the residues in the lake and therefore the fish species were exposed to fresh DDT with some contributions due to historical residues because of the persistence of DDT. Recent sources of DDT were also indicated from the studies of water, soil and sediment samples from the Lake Tanganyika environs.18,19
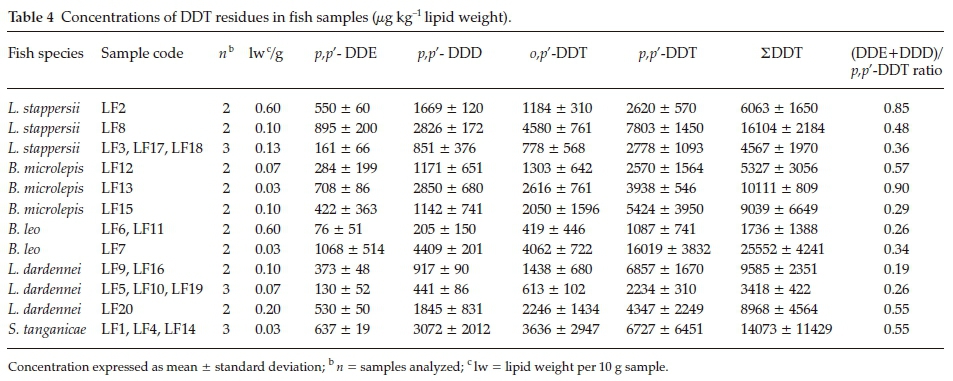
The mean concentrations of total DDT (ug kg-1 fw) in fish species were in the order: S. tanganicae (46.12) < B. microlepis (52) < B. leo (94) < L. dardennei (100) < L. stappersii (187). The trend in the DDT concentrations partly reflected the order of feeding habits. S. tanganicae feed on phytoplankton, copepods and shrimps; B. microlepis (carnivorous) feed mainly on Stolothrissa; B. leo (carnivorous) feed mainly on clupeids (forage fish); L. dardennei (omnivorous) feed on phytoplankton, algae, aquatic plants, worms and fish and L. stappersii (carnivorous) feed on zooplankton, Stolothrissa and shrimps.11 The maximum concentration of total DDT (339 ± 27ug kg-1 fw) was detected in L. stap-persii species. The findings of the highest concentrations of DDT residues in L. stappersii could partly be due to the fact that they were the largest among the fish samples. The contributing factors to the differences in accumulation of DDT residues in fish may include the physico-chemical properties of the compounds, and the differences in biological characteristics (such as sex, maturation state, and age) and feeding habits. The concentrations of DDT residues in fish samples calculated based on lipid (fat) contents of samples are shown in Table 4. The concentrations of total DDT ranged from 1736 ± 1388 ug kg-1 to 25 552 ± 4241 ug kg-1 lipid weight.
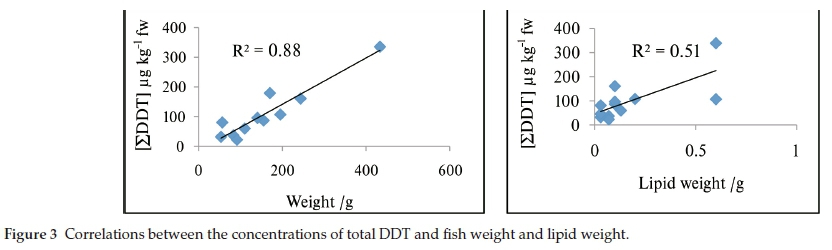
Significant positive correlations between the concentrations of the DDT residues and the weights or lengths of the samples were observed (r values ranged from 0.781 to 0.92, P < 0.0001 to 0.0045, at 22 degrees of freedom), indicating accumulation, and this is partly due to the fact that old (large) fish had been exposed to DDT for longer time than the young (small) ones. Figure 3 shows the correlation between the mean concentrations of DDT and weight. Large weight fish samples had large concentrations of DDT residues compared to the smaller ones. There was a significant correlation between the lipid weights and the concentrations of total DDT in fresh weight (r = 0.699, P = 0.0115) (Fig. 3), indicating accumulation in fat tissues. DDT residues are compounds with high lipid solubility, and are resistant to degradation, therefore accumulate in fat tissues.24,20 However, there was no correlation between the lipid weights and the concentrations of total DDT calculated based on lipid contents.
3.2. Status and Comparison with Maximum Residue Limits and Previous Studies
The concentrations of DDT and the metabolites in all the fish samples were much higher than the extraneous maximum residue limit (EMRL) of 1.0 ug kg-1,21 indicating severe contamination of the aquatic environment by the pesticide residues. The results showed that, the concentrations of the DDT residues are far above the concentrations reported in 2000 in the same lake by Foxall et all who found concentrations of DDT of up to 3 ug kg-1 fresh weight in Stolothrissa tanganicae species, whereas in this study the concentrations of total DDT in the same fish species had a mean value of 46.12 ug kg-1 fresh weight. Foxall et all also reported concentrations of DDE and DDT of 20 and 7 ug kg-1 fresh weight, respectively in Limnothrissa miodon that were generally lower than the concentrations found in the fish species in this study. The concentrations of the DDT residues found in the present study were generally higher than those found in Nile tilapia (Oreochromis niloticus) and Nile perch (Lates niloticus) from Lake Victoria that were up to 20 ug kg-1 fresh weight in fish fillets.14 Another study in Lake Edward, Uganda, also found concentrations of DDT residues in fish species that were lower than the concentrations found in the present study, with mean values of up to 68 ug kg-1 fresh weight.22 The concentrations of the DDT residues expressed per lipid contents were greater than those reported in many Lakes worldwide. For example, the concentrations of the DDT residues detected in fish in northwestern Lake Tanganyika in Burundi were up to 909.1 ± 42.5 kg-1 fat; detected in Boulengerochromis microlepis.8 In Lake Maggiore (Italy), the average concentrations of p,p'-DDT and p,p'-DDE in fish were reported to be 0.81 ±0.39 and 1.69 ± 0.71 mg kg-1 lipids, respectively.23
The observation of the present study that no correlation was found on the concentrations of the DDT residues calculated based on lipid weights is similar to the findings in fish samples collected from Lake Victoria where also no correlation was found between the concentrations of the organochlorine pesticide residues and the fat contents.24 Concentrations of total DDT ranging from 6.88 ± 0.28 to 55.3 ± 4.21 kg-1 wet weight were found in muscle and internal organs of Mugil spp. and in tissues of Tilapia spp. in Lake Qarun, a protected area of Egypt.25 These concentrations were generally lower than most of the concentrations found in different fish species in the present study. The ratios of (DDE + DDD)/DDT found in that study were higher than the ratios of the present study and they indicated that the main source of the DDT residues in Lake Qarun was due to past use, which is contrary to the findings in the study area of the present study. The concentrations of the DDT residues found in the fish species in the present study were greater than the concentrations of 4,4'-DDE, 4,4'-DDT and 4,4'-DDD found in four fish species (Clarias gariepinus, Oreochromis niloticus, Tilapia zillii, and Carassius auratus) from Lake Ziway, Rift Valley, Ethiopia.26 The findings in Lake Ziway showed that 4,4'-DDE was the most predominant contaminant, with mean concentrations ranging from 1.4 to 17.8 ug kg-1 wet weight. The 4,4'-DDE to 4,4'-DDT ratios below 1 in C. auratus suggested a recent exposure to DDT, indicating that a contamination source was present26 and this is similar to the observations in fish species in the present study. A similar study in Lake Prespa, Macedonia27 found p,p'-DDE, p,p'-DDD and p,p'-DDT in muscle tissues of barbus fish (Barbus prespensis) and the concentrations of total DDT contents in the samples ranged from 11.67 to 13.58 kg-1 fresh tissue that were lower than the concentrations found in this study. The results indicated that the dominant contaminant in the samples from Lake Prespa was p,p'-DDE, indicating past exposure to DDT.
Despite the ban of the DDT usage in agriculture which has been in effect for more than two decades ago, the residues are still detected in various compartments of the environment and the results of the present study suggest that the concentrations of DDT residues in fish of Lake Tanganyika are higher than in the previous years. This indicates that DDT is still being used for agricultural activities in recent years. Because DDT is persistent and bioaccumulates in fatty tissues, continued use and exposure will tend to aggravate the concentrations of the residues in fish and other organisms in the lake thereby posing risks to human beings and other aquatic organisms.
4. Conclusion
The concentrations of the DDT residues in fish were generally high; they exceeded the WHO/FAO extraneous maximum residue limits, indicating risks and concerns for public health and the environment. The concentrations of the parent compounds were higher than those of the metabolites. The results indicated exposure due to fresh application of DDT in the area and bioaccumulation of the residues in fish.
Acknowledgements
This study was supported by the Sida-University of Dar es Salaam Food Security Programme (Pesticides and Persistent Organic Pollutants Research, Chemistry Department) and the African Network for the Chemical Analysis of Pesticides (ANCAP). Professor Nilufar Nahar and Mr. Nashir Uddin of the Department of Chemistry, Dhaka University, Bangladesh are gratefully acknowledged for their valuable assistance.
§ORCID iDs
J.A.M. Mahugija: orcid.org/0000-0002-0937-6253
References
1 S. Harrad, Persistent Organic Pollutants, John Wiley & Sons, 2009. [ Links ]
2 ATSDR (Agency for Toxic Substances and Disease Registry), Toxico-logical Profile for DDT, DDEandDDD, U.S. Department of Health and Human Services, Public Health Service, Atlanta, Georgia, 2002. [ Links ]
3 UNEP (United Nations Environmental Programme), Ridding the World of POPs: A Guide to the Stockholm Convention on Persistent Organic Pollutants, Geneva, 2005. [ Links ]
4 WHO (World Health Organization), Persistent Organic Pollutants Impact on Child Health, WHO, Geneva, 2010. [ Links ]
5 H.S. Rathore and L. M. L. Nollet, Pesticides. Evaluation of Environmental Pollution, CRC Press, Boca Raton, FL, USA, 2012. [ Links ]
6 H. Van Den Berg, G. Manuweera and F. Konradsen, Global trends in the production and use of DDT for control of malaria and other vector-borne diseases. Malaria Journal, 2017,16, 401408. [ Links ]
7 C. Foxall, F. Chale, A. Bailey-Watts, G. Patterson and K. West, Pollution Special Study: Pesticide and Heavy Metals in Fish and Molluscs of Lake Tanganyika. Pollution Control and Other Measures to Protect Biodiversity in Lake Tanganyika (UNDP/GEF/RAF/92/G32), Institut National pour Environnement et Conservation de la Nature, Burundi, Ministrie Environnement et Conservation de la Nature, DR Congo, Vice President's Office, Division of Environment, Tanzania, Environmental Council of Zambia, Zambia, 12 p, 2000. [ Links ]
8 P. Manirakiza, A. Covaci, L. Nizigiymana, G. Ntakimazi and P. Schepens, Persistent chlorinated pesticides and polychlorinated biphenyls in selected fish species from Lake Tanganyika, Burundi, Africa, Environmental Pollution, 2002,117, 447-455. [ Links ]
9 Wikipedia, the Free Encyclopedia, Lake Tanganyika, website: https://en.witópedia.orgwiki/Lake_Tanganyika (accessed 15 March 2018). [ Links ]
10 K. West, Lake Tanganyika: Results and Experiences of the UNDP/GEF Conservation Initiative (RAF/92/G32) in Burundi, D.R. Congo, Tanzania, and Zambia, UNDP/GEF, 2001. [ Links ]
11 W.R.T. Darwall, K.G. Smith, D.J. Allen, R.A. Holland, I.J. Harrison and E.G.E. Brooks, eds., The Diversity of Life in African Freshwaters: Under Water, Under Threat. An Analysis ofthe Status and Distribution ofFresh-water Species throughout Mainland Africa, Cambridge, United Kingdom and Gland, Switzerland, 347 pp, 2011. [ Links ]
12 I. Kornfield and P.A. Smith, African cichlid fishes: model systems for evolutionary biology, Annual Review ofEcology and Systematics, 2000, 31, 163-196. [ Links ]
13 L. Nambela, Levels and Chemodynamics of Pesticide Residues in Eastern Lake Tanganyika Basin, Tanzania, MSc thesis, University of Dar es Salaam, 2014. [ Links ]
14 L. Henry and M.A. Kishimba, Pesticide residues in Nile tilapia (Oreochromis niloticus) and Nile perch (Lates niloticus) from Southern Lake Victoria, Tanzania, Environmental Pollution, 2006, 140, 348-354. [ Links ]
15 J.A.M. Mahugija, F.A. Khamis and E.H.J. Lugwisha, Determination of levels of organochlorine, organophosphorus, and pyrethroid pesticide residues in vegetables from markets in Dar es Salaam by GC-MS, International Journal of Analytical Chemistry 2017, 2017, 9 pp., https://doi.org/10.1155/2017/4676724 [ Links ]
16 European Commission, EU, Guidance Document on Analytical Quality Control and Validation Procedures for Pesticide Residues Analysis in Food and Feed, Document No. SANTE/11945/2015 Supersedes SANCO/12571/2013 of 2013, EU, 2015. [ Links ]
17 J.A.M. Marco and M.A. Kishimba, Organochlorine pesticides and metabolites in youngleaves of Mangifera indica from sites near a point source in Coast region, Tanzania. Chemosphere, 2007, 68, 832-837. [ Links ]
18 J.A.M. Mahugija and L. Nambela, Pesticide residues in water from rivers and lakes in Lake Tanganyika basin, Tanzania-Proceedings of the 7th International Toxicology Symposium in Africa held at the Garden Court, O.R. Tambo International Airport in Johannesburg, South Africa, 31st August 2015, pp. 77-78. [ Links ]
19 J.A.M. Mahugija, L. Nambela and A.J. Mmochi, Levels and distribution of pesticide residues in soil and sediments in Eastern Lake Tanganyika environs, International Journal of Biological and Chemical Sciences, 2017,11, 2537-2547. [ Links ]
20 L. Guo, Y. Qiu, G. Zhang, G.J. Zheng, P.K.S. Lam and X. Li, Levels and bioaccumulation of organochlorine pesticides (OCPs) and poly-brominated diphenyl ethers (PBDEs) in fishes from the Pearl River Estuary and Daya Bay, South China, Environmental Pollution, 2008, 152, 604-611. [ Links ]
21 WHO and FAO (World Health Organization & Food and Agriculture Organization), Pesticide Residues in Food and Feed: Extraneous Maximum Residue Limits, Codex Alimentarius Commission, Rome, Italy, 2009. [ Links ]
22 P. Ssebugere, B.T. Kiremire, M. Kishimba, S.O. Wandiga, S.A.Nyanzi and J. Wasswa, DDT and metabolites in fish from Lake Edward, Uganda, Chemosphere, 2009, 76, 212-215. [ Links ]
23 R. Bettinetti, V. Croce, S. Galassi and P. Volta, p,p -DDT and p,p -DDE accumulation in a food chain of Lake Maggiore (Northern Italy): testing steady-state condition, Environmental Science and Pollution Research, 2006,13, 59-66. [ Links ]
24 G.N. Kasozi, B.T. Kiremire, F.W.B. Bugenyi, N.H. Kirsch and P. Nkedi-Kizza, Organochlorine residues in fish and water samples from Lake Victoria, Uganda, Journal of Environmental Quality, 2006, 35, 584-589. [ Links ]
25 A.O. Barakat, M. Khairy and I. Aukaily, Bioaccumulation of organo-chlorine contaminants in fish species from Lake Qarun, a protected area of Egypt, Toxicological & Environmental Chemistry, 2017, 99, 117-133. [ Links ]
26 E. Deribe, B.O. Rosseland, R. Borgstrom, B. Salbu, Z. Gebremariam, E. Dadebo, L. Skipperud and O.M. Eklo, Biomagnification of DDT and its metabolites in four fish species of a tropical lake, Ecotoxicology and Environmental Safety, 2013, 95, 10-18. [ Links ]
27 E.M. Veljanoska-Sarafiloska, M. Jordanoski and T. Stafilov, Presence of DDT metabolites in water, sediment and fish muscle tissue from Lake Prespa, Republic of Macedonia, Journal ofEnvironmental Science and Health Part B, 2013, 48, 548-558. [ Links ]
Received 12 June 2017
Revised 2 May 2018
Accepted 15 June 2018
* To whom correspondence should be addressed. E-mail: mahugija@udsm.ac.tz; johnmahugija@yahoo.com

