


Services on Demand
Article
 English (pdf)
 Article in xml format
 Article references
Indicators

Related links
-
 Cited by Google
 -
 Similars in Google
Share

 Permalink
South African Journal of Chemistry
On-line version ISSN 1996-840X
Print version ISSN 0379-4350
S.Afr.j.chem. (Online) vol.71 Durban 2018
http://dx.doi.org/10.17159/0379-4350/2018/v71a10
RESEARCH ARTICLE
Simultaneous determination of nitrate, nitrite and phosphate in environmental samples by high performance liquid chromatography with UV detection
Mohau N. MoshoeshoeI, *; Veronica ObusengII
IDepartment of Chemistry and Chemical Technology, National University of Lesotho. P.O. Roma 180. Lesotho
IIDepartment of Chemistry, University of Botswana. Private Bag 00704, Gaborone, Botswana
ABSTRACT
An HPLC method using an UV detector was developed for the simultaneous determination of nitrites, nitrates and phosphates in environmental samples. Chromatographic separation was achieved isocratically on a Phenomenex Synergi Polar-RP LC column using acetonitrile and acidified water (pH 2.7) at 60:40 v/v as mobile phase. Baseline resolution of all the three analytes was achieved within 3 min. The developed method was applied to water samples obtained from the wastewater treatment plant in Gaborone, Botswana. The use of HPLC technique in this study demonstrated its ability to carry out a simultaneous determination of NO2",NO3" and PO43- in water samples. The treatment plant was found to be functioning within expectations, removing 97.6 % NO2-, 88.0 % NO3- and 90.9 % PO43- from the received wastewater. Results of the developed method were comparable with those of the traditional ion chromatography method, showing accuracy values between 95.22 % and 98.04 %. The precision of the method for the determination of all analytes was determined by RSD values, all of which were lower than 5 %. The method is of low cost, fast, has an easy procedure and avoids the use of many reagents - some of which may be hazardous.
Keywords: HPLC-UV, simultaneous determination, nitrate, nitrite, phosphate.
1. Introduction
Nitrogen is a vital nutrient for both plants and animals1.Inthe environment, it exists as nitric oxide (NO), nitrite (NO2-) and nitrate (NO3-). These are ever-present in everyday samples such as environmental, food and biological samples.2 In water, NO3-occurs both naturally and through external inputs which may include run-off from agricultural soils, soil organic matter as well as livestock and human faecal material.3 Contamination of groundwater resources by nitrate is mainly a consequence of anthropogenic activities and uncontrolled discharges from industries, agricultural activities, sewage treatment plants and pit latrines.4
Contamination of water and food sources by nitrate is a concern as it may result in methemoglobinaemia,5 which may eventually lead to mental retardation.6 Nitrite may react with amines in human bodies to form nitrosamines, which are said to be carcinogenic.1 In surface waters, excess nitrates and nitrites lead to algal blooms, resulting in lowered levels of oxygen in the water, leading to eutrophication.7
Phosphates are of great importance in numerous fields such as in the manufacturing of fertilizers, detergents, beverages and semiconductors.8,9,10 However, excessive phosphorus concentration in waters leads to overgrowth of aquatic plants and algal bloom formation, which ultimately result in the depletion of dissolved oxygen in water. This is then followed by the death and decay of aquatic life and degradation of the water quality.11,12,13
It is for the above-mentioned reasons that a simple and sensitive analytical method is desirable for the monitoring and routine analysis of nitrates, nitrites and phosphates, both in water and soil samples.
Several analytical techniques such as electrophoresis,14 potentiometry,15 gas chromatography (GC)2, ion exchange chromatography (IC),16 and high-performance liquid chroma-tography (HPLC)2 have been applied in the determination of NO3-,NO2- and PO43- in different samples. Many of these techniques (e.g. electrophoresis) suffer from drawbacks such as interferences caused by sample matrix17 and/or lack of reproducibility of retention times which can cause errors in peak identification.18 Although electroanalytical techniques such as potentiometry, amperometry, voltammetry and polarography do not suffer from interferences and do not require extensive pre-treatments,19 they however tend to suffer from poor reproducibility upon reuse15 due to poisoning of the biosensor films used in them. GC cannot be used in the determination of PO43- due to its requirement that the analyte be highly volatile.20,21
IC is normally the method of choice for the determination of these nutrients. Examples include the analysis of water (natural, waste and seawater),16 sediments,22 fertilizers and soils,23 food-stuffs,23 dairy products24 and clinical fluids.25 Although IC is characterized by high sensitivity, it is prone to temperature variations and matrix effects - particularly in the determination of nitrate in the presence of chlorides (Cl-), sulphate (SO4 2-) and bromide (Br-).26,27 Modifications to try and circumvent this problem resulted in lower sensitivities and poor resolution between the analyte and interferents peaks.28 In order to circumvent these difficulties, extensive sample preparations and separation steps are needed, which usually lead to increased overall determination time and low sample throughput.5,24
HPLC is a much more rapid, sensitive and selective technique than most methods of analysis, hence it is a better choice for the determination of nitrate, nitrite and phosphate in water samples. Although the determination of NO2-,NO3-, and PO/- has been carried out using HPLC, the simultaneous determination of these analytes are limited. The objective of this study was therefore to develop a specific, sensitive, cost-effective, and reliable analytical method that can be applied in the simultaneous determination of nitrate, nitrite and phosphate. The attributes of the developed method (e.g. precision, accuracy, LOD, etc.) were determined by comparing HPLC results with those obtained from the IC method.
2. Materials and Methods
All commercially available reagents (potassium dihydrogen phosphate, sodium nitrite, sodium nitrate, potassium thio-cyanate) used in this study were of analytical-reagent grade and were used without further purification. HPLC grade methanol and acetonitrile were used as solvents. Distilled, de-ionized water (DDW, 18 Ω cm-1) was used in all sample preparation procedures. All glassware used was soaked in 10 % HCl for 24 h, and rinsed several times with DDW prior to use.
Different mobile phase compositions in various mixture ratios using methanol (Sigma-Aldrich, Steinheim, Germany), acetonitrile (Sigma-Aldrich, Steinheim, Germany) and DDW, were used to elute the prepared analyte standards.
A Dionex, seven-anion standard mixture (purchased from Thermo Fisher Scientific, California, USA), which contains a mixture of F- (20 ppm) , Cl- (100 ppm), NO2- (100 ppm), Br-(100 ppm), NO3-(100 ppm), PO43- (200 ppm) and SO42- (100 ppm) was used to prepare calibration mixtures for nitrate, nitrite and phosphate within a working range of 1 to 100 ppm in DDW. Working standards were freshly prepared daily in 50 mL volumetric flasks.
2.1. Sample Collection
Wastewater samples were collected from the Glenvalley Wastewater Treatment Plant (GVWTP) in Gaborone, Botswana, on 24 February 2015. Samples were collected from the treatment plant at the inlet, primary settlement tank, secondary settlement tank, aeration tank and final effluent. They were immediately taken to the laboratory and stored at 4 °C until further analysis.
2.2. Experimental
2.2.1. Sample Preparation
Water samples were filtered through a 0.45 μm Minisart® Plus syringe membrane filter into a 100 mL volumetric flask. KSCN was added as an internal standard and the solution made up to the mark with water. KSCN was used because its retention time was found to be close to that of the analytes of interest. Furthermore, it is not expected to be present in the wastewater samples. The solution was then analyzed using HPLC and ion chroma-tography as outlined in sections 2.2.2 and 2.2.3, respectively.
2.2.2. HPLC Method Optimization
Analyses with HPLC-UV were performed using an Agilent Technologies HPLC-UV (Agilent Infinity Series 1260 - DAD) equipped with a diode array detector and manual injection, with a loop volume of 20 μL. The software used was an OpenLab CDS Chemstation Software. In order to achieve the best method characteristics, the main parameters leading to a good separation in HPLC (mobile phase composition, temperature, pH, flow rate, etc.) were optimized.
The stationary phase used was a Phenomenex Synergi Polar-RP LC column, with the dimensions: 150 x 4.6 mm 4 μm, 80 A.
The wavelength of maximum absorbance for all the analytes was determined with an Evolution 201 UV-Vis spectrophotometer (Thermo Scientific, USA), set to scan peaks atλ = 190 nm to 800 nm. A mixture of standard solutions of NaNO3, NaNO2 and Na3PO4 was then made, in which the concentration of each of the analytes was 20 ppm each. This mixture was also scanned using the same UV-VIS spectrophotometer at a wavelength range of 190-800 nm. For all the analytes of interest, λmax was found to be 207 nm. This wavelength was then used for all subsequent experiments using an Agilent Technologies HPLC-UV equipped with a diode array detector.
Different mobile phase compositions in various mixture ratios using methanol, acetonitrile and DDW, were used to elute the prepared analyte standards. Experiments were carried out using methanol, acetonitrile and water at various methanol:water and acetonitrile:water ratios (from 100:0 v/v to 0:100 v/v each). A mixture of the analytes (in which the final concentration of each analyte was 20 ppm) was injected at these mobile phase compositions in order to investigate and optimize the separation.
The pH of the mobile phase was altered by adding concentrated H2SO4 to the aqueous part of the mobile phase so as to vary the pH of the aqueous part in the range of 0.5 to 6.5, at increments of 0.5 units. A mixture of the analytes (20 ppm each) was injected at each pH value in order to investigate and optimize the separation of the different analytes.
Column temperature was varied from 10 °C up to 70 °C, at increments of 5 °C for experiments carried out usingboth methanol and acetonitrile as organic modifiers.
Optimization of the mobile phase volumetric flow rate was carried out in the range of 0.2 mL min-1 to 1.5 mL min-1 using the optimum conditions found for other HPLC parameters as explained above. The best separation conditions, hence the optimum mobile phase flow rate, was determined based on the resolution between the different components at each flow rate. The total analysis time was also taken into consideration.
2.2.3. Ion Chromatography (IC) Analysis
A Dionex ICS-2100 Ion Chromatography system equipped with an auto-sampler (injection volume = 5 mL) and Chrome-leon® Chromatography Data System software were used in this study. The chromatography system was fitted with a 2 x 250 mm IonPac AS18 Analytical Column, preceded bya2x50mm IonPac AG18 Guard Column. The EGC III KOH Cartridge was used as an eluent source, set to produce an eluent of 32 mM potassium hydroxide. The column temperature was set to 30 °C and the flow rate set at 0.25 mL min-1. Detection was carried out using a DS6 heated conductivity cell.
2.2.4. Recovery Calculations
The accuracy of the HPLC method was expressed through recovery calculations using wastewater samples that had previously been analyzed and found to contain 34,21 and 6 ppm NO2-,NO3-, and PO43-, respectively. Three different concentrations of each analyte were prepared by measuring 2.5 mL of the wastewater sample in three different volumetric flasks, then spiking with different amounts of 1000 ppm stock solution (of each analyte) and making up to 10 mL final volume with DDW This formed final concentrations of 10 ppm, 50 ppm and 100 ppm each of NO2-,NO3-, and PO43-in the different volumetric flasks. The blank was determined by analysing DDW. These spiked samples were then analyzed with both HPLC and Ion chromatography.
3. Results and Discussion
3.1. HPLC Method Optimization
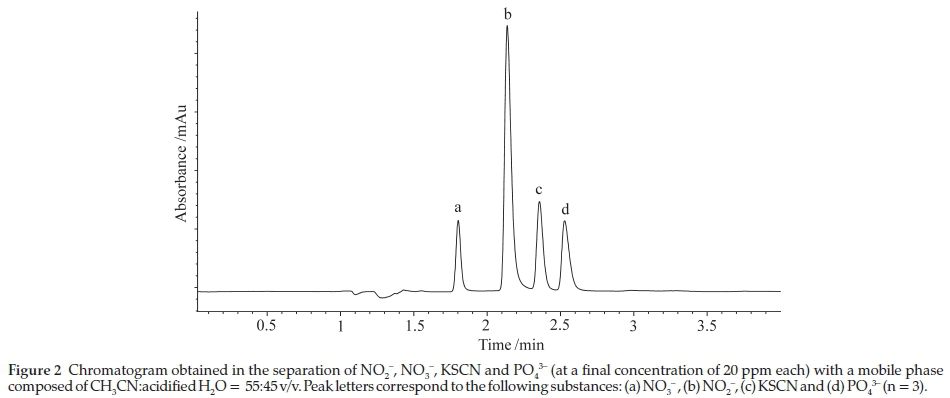
Figures 1 and 2 show the chromatograms which were obtained using a 20 ppm mixture of nitrate, nitrite and phosphate standards at an optimum wavelength of 210 nm.
Elution was improved by increasing the amount of the aqueous component (CH3CN:acidified H2O = 55:45 v/v). This resulted in a better resolution between all the three analytes (Fig. 2). An additional increase in the polarity of the mobile phase (CH3OH:acidified H2O = 50:50 v/v) resulted in loss of resolution even though there was a slight improvement in the shapes of some peaks. Further loss of resolution resulted when the mobile phase was made more polar.
Since a high throughput and productivity was also required, the time of analysis (i.e. method run-time) was also considered. A method with a short run-time saves time and expense, hence it is preferred. Baseline resolution of all the three analytes was achieved at the shortest possible time (3 min; Fig. 2) using a mobile phase composition of MeCN: acidified H2O (pH 2.7) = 55:45 v/v. This is an improvement when compared to the ion chromatography method, which has a total run time of more than 10 minutes (see Fig. 4).
3.2. Analytical Parameters
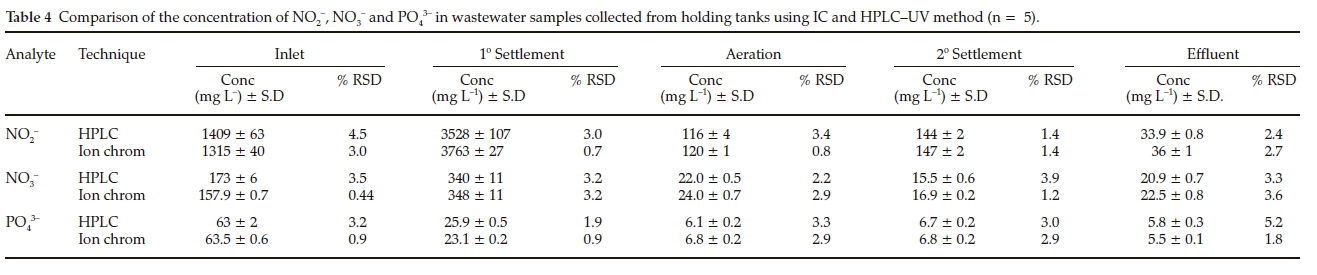
The developed HPLC method was validated by determining its figures of merit (accuracy, precision, linearity, limits of detection (LOD) and quantification (LOQ)). The results obtained from the developed method were comparable with those from the traditional IC method. Table 1 shows the numerical values of the concentrations obtained by the two methods.

As shown in Table 1, the recoveries for all samples at all levels were found to be above 88.4 %. The high level of accuracy, together with low RSD values (which were found to range from 1.3 % (NO2-)to4.9%(PO43-)) indicate that the HPLC method is accurate and precise - hence reliable and its results can be trusted.
Linearity was assessed based on a plot of the analyte peak area ratios to IS (KSCN) against analyte concentration. The results proved to be linear and acceptable, as the correlation coefficients (R2) were greater than 0.999 for all the analytes (Table 2).
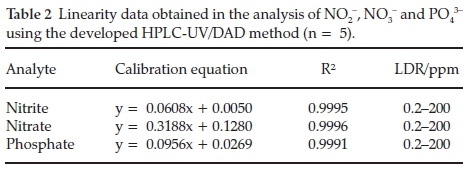
Linear Dynamic Range (LDR) was determined over the concentration range of 0.2-200 mg mL-1, which is a significant progress when compared with most methods for the analysis of nitrate and nitrite, which are linear over only very narrow concentration ranges. These wide linearity ranges enabled quantification of the analytes at different process points.
The calibration sensitivity, defined by IUPAC29 as the slope of the calibration curve is also reported in Table 2. The high sensitivity values obtained for the analytes imply that low injection volumes will be adequate for detection.
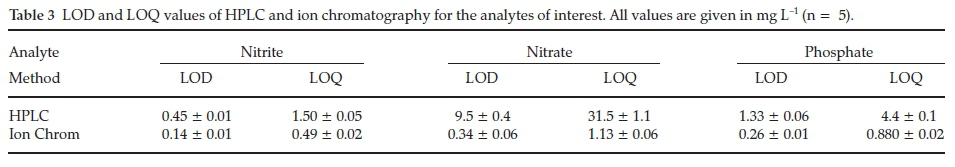
The limits of detection (LODs) and limits of quantification (LOQs) were estimated based on the signal background noise. Chromatograms resulting from the analysis of the standards with the lowest concentration (0.01 mg L-1) were used in the calculation of the level of noise30. The LODs and LOQs were calculated from Equations 1 and 2, respectively


where yb = blank signal, and sb = standard deviations of the blank samples spiked with low concentration of analytes.
The LODs obtained by the HPLC-UV/DAD method are given in Table 3.
These values are considerably higher than the LODs obtained by IC and the limits established by WHO31. Nevertheless, they are lower than the typical concentrations of these analytes in wastewater samples, therefore the HPLC method is still valid for analysis of this type of samples.
3.3. Application of Method to Wastewater Samples
Wastewater entering the GVWTP contains considerable amounts of nitrates, nitrites and phosphates due to the chemicals used in both households and industries. The purpose of the treatment plant is to reduce the amount of these analytes as the water goes through the different treatment stages.
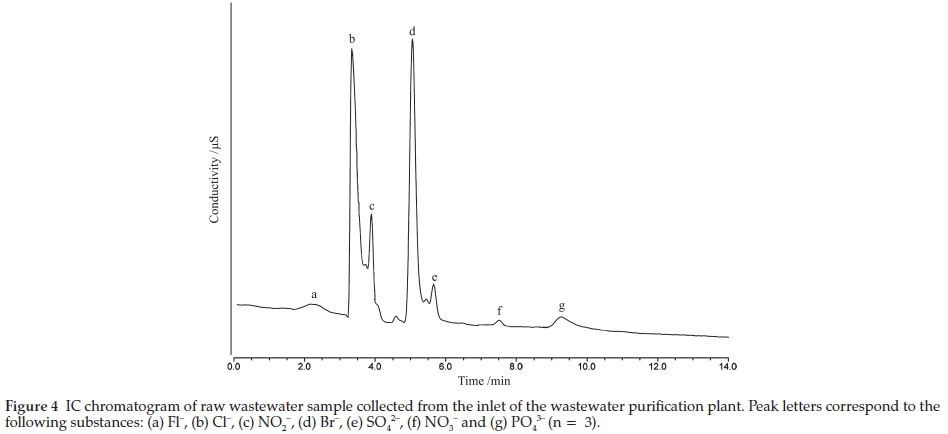
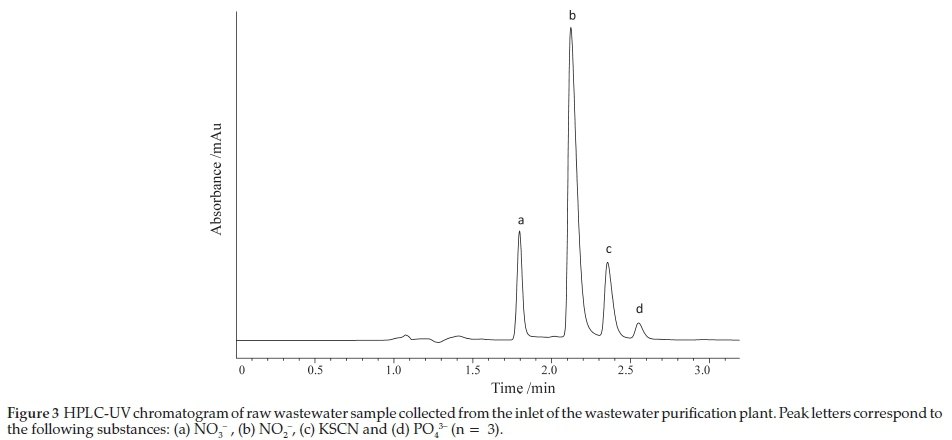
The selectivity of the method was established by the analysis of water samples obtained from the inlet of the wastewater treatment plant. These are the dirtier samples as they have not yet undergone any treatment. No interferent peaks were observed at the retention times of NO2-,NO3- and PO43- in any of the samples (Fig. 3). A chromatogram obtained from the analysis of the same sample by ion chromatography is shown in Fig. 4.
Since ion chromatography is not selective to the analytes of interest, it is prone to interferences which result from matrix components. More often than not, it was difficult to integrate the nitrite peak quantitatively due to the interference caused by chloride. As a result, analysis by ion chromatography requires more sample clean-up steps to remove the interfering species. This increases the overall analysis time and sample handling steps, which may lead to sample losses and/or the introduction of artifacts.
IC was however found to be more precise than HPLC. Table 4 shows the standard deviation and %RSD values obtained in the determination of NO2-,NO3- and PO43- in wastewater tanks. Standard deviation values and %RSD (ion chromatography) range from 0.44-3.6, while %RSD (HPLC) range from 1.4-5.2.
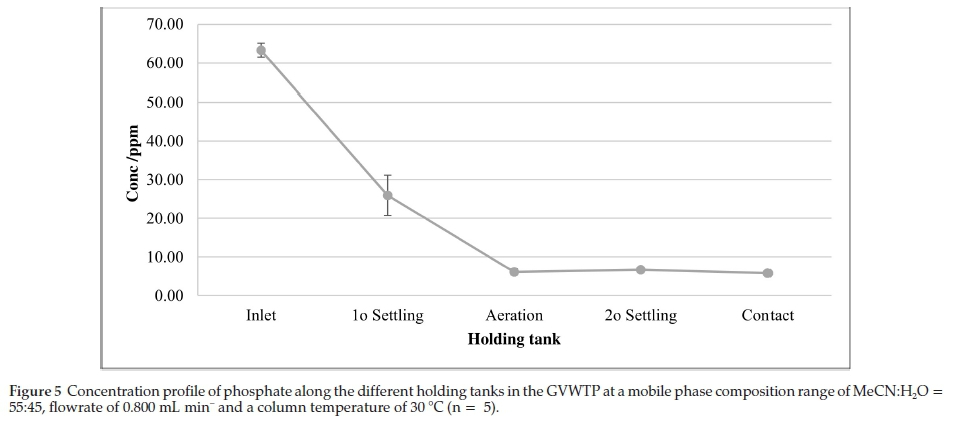
The effects of treatment process on the amount of PO43- is shown in Fig. 5.
The water obtained from the effluent tank (at the end of the treatment process) was found to have 9.11 % of the amount of phosphate initially present at the inlet. This translates to a phosphate removal efficiency of 90.89 %. Similar trends were observed for nitrites and nitrates, with a removal efficiency of 97.59 % and 87.99 %, respectively (see Table 5).
The removal of nitrogen in the water occurs through nitrification - a process in which ammonia is biologically converted to nitrite and subsequently to nitrate.32,33 This process is followed by denitrification, where nitrate is reduced to nitrogen gas.34 It is due to the denitrification process that the amounts of NO2- and NO3- are reduced as the water travels to the secondary settling tank, aeration tank and contact tanks.
The removal of phosphate in the wastewater is also seen to be effective since the phosphate amount decreases as the waste-water travels through the treatment process. Phosphorus in wastewater can be removed biologically by polyphosphate-accumulating organisms, which accumulate large quantities of phosphate within their cells.35,36 Chemical removal of phosphorus in wastewater also occurs through precipitation with lime, alum or iron.40
Although the removal efficiency of these nutrients is satisfactorily high, the amounts of the analytes in the effluent were still above the limits set by the Water Utilities Company as shown in Table 5. This is in contrast to the studies done in 2005 by Nkegbe el al.,38who found the effluents to be above the maximum allowable effluent levels of <1 (PO43-) and <5 (NO3-), thereby implying that the wastewater treatment process is not functioning accordingly in the removal of the analytes of interest from wastewater. This water however undergoes further natural treatment as the effluent from the plant is released to maturation ponds and then discharged to the Notwane River. Some of the water is used to irrigate golf courses, lawns and crops grown under the Glen Valley irrigation project.39
4. Conclusions
The use of HPLC technique in this study demonstrated its benefit of being able to carry out a simultaneous determination of NO2-,NO3- and PO43- in water samples. Furthermore, HPLC is fast and does not require extensive sample preparations, which may lead to sample losses and the introduction of artifacts. It also does not require derivatization, hence avoids the use of many reagents - some of which may be hazardous. Furthermore, HPLC is efficient and economical as it requires the use of fewer amounts of reagents. A single injection in HPLC requires fillinga 20 loop. In contrast, IC requires a sample volume of 5 mL, all of which is consumed in a single injection.
The developed method was employed to quantify nitrite, nitrate and phosphate content of water from different stages of a wastewater treatment plant. The analyte concentrations were found to be reducing at each stage of treatment, with percentage removal of 97.6 % (NO2-), 87.9 % (NO3-) and 90.8 % (PO43-).
Although the final effluent has not been tested for the presence/absence of pathogenic organisms, it is, however, environmentally friendly with regards to the analytes of interest and may be used for applications which do not require potable water (such as irrigational or industrial purposes). Although this may not directly augment existing water sources, it may provide an additional source of water supply which will assist in meeting the water needs of Botswana.
References
1 A.A. Chetty and S. Prasad, Flow injection analysis of nitrate-N determination in root vegetables: study of the effects of cooking, Food Chem., 2009,116, 561-566. [ Links ]
2 M. Akyüz and S. Ata, Determination of low level nitrite and nitrate in biological, food and environmental samples by gas chromatogra-phy-mass spectrometry and liquid chromatography with fluorescence detection, Talanta, 2009, 79, 900-904. [ Links ]
3 P. Mikuska and Z. Vecera, Simultaneous determination of nitrite and nitrate in water by chemiluminescent flow-injection analysis. Anal. Chim. Acta., 2003,495, 225-232. [ Links ]
4 G. Stamatis, D. Alexakis, D. Gamvroula and G. Migiros, Groundwater quality assessment in Oropos-Kalamos basin, Attica, Greece, Environ. Earth Sci., 2011, 64, 973-988. [ Links ]
5 R. Burakham, M. Oshima, K. Grudpan and S. Motomizu, Simple flow-injection system for the simultaneous determination of nitrite and nitrate in water samples, Talanta, 2004, 64, 1259-1265. [ Links ]
6 M. Cemek, L. Akkaya, Y. O. Birdane, K. Seyrek, S. Bulut and M. Konuk, Nitrate and nitrite levels in fruity and natural mineral waters marketed in western Turkey, J. Food Compos. Anal., 2007,20,236-240. [ Links ]
7 A.J. Lyddy-Meaney, P.S. Ellis, P.J. Worsfold, E.C.V Butler and I.D. McKelvie, A compact flow injection analysis system for surface mapping of phosphate in marine waters, Talanta, 2002, 58, 1043-1053. [ Links ]
8 S. Motomizu and Z.H. Li, Trace and ultratrace analysis methods for the determination of phosphorus by flow-injection techniques, Talanta, 2005, 66, 332-340. [ Links ]
9 P. Hrynczyszyn, A. Jastrzçbska and E. Szlyk, Determination of phosphate compounds in meat products by 31-Phosphorus Nuclear Magnetic Resonance spectroscopy with methylenediphosphonic acid after alkaline extraction, Anal. Chim. Acta, 2010, 673, 73-78. [ Links ]
10 B. Welz, F. G., Lepri, R.G.O., Araujo, S.L.C., Ferreira, M., Huang, M. Okruss and H. Becker-Ross, Determination of phosphorus, sulfur and the halogens using high-temperature molecular absorption spectrometry in flames and furnaces - A review, Anal. Chim. Acta, 2007, 647, 137-148. [ Links ]
11 A.N. Ejhieh and N. Masoudipour, Application of a new potentiome-tric method for determination of phosphate based on a surfactant-modified zeolite carbon-paste electrode (SMZ-CPE), Anal. Chim. Acta, 2010, 658, 68-74. [ Links ]
12 G. Nagendrappa, M.S. Mahadevaiah, Y. Kumar, S., Mansour, A. Galil, M.S. Suresha and M.A. Sathish, A simple spectrophotometric determination of phosphate in sugarcane juices, water and detergent samples, E-J. Chem., 2007,4, 467-73. [ Links ]
13 B. Shyla, Mahadevaiah and G. Nagendrappa, A simple spectropho-tometric method for the determination of phosphate in soil, detergents, water, bone and food samples through the formation of phosphomolybdate complex followed by its reduction with thiourea, Spectrochim. Acta, Part A, 2011, 78, 497-502. [ Links ]
14 D. Connolly and B. Paull, Rapid determination of nitrate and nitrite in drinking water samples using ion-interaction liquid chromatography, Anal. Chim. Acta, 2001,441, 53-62. [ Links ]
15 M. Sohail and S.B. Adeloju, Electroimmobilization of nitrate reductase and nicotinamide adenine dinucleotide into polypyrrole films for potentiometric detection of nitrate, Sens. Actuators, B., 2008, 133, 333-339. [ Links ]
16 J.R.E. Thabano, D. Abong'o and G.M. Sawula, Determination of nitrate by suppressed ion chromatography after copperised-cad-mium column reduction, J. Chromatogr. A., 2004,1045, 153-159. [ Links ]
17 M.C.B. Alonso and R. Prego, Determination of silicate, simultaneously with other nutrients (nitrite, nitrate and phosphate), in river waters by capillary electrophoresis. Anal. Chim. Acta., 2000, 416, 21-27. [ Links ]
18 C. Francois, Ph. Morin and M. Dreux, Effect of the concentration of 18-crown-6 added to the electrolyte upon the separation of ammonium, alkali and alkaline-earth cations by capillary electrophoresis, J. Chromatogr. A, 1995, 706, 535-553. [ Links ]
19 S. Cosnier, S. Da Silva, D. Shan and K. Gorgy, Electrochemical nitrate biosensor based on poly(pyrrole-viologen) film-nitrate reductase-clay composite, Bioelectrochemistry., 2008, 74,47-51. [ Links ]
20 S.M. Helmke and M.W. Duncan, Measurement of the NO metabolites, nitrite and nitrate, in human biological fluids by GC-MS, J. Chromatogr. B: Biomed. Sci. Appl., 2007, 851, 83-92. [ Links ]
21 Z. Liu and S. Rochfort, A fast liquid chromatography-mass spectrometry (LC-MS) method for quantification of major polar metabolites in plants, J. Chromatogr. B: Biomed. Sci. Appl., 2013, 912, 8-15. [ Links ]
22 M. Colina, H. Ledo, E. Gutiérrez, E. Villalobos and J. Marin, Determination of total phosphorus in sediments by means of high pressure bombsandionchromatography,J. Chromatogr. A, 1996,739,223-227. [ Links ]
23 C.D. Stalikas C.N. Konidari and C.G. Nanos, Ion chromatographic method for the simultaneous determination of nitrite and nitrate by post-column indirect fluorescence detection, J. Chromatogr. A, 2003, 1002,237-241. [ Links ]
24 L.W. Gapper, B.Y. Fong, D.E. Otter, H.E. Indyk and D.C. Woollard, Determination of nitrite and nitrate in dairy products by ion exchange LC with spectrophotometric detection, Int. Dairy J., 2004, 14, 881-887. [ Links ]
25 M.I.H. Helaleh and T. Korenaga, Ion chromatographic method for simultaneous determination of nitrate and nitrite in human saliva, J. Chromatogr. B: Biomed. Sci. Appl., 2000, 744, 433^37. [ Links ]
26 K. Ito, Y. Takayama, N. Makabea, R. Mitsui and T. Hirokawa, Ion chromatography for determination of nitrite and nitrate in seawater using monolithic ODS columns, J. Chromatogr. A, 2005, 1083, 63-67. [ Links ]
27 I. Dahllöf, O. Svensson and C. Torstensson, Optimising the determination of nitrate and phosphate in sea water with ion chromatogra-phy using experimental design, J. Chromatogr. A, 1997, 771, 163-168. [ Links ]
28 T.F. Rozan and GW. Luther III, An anion chromatography/ultraviolet detection method to determine nitrite, nitrate, and sulfide concentrations in saline (pore) waters, Mar. Chem., 2002, 77, 1-6 [ Links ]
29 L.A. Currie, Nomenclature in evaluation of analytical methods including detection and quantification capabilities: (IUPAC Recommendations 1995). Anal. Chim. Acta, 1999, 391, 105-126. [ Links ]
30 T.F. Gondo, Employing SPME as an Extraction Technique for Pesticide Analysis in Traditional Medicinal Plants. M.Sc. thesis in Analytical Chemistry, University of Botswana, Gaborone, Botswana, 2015 [ Links ]
31 WHO 2011. Guidelines for drinking-water quality, 4th edition, World Health Organization, online at: http://www.who.int/water_sanita-tion_health/publications/2011/dwq_guidelines/en/, accessed on 3 March 2015. [ Links ]
32 EPA. 2002. Nitrification, online at: http://www.epa.gov/safewater/disinfection/tcr/regulation_revisions.html, accessed on 26 August 2014. [ Links ]
33 M. Strous, E. Van Gerven, P. Zheng, J.G. Kuenen and M.S.M. Jetten, Ammonium removal from concentrated waste streams with the anaerobic ammonium oxidation (anammox) process in different reactor configurations, Water Res., 1997, 31, 1955-1962. [ Links ]
34 R. Knowles, Denitrification, Microbiol. Rev., 1982,46, 43-70 [ Links ]
35 N. Kishida, J. Kim, S. Tsuneda and R. Sudob, Anaerobic/oxic/anoxic granular sludge process as an effective nutrient removal process utilizing denitrifying polyphosphate-accumulating organisms, Water Res., 2006,40, 2303-2310. [ Links ]
36 A. Oehmen, A.M. Saunders, T.M. Vives, Z. Yuan and J. Keller, Competition between polyphosphate and glycogen accumulating organisms in enhanced biological phosphorus removal systems with acetate and propionate as carbon sources, J. Biotechnol., 2006, 123, 22-32. [ Links ]
37 L.E. de-Bashan and Y. Bashan, Recent advances in removing phosphorus from wastewater and its future use as fertilizer (1997-2003), Water Res., 2004, 38, 4222-4246. [ Links ]
38 E. Nkegbe, V. Emongor, I. Koorapetsi, Assessment of effluent quality at Glen Valley wastewater treatment plant, J. Appl. Sci., 2005, 5, 647-650. [ Links ]
39 Y. Monyamane, Risk Analysis of Wastewater Use in Crop Production: A Case ofGlen Valley Irrigation Scheme, Botswana, M.Sc. thesis in IWRM, University of Zimbabwe, Harare, Zimbabwe, 2011. [ Links ]
Received 13 December 2017
revised 13 June 2018
accepted 15 June 2018
* To whom correspondence should be addressed. E-mail: mn.moshoeshoe@nul.ls

