


Serviços Personalizados
Artigo
 Inglês (pdf)
 Artigo em XML
 Referências do artigo
Indicadores

Links relacionados
-
 Citado por Google
 -
 Similares em Google
Compartilhar

 Permalink
South African Journal of Chemistry
versão On-line ISSN 1996-840X
versão impressa ISSN 0379-4350
S.Afr.j.chem. (Online) vol.71 Durban 2018
http://dx.doi.org/10.17159/0379-4350/2018/v71a9
RESEARCH ARTICLE
The effect of synthesis method on the structure, and magnetic and photocatalytic properties of hematite (a-Fe2O3) Nanoparticles
Ibrahim Abdulkadir; Hafiz M.I. Abdallah; Sreekantha B. Jonnalagadda; Bice S. Martincigh*
School of Chemistry and Physics, University of KwaZulu-Natal, Westville Campus, Private Bag X54001, Durban 4000, South Africa
ABSTRACT
Samples of hematite (a-Fe2O3) nanoparticles have been synthesized through the co-precipitation route in cetyltrimethyl-ammonium bromide (Hem_PR), via a citric acid sol-gel method (Hem_SG) and a modified sol-gel method in Tween 20 (Hem_TW), and each were annealed at three different temperatures (400,500 and 600 °C). The samples were characterized by X-ray diffraction (XRD), Fourier transform infrared spectroscopy (FTIR), transmission and high-resolution electron microscopy (TEM and HRTEM), Mössbauer spectroscopy and by means of a vibrating sample magnetometer (VSM). In addition, the photocatalytic behaviour of each sample was tested on the degradation of rhodamine B (RhB) in solution. All the characterization techniques showed the formation of phases of pure hematite nanoparticles with improved crystallinity after higher temperature annealing. However, the nanoparticles synthesized in Tween 20 showed the smallest particle size and highest BET surface area, saturation magnetization and photocatalytic activity. Of particular note was the ability of Tween 20 to control the growth of the particles so that grain sizes well below 10 nm were obtained. Thus, Tween 20, when used as a surfactant in the sol-gel route, can serve to improve the physical properties of synthesized hematite nanoparticles.
Keywords: Hematite, nanoparticles, Mössbauer spectroscopy, magnetic properties, Tween 20, photocatalysis.
1. Introduction
Hematite, a-Fe2O3, is the most thermodynamically stable of all the known iron oxides. It exhibits n-type semiconducting properties at ambient conditions and has a band gap energy of 2.1 eV which falls within the visible region of the electromagnetic spectrum. When the oxide is prepared in nano-dimensions it exhibits novel physical and chemical properties. Lately, a-Fe2O3 nanoparticles have received increased interest due to some of their fascinating properties which stand out from those of the bulk material. Their low cost and non-toxicity, coupled with their wide range of applications, for example, they have found use in pigments,1,2 lithium ion batteries and gas sensors,3,4 catalysis,5,6 optical and biomedical devices,7,8 water purification,9 solar energy conversion and magnetic materials,3,10 have made a-Fe2O3 nanoparticles the most investigated of all iron oxides.
Hematite nanoparticles of different shapes and sizes can form and these include nanorods,11,13 nanofibres,14,15 nanowires16,17 and nanocubes,18 among others. Various techniques have been used to synthesize a-Fe2O3. These include hydrothermal approaches, sol-gel processes, combustion, microemulsion techniques, pyrolysis and ultrasonic-assisted methods. The sol-gel and co-precipitation methods stand out as methods capable of producing high yields of a-Fe2O3 nanoparticles, with sol-gel being more hands-on in terms of morphology control.19 It is known that the synthesis conditions strongly affect the physico-chemical properties of the product. Consequently, it is expected that by using a different reaction medium or adding a surfactant in the preparation process might influence some of the physical properties (e.g. size, porosity, surface area) of the nanoparticles.20,21
The sol-gel method of synthesis of semiconductor metal oxides and ceramic materials is extremely versatile and can be used to fabricate inorganic nanomaterials with very good control over size and morphology. Organic molecules or polymers are added to colloidal dispersions of metal ions to form the sol. Removal of the solvent molecules leads to the formation of the gel. Subsequent thermal treatment results in the product. The nucleation here depends on the various weak forces (hydrogen bonds, weak van der Waals forces and the hydrophobic interactions between functional groups) acting in the reaction medium.22 The Pechini type synthesis method makes use of chelating organic molecules (citric acid and ethylene glycol) to form a homogeneous solution of metal/citrate complex and has been shown to be extremely handy in the fabrication of metal oxides.23,24
In this paper, hematite nanoparticles were prepared by means of three different routes, namely; (i) chemical precipitation in a cetyltrimethylammonium bromide (CTAB) solution, (ii) a sol-gel method in citric acid solution, and (iii) a sol-gel type method in the presence of the surfactant Tween 20, with a view to study and compare the structure, and magnetic, as well as photocata-lytic properties of the products that would be obtained from the first two processes and the one from the Tween 20 medium. Tween 20, a polysorbate type non-ionic surfactant with a long hydrocarbon chain, has not been used for the synthesis of hematite and could better help in limiting the growth of the crystals thereby effecting a better size and shape control process. Magnetic and photocatalytic properties have also been shown to be influenced by morphology and surface area, and, hence, the synthesis medium. Tween 20 may be better at incorporating some water or carbon atoms into the materials, which would then help in limiting grain size as well as provide the pores that are needed for higher surface area once the material is calcined.25,26
2. Experimental
2.1. Materials
All reagents were used as received. These were Fe(NO3)3.9H2O (98 % Saarchem), NaOH (98 % Saarchem), citric acid (99.7 % BDH Laboratories), Tween 20 (Prosynth grade Riedel-de Haën) and CTAB (95 % Aldrich Chemicals). The deionized water used was from a Millipore Elix 5 UV Milli-Q apparatus.
2.2. Synthesis
2.2.1. Co-precipitation
Fe(NO3)3.9H2O (0.02 moles) was dissolved in deionized water containing CTAB (0.03 moles) and made up to 100 cm3 to form a solution. NaOH (10 M) was then added to the solution while stirring to form a reddish brown precipitate and the pH was adjusted to between 11 and 12. The resulting mixture was poured into a polyethylene bottle, sealed and placed in an oven which had been preheated to 80 °C. The mixture was kept at this temperature for 24 h. The precipitate (now yellow) was washed several times with deionized water, filtered and dried in the oven at 100 °C for 2 h. The dried powder was then placed in a furnace and heated at 400 °C for 2 h. Two other separate portions were also annealed at 500 and 600 °C for 2 h each. Hematite prepared by this method will be referred to as Hem_PR followed by a number indicating the annealing temperature, that is, Hem_PR400, Hem_PR500 or Hem_PR600.
2.2.2. Sol-gel - Method 1
Citric acid (0.17 mol) was dissolved in deionized water (800 cm3), and Fe(NO3)3.9H2O (0.03 mol) was also dissolved in deionized water (200 cm3). The ferric nitrate solution was added dropwise to the citric acid solution while stirring vigorously to obtain a clear solution. The solution was then heated at about 90 °C on a hot plate with continuous stirring until a gel formed. The gel was dried in the oven at 100 °C for 24 h. The dry gel was then annealed in a furnace at 400 °C for 2 h and then crushed to obtain the powder. Two other separate portions were also calcined at 500 and 600 °C for 2 h each. Hematite prepared by this method will be referred to as Hem_SG followed by a number indicating the annealing temperature, that is, Hem_SG400, Hem_SG500 or Hem_SG600.
2.2.3. Sol-gel - Method 2
Tween 20 (200 cm3) was made up to 800 cm3 with deionized water; Fe(NO3)3.9H2O (0.03 mol) was also dissolved in deionized water (200 cm3) and subsequently added dropwise to the Tween 20 solution while vigorously stirring. The clear yellow solution was then heated (with stirring) at 90 °C on a hot plate to form a black gel. The gel was dried in an oven at 100 °C for 24 h and subsequently annealed in a furnace at 400 °C for 2 h and then crushed to obtain the powder. Two other separate portions were also annealed at 500 and 600 °C for 2 h each. Hematite prepared by this method will be referred to as Hem_TW followed by a number indicating the annealing temperature, that is, Hem_TW400, Hem_TW500 or Hem_TW600.
2.3. Characterization
High and low magnification images of the samples were collected with a JEOL-JEM 2100 LAB6 high resolution transmission electron microscope (HRTEM), with a lanthanum hexa-borite emission source and operated at an acceleration voltage of 200 V, and a transmission electron microscope (JEOL JEM-1010, Tokyo Japan), respectively. Each sample was dispersed in ethanol in a small centrifuge tube and sonicated before being dispersed on a carbon grid and the images collected. The crystalline phases of the synthesized products were determined by powder X-ray diffraction (PXRD) on a Bruker D8 Advance instrument with a Cu Ka radiation source (l = 1.5406 A). Diffrac-tograms were recorded between a 20 range of 15 and 90 ° and the results were analyzed with the DIFFRACTplus basic evaluation package (2007). The Scherrer equation, G = K//3cos0 (where Kis the Scherrer constant of 0.89, l is the wavelength of radiation and /3 is the full width at half maximum intensity), was used to calculate the grain size, G, of the particles. The attenuated total reflectance-Fourier transform infrared (ATR-FTIR) spectra of samples annealed at 400 °C were collected with a PerkinElmer Spectrum 100 instrument. Surface area analysis was performed on a Micromeritics Tristar II 3020 fully automated three-station surface area and porosity analyzer by using nitrogen at 77 K. The magnetic properties were determined with a LakeShore 735 vibrating sample magnetometer (VSM) which had been calibrated with a standard Ni sphere of saturation magnetization 54.7 emu g-1. The magnetization curves were obtained at a maximum magnetic field of 14 kOe at room temperature. The zero-field 57Fe Mössbauer spectra were obtained in transmission mode by a conventional spectrometer using a 25 mCi 57Co source sealed in a rhodium matrix and vibrated at constant acceleration. The spectrometer was calibrated with a natural α-iron foil and all measurements were made at room temperature. The spectra were then fitted with the aid of Recoil Mössbauer analysis software. Photocatalytic properties of the powders were screened in visible light by using a simple setup consisting of a 26 W fluorescent lamp (Osram Dulux D, 26 W, 1800 lm) held in a quartz glass jacket at about 7 cm above the rhodamine B (RhB) solution (100 cm3 in volume with an initial absorbance of approximately 0.8) containing 0.1 g of synthesized powder at room temperature, which was being stirred continuously by a magnetic stirrer. The mixture was allowed to equilibrate for 30 min in the dark before the lamp was turned on. Samples were taken from the solution at regular intervals, centrifuged and filtered through a 0.45 μm syringe filter. Absorbance measurements of these samples were recorded with a Biochrom Libra S6 UV spectro-photometer at a lmax of 556 nm to monitor the degradation process.
3. Results and Discussion
In this work hematite was synthesized by three different routes, namely: the goethite route in CTAB, the sol-gel route in citric acid, and the modified sol-gel route in Tween 20. The expectation was that the medium (i.e. citric acid or the CTAB and Tween 20 surfactants with their long hydrocarbon chains) would help in limiting the growth of the crystals and thereby effect a size control process on the crystals. It was also envisaged that some carbon atoms would be embedded into the skelecton of the materials, which would then result in pores once the carbon was burnt off.25,26 In this manner it was hoped to produce highly porous nanoparticles of hematite that would possess a large surface area and serve as a good photocatalyst.
3.1. Phase Purity and Crystallinity
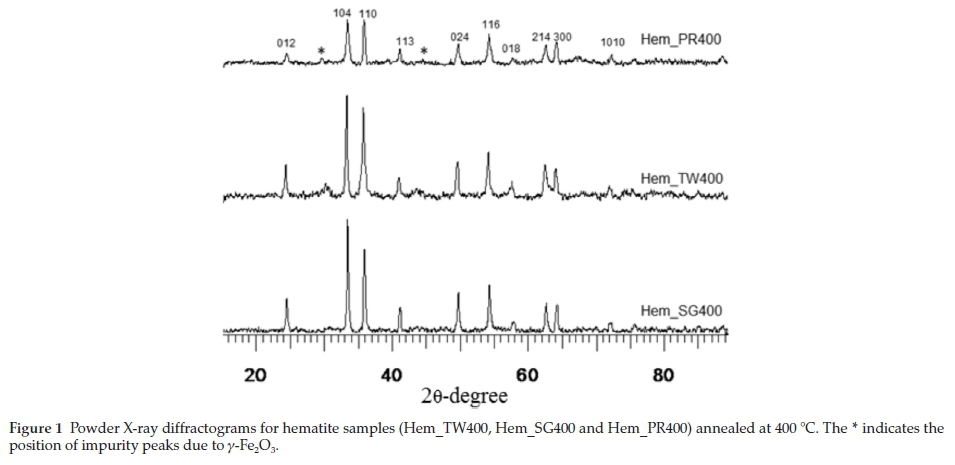
The powders all formed with a reddish brown colour. Hem_PR400 and Hem_SG400 appeared to be lighter in colour while Hem_TW400 was darker and finer. The X-ray diffracto-grams for the three samples annealed at 400 °C are shown in Fig. 1. The XRD patterns are similar and all display peaks typical for hematite which are in agreement with reported a-Fe2O3 peak positions (JCPDS No. 33-0664).27 Smaller peaks which occur at 20 values between 29.3 and 33.2 ° are due to phase impurities and can be seen in the diffractograms of Hem_PR400 and Hem_TW400. Likely phase impurities that could be generated alongside a-Fe2O3 are Fe3O4, g-Fe2O3 and oxyhydrites (i.e. a-, g-, or amorphous FeOOH).28-30 The peak at a 20 value of 29.32 ° corresponds to the position of the (220) peak for Fe3O4 and g-Fe2O3, which are both spinels. Also, the (110) a-Fe2O3 peak intensities for both Hem_PR400 and Hem_TW400 are abnormally high relative to their corresponding (104) planes. This could be attributed to the fact that the (110) a-Fe2O3 peak position corresponds to the spinel (311) peak for Fe3O4 and g-Fe2O3.31,32 This higher than expected intensity may be due to contributions from both sources thus confirming the presence of either Fe3O4 or g-Fe2O3 phases in both samples.28 The Hem_SG400 sample, however, shows normal a-Fe2O3 peak ratios. The peak intensities are generally low for all powders annealed at 400 °C. This indicates either poor crystallization or the presence of low amounts of the hematite lattice. XRD peaks for powders annealed at higher temperatures (500 and 600 °C), however, show a significant increase in peak intensity and adjustment of the peaks to normal a-Fe2O3 peak ratios (see Fig. 2). Thus, the crystallinity of the hematite lattice improves with an increase in annealing temperature. The spinel (220) peak (d = 29.00 ± 1 nm), however, is still visible for Hem_TW500 and even with increased intensity for Hem_PR500, but eventually disappears for Hem_TW600 and Hem_PR600 (Fig. 2). This is an indication that the spinel impurity responsible for this peak is g-Fe2O3, and not Fe3O4, since g-Fe2O3 is known to convert to a-Fe2O3 at temperatures greater than 400 °C.
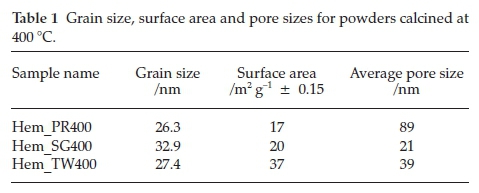
The values of the grain sizes for each of the powders synthesized were calculated from the Scherrer equation and are listed in Table 1. As can be seen the medium did effect size control of the particles as expected and the particle widths of all samples fall within the range of 26.3 to 32.9 nm.
3.2. Structural Characteristics
The expected IR absorption bands for hematite occur at around 540, 470 and 325 cm-1 and depending on the physical properties (i.e. size and morphology) of the crystals, the infrared bands can either move to higher or lower wavelengths.27,33-35
The ATR-FTIR spectra of samples annealed at 400 °C were collected with a PerkinElmer Spectrum 100 instrument which is capable of collecting signals between 380 and 4000 cm-1. Consequently, the band expected at 325 cm-1 is not observed here. Two major peaks, which occur in the region between 389 and 600 cm-1, are common to all three samples as can be seen in Fig. 3. In addition, the spectra for Hem_TW400 and Hem_PR400 also exhibit peaks between 640 and 1060 cm-1. These are the regions of interest for iron oxides/hydroxides; higher wavenumbers are mostly due to -OH stretching which could be as a result of adsorbed water molecules.34
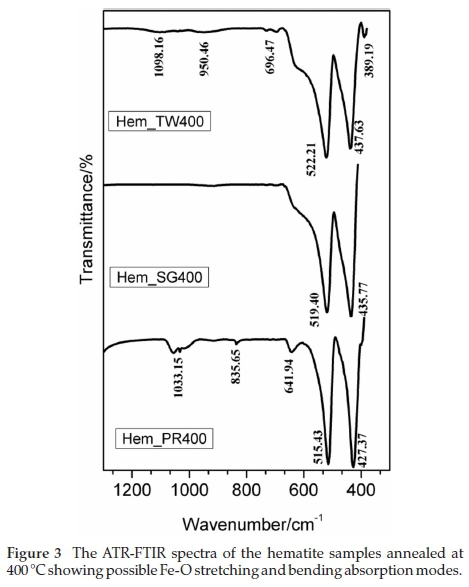
The two absorption bands that appear at approximately 520 and 430 cm-1 can be assigned to the hematite Fe-O stretching and O-Fe-O bending modes. The similar additional absorption bands observed between 640 and 1060 cm-1 in the spectra for Hem_PR400 and Hem_TW400 may well be due to the observation that both may contain small amounts of g-Fe2O3 impurity. Namduri and Nasrazadani34 observed the occurrence of g-Fe2O3 Fe-O absorption bands between 630-660 cm-1. Thus, the absorption peak observed at 641.94 cm-1 for Hem_PR400 may be as a result of the Fe-O stretching absorption for g-Fe2O3. However, this might be misleading since it could also be attributed to an out-of-plane bending mode for -OH.36
3.3. Morphology
The low magnification TEM images for powders annealed at 400 °C are presented in Fig. 4. The micrographs show nanorod clusters for the Hem_PR400 powder (Fig. 4a). These nanorods have average diameters of about 30±6nmandlengths of about 250 ± 50 nm. Fig. 4b is a HRTEM image for Hem_PR400 that shows its d spacing. Hem_SG400 and Hem_TW400, however, consist of nanoparticles of varying sizes ranging from below 10 nm to about 30 nm. The crystals for Hem_SG400 are more irregular in shape while those of Hem_TW400 showed a more regular spherical pattern. Average grain sizes calculated for both samples from the powder-XRD peaks by means of the Scherrer equation give mean values of 33 ± 11 nm for Hem_SG400 and 27 ± 9 nm for Hem_TW400. The TEM images, however, show a much smaller grain size especially for Hem_TW400. This could be an indication that there is a wide range in the distribution of grain sizes or due to formation of clusters (agglomeration) by the particles. The TEM result shows that Tween 20 was able to control the growth of the particles so that grain sizes well below 10 nm were obtained in clusters of about 26 nm in diameter. This is a noteworthy result since many solution-based syntheses of hematite typically produce much larger particle sizes.37,38 The inset in Fig. 4c shows the porous nature of the larger grains of Hem_SG400. Note the coalescence of tiny grains to form bigger grains in Hem_TW500 (Fig. 4g). The HRTEM images show the lattice fringes of the crystals. Grain sizes increase with increase in annealing temperature. This also means that more of the Fe ions are being incorporated into the hematite lattice at higher temperature in agreement with the XRD data.26,39
3.4. Surface Area and Porosity
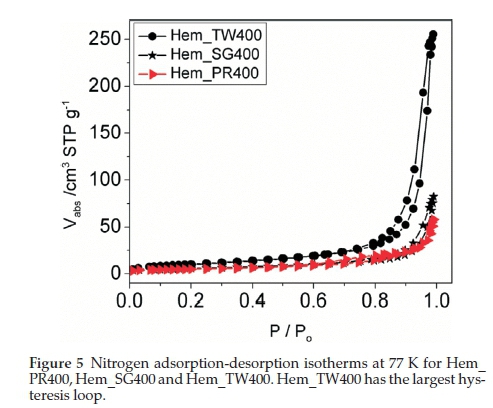
The surface areas and porosities of the hematite samples were determined from nitrogen adsorption/desorption isotherms at liquid nitrogen temperature (77 K). The specific surface area was calculated with the BET model and the pore size distribution by the BJH method. The N2 adsorption/desorption isotherms at 77 K (Fig. 5) for these materials conform to the type II isotherm as classified by IUPAC.40 The specific surface areas for Hem_PR400, Hem_SG400 and Hem_TW400 are 16.8, 20.3 and 37.2 m2 g-1, respectively (Table 1). The surface area was highest for the particles synthesized in Tween 20. A higher surface area would have been obtained but for the agglomeration of the crystallites. Again, this value is higher than those reported in most cases for sol-gel and some other solution-based synthetic routes and also for commercial a-Fe2O3.41 The hysteresis loops seen in the isotherms indicate that all samples contain porous particles with pore sizes ranging from meso- to macroporous. The BJH average pore sizes for Hem_PR400, Hem_SG400 and Hem_TW400 were 88.6, 20.7 and 38.9 nm, respectively. The average pore sizes for the three hematite samples are shown in Table 1. The pore sizes are distributed between meso-pores (between 2 and 50 nm pore diameter) and macro-pores (pore diameter above 50 nm). These pore sizes are quite large for these samples, considering the mean grain sizes calculated for each sample by using the Scherrer equation. The implication is that some of the pores are actually bigger than the grains on which they are supposed to be found. These pore sizes, therefore, are due to intraparticular spaces created between tiny particles within large clusters (agglomerated or aggregated)25 of particles (see Fig. 4c-h).
3.5. Magnetic Properties
Figure 6 shows the room temperature magnetization curves for all the samples annealed at 400 °C measured with a vibrating sample magnetometer in an applied field of 14 kOe. The magnetization curves for Hem_PR400 and Hem_TW400 show higher magnetization than is normally reported for pure hematite (normally below 1 emu g-1),42-44 which is normally due to the spin canting in a-Fe2O3 above its Morin temperature (TM), creating weak ferromagnetism (WF) in the sublattice.45,46Table 2 shows some magnetic parameters of the samples. The saturation magnetization MS values range between 1.53 to 19.99 emu g-1. Hem_TW400 shows superparamagnetic properties with a very low coercivity value HCof 10 Oe. HCvalues also increase as the crystal size G increases (see Table 2). The high MS value for Hem_TW400 is a confirmation of the PXRD results which show the presence of small amounts of g-Fe2O3 in the sample; small amounts of g-Fe2O3 in a-Fe2O3 powder can drastically increase the MS values.47,48 However, Hem_PR400 shows an MS value which is higher than that reported for hematite but not as high as for Hem_TW400. This can be attributed to the shape and/or the large size of its particles which are nanorods with dimensions as stated earlier (i.e. diameters of 30±6nmand lengths of 250 ± 50 nm). The magnetization curves for Hem_TW500 and Hem_TW600 are presented in Fig. 7. The magnetization curves are observed to reduce with increasing annealing temperature indicating that g-Fe2O3 converts to hematite at a temperature between 400 and 600 °C.27,49
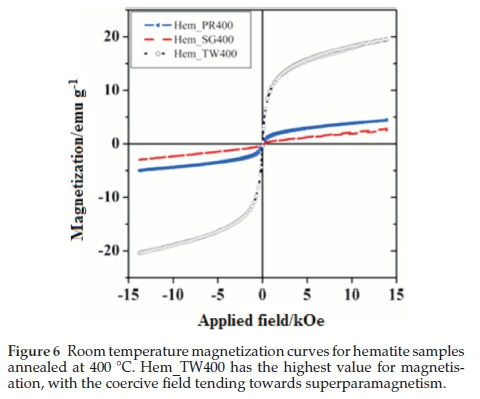
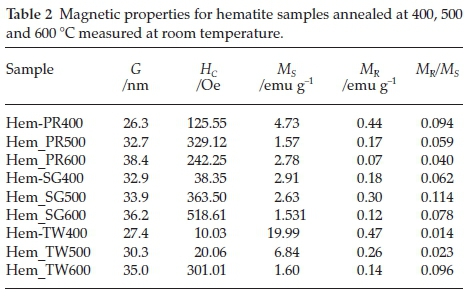
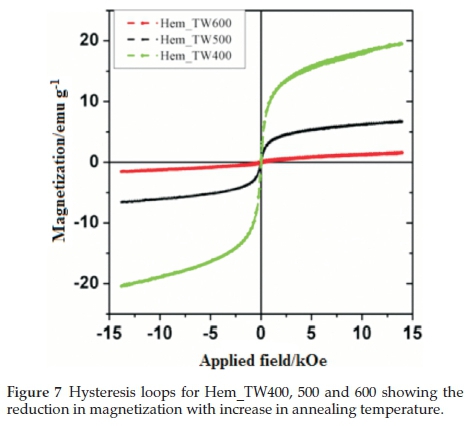
Figure 8a shows the relationship between annealing temperature and grain size. As expected, grain sizes increased with increase in annealing temperature. MR/MS (referred to as the squareness of the hysteresis loop) and coercivity values (HC) could be useful in describing the magnetic hardness/softness of magnetic materials; an increase in the values of these parameters would imply a tendency towards hardness and higher ferromagnetic properties.42 Coercivity values for the Hem_SG and Hem_TW powders increase with increase in grain size and with calcination temperature indicating an increase in hardness and ferromagnetic character. However, the MR/MS values are irregular and show different trends for different sets of samples (Fig. 8b). The trends in the MR/MSand coercivity values for Hem_PR powders could be due to the morphology and the large sizes of its particles, which are above the critical particle sizes reported for hematite.42,43
3.6. Mössbauer Spectroscopy Analysis
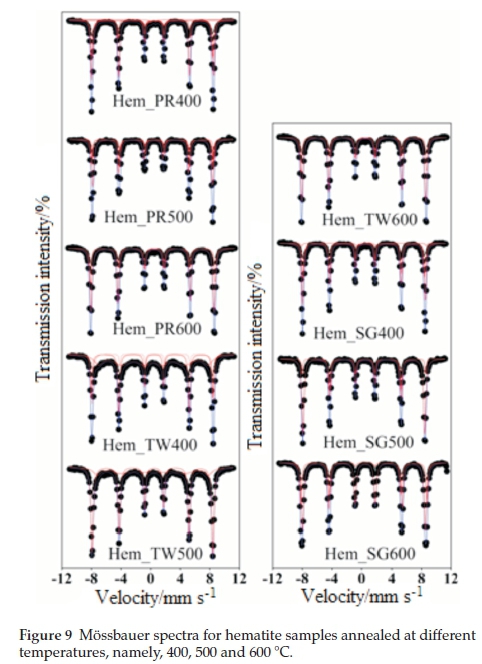
Figure 9 shows all fitted Mössbauer spectra for hematite samples annealed at 400, 500 and 600 °C. The results of the spectral fittings are shown in Table 3. The Mössbauerparameters obtained for samples annealed at 400 °C indicate that the samples, with the exception of Hem_SG400, do not contain pure hematite but ratherthey contain a mixture of hematite and some other iron oxide impurity. This impurity, as observed from the PXRD results, may either be Fe3O4 or g-Fe2O3 and, perhaps, a small amount of ferrihydrites. The distribution of cations in spinel Fe3O4 and g-Fe2O3 can be represented as follows Fe3+[Fe2+ Fe3+]O4 and Fe3+[aFe3+]O3, respectively, where □ represents a vacant octahedral (B-) site. This implies that Fe3O4 and g-Fe2O3 have two crystallographic sites designated A and B; the ions outside the brackets are on the A- or tetrahedral site while those within the brackets are on the B- or octahedral site. This implies that Mössbauer spectra for pure Fe3O4 can be fitted with two sextet subspectra with the octahedral site having twice the area of the tetrahedral site and thus its presence is easy to detect if it occurs as an impurity in a-Fe2O3. On the other hand, g-Fe2O3 is difficult to detect in a mixture with a-Fe2O3 because both sites are equivalent and therefore are not distinguishable from a-Fe2O3. Although some reports have shown that the isomer shift (d) and magnetic hyperfine field (Bhf) for g-Fe2O3 are lower than those for a-Fe2O3, the line between the two is very blurred and complementary PXRD data are required.50,29,51-52
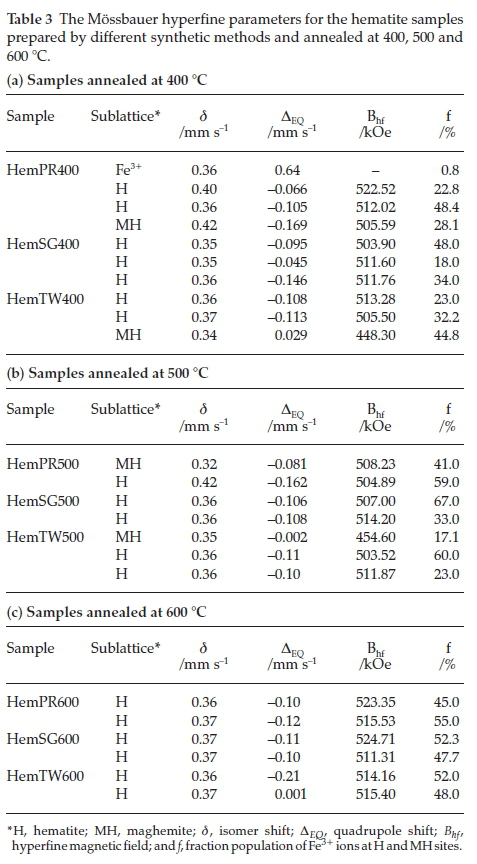
The Mössbauer spectrum for Hem_PR400 (Fig. 9) has been fitted with 4 subspectra, namely, 3 sextets and 1 doublet (Table 3a). The Bhfvalues for the three sextets fall within the range of Bhf values for a-Fe2O3 and g-Fe2O3 (450 to a little above 500 kOe). The δ values are a little higher than usual (0.404 and 0.421 mm s-1) for crystalline Fe3+. These higher δ values are as a result of defects in the crystal lattice of the crystallites which can be seen from Table 3 to fall back to values within the normal range with increased crystallinity (i.e. for the samples annealed at higher temperatures).53,54 The same applies to other subspectra with δ values of 0.4 mm s-1 and above. This explains the general increase in the intensity of the peaks as we go from lower to higher annealing temperatures for all the samples, which also results in higher Bhfvalues. This is in agreement with the PXRD results from which it was possible to show that the powders not only contained impurities but that the crystals are defective with crystallinity increasing for powders annealed at higher temperatures.
The presence of Fe3O4 was excluded in Hem_PR400 because the Bhf values displayed by all subspectra are much higher than the Bhf value for Fe3O4. Moreover, the colour of the sample, which is reddish, does seem to suggest the absence of Fe3O4 which is black in colour. The quadrupole doublet in the spectrum indicates a paramagnetic contribution (0.77 % paramagnetic properties) which might be due to the presence of a very small amount of surface ferrihydrite in the sample.30 The Mössbauer parameters (  and ΔEQ with values of 0.356 and 0.64 mm s-1, respectively) indicate that the doublet could be as a result of an Fe3+ located on the surface of the iron oxide core.55
Samples with two or more hematite subspectra are as a result of variation in the grain sizes of the nanoparticles with larger particles having a larger Bhf value.56,57 This is expected and it agrees with the results obtained from TEM which show that the powders contain various size ranges of nanoparticles.
The results obtained in this work show that both Hem_PR400 and Hem_TW400 contain a mixture of poorly crystalline a- and g-Fe2O3 with the well crystalline a-Fe2O3 phase favoured at higher annealing temperatures. The implication of this is that both a- and g-oxyhydroxides (FeOOH) may have been produced at the point of nucleation in the co-precipitation method, which then begins to convert to the corresponding Fe2O3 when it is annealed at 400 °C and ultimately changes into pure a-Fe2O3 which is the most stable iron oxide polymorph according to the following reactions.


Another scenario would be the formation of g-FeOOH alone at the point of nucleation which then converts to the corresponding g-Fe2O3 at temperatures above 300 oC. g-Fe2O3 is known to begin to convert to a-Fe2O3 at about 400 °C. However, the sol-gel methods would most likely have started from g-Fe2O3,ashas been reported, and slowly convert to a-Fe2O3 at higher annealing temperatures.58 The PXRD, VSM and Mössbauer spectros-copy results are all in agreement in this regard.
3.7. Photocatalytic Activities
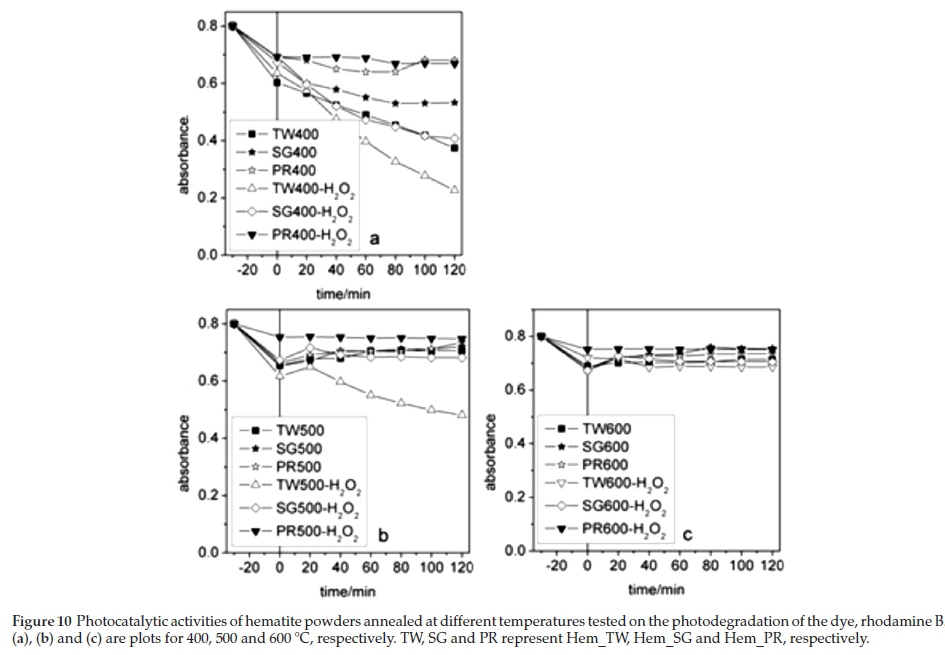
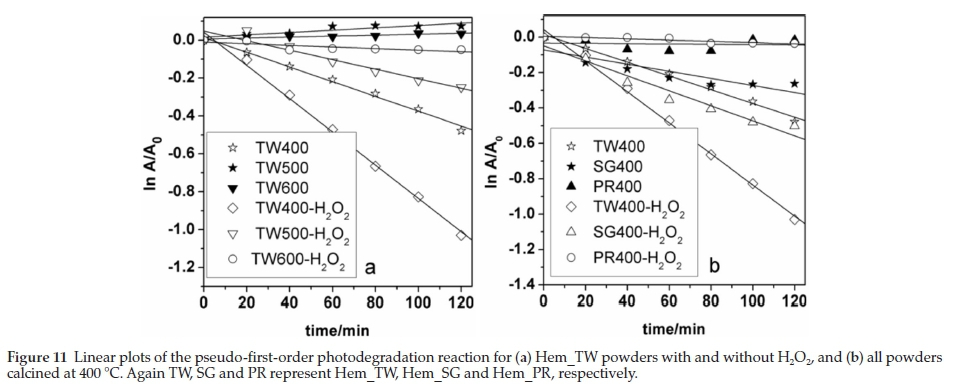
The photocatalytic activity of the hematite samples was investigated by monitoring the photodegradation of the dye, rhodamine B, under visible light illumination. Fig. 10 shows the photodegradation curves obtained. From -30 to 0 min represents the adsorption-desorption equilibrium before the samples were illuminated. All powders were able to adsorb between 10-20 % of the dye molecules thereby lowering the absorbance considerably from the initial value. Photodegradation began at 0 min and as can be seen from the plots only Hem_TW400 was able to appreciably degrade RhB dye both without and in the presence of H2O2. Powders annealed at higher temperatures, however, only mostly adsorbed the dye molecules and tended to desorb the dye rather than photodegrade it once the illumination began. The reduced photocatalytic rate (Fig. 11) could either be as a result of the increase in the particle grain size at higher annealing temperatures (Table 1), which might not favour a slower electron-hole recombination (this trend can also be noticed in samples calcined at 400 °C as the least active in this series is Hem_PR400 which has the largest average particle size as determined from the Scherrer equation) or as a result of the conversion of the g-Fe2O3 nanoparticles present in the powder to a-Fe2O3 as observed in the data obtained in sample characterization, or a combination of both reasons. The implication of the second suggestion would be that the a-Fe2O3/g-Fe2O3 composite has a better photocatalytic ability than pure a-Fe2O3. The high photocatalytic ability of the a-Fe2O3/g-Fe2O3 composite in visible light is as a result of the interaction of the lower conduction and valence bands (CB and VB) of g-Fe2O3 with the higher CB and VB of a-Fe2O3 which helps to reduce the probability of electron-hole recombination and increase the lifetime of the photogenerated species (e- and h+) that are responsible for the photodegradation process.56
3.7.1. Mechanism of Photodegradation
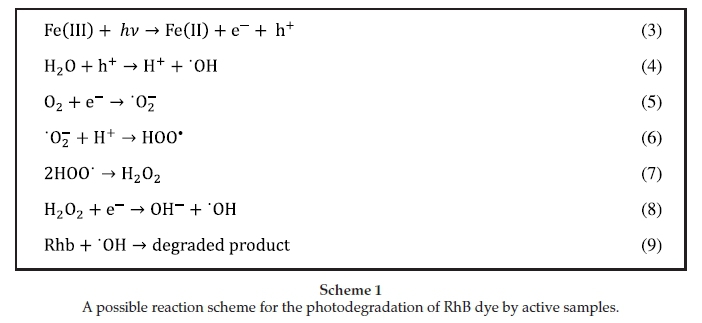
A possible mechanism for the photodegradation of RhB dye is shown in Scheme 1. As shown earlier, Hem_TW400 has particles with the smallest grain sizes (oftenbelow 10 nm). This is good for reducing the speed of the (e-, h) recombination.59-61 Consequently, there would be enough time for h+ to interact with H2O in the presence of light to generate 'OH (Eqn. 4) and for an e- to interact with dissolved oxygen to generate a superoxide ion (Eqn. 5).62 For the Hem_TW400-H2O2 system, however, more 'OH can be generated according to Equation 8 at the beginning of the reaction. These radicals then react with the dye and the photocatalytic degradation proceeds faster.63,64
4. Conclusions
Physical and magnetic properties of a-Fe2O3 nanoparticles depend on the method as well as the medium in which the nanoparticles are synthesized. The synthetic routes studied in this work produced a mixture of g- and a-Fe2O3 nanoparticles at an annealing temperature of 400 °C. Formation of pure crystalline a-Fe2O3 was favoured with increasing annealing temperature (500 and 600 °C). This was also accompanied by an increase in particle size. The PXRD, VSM and Mössbauer results are all concordant on the composition of the samples at each annealing temperature. a-Fe2O3 nanoparticles synthesized in Tween 20 have the smallest particle size and highest BET surface area, saturation magnetization and photocatalytic activity. This implies that the synthetic medium (Tween 20, a polysorbate surfactant), can be a very good additive to the precursor solution in a Pechini type sol-gel synthesis of a-Fe2O3 in order to effectively impact on the properties of the synthesized powders.
Acknowledgements
I.A. is grateful to the College of Agriculture, Engineering and Science at the University of KwaZulu-Natal for the award of a Ph.D. bursary and a Doctoral Scholarship. The authors thank Prof. VO Nyamori for his helpful suggestions to improve the manuscript and the National Research Foundation of South Africa (NRF) for research funding. The vibrating sample magnetometer used in this work was provided by the NRF.
§ORCID iDs
S.B. Jonnalagadda: orcid.org/0000-0001-6501-8875
B.S. Martincigh: orcid.org/0000-0003-1426-5328
References
1 D. Walter, Characterization of synthetic hydrous hematite pigments, Thermochim Acta, 2006,445, 195-199. [ Links ]
2 S.R. Prim, M.V Folgueras, M.A. De Lima and D. Hotza, Synthesis and characterization of hematite pigment obtained from a steel waste industry. J. Hazard. Mater., 2011,192, 1307-1313. [ Links ]
3 C. Wu, P Yin, X. Zhu, C. OuYang and Y. Xie, Synthesis of hematite (a-Fe2O3) nanorods: diameter-size and shape effects on their applications in magnetism, lithium ion battery, and gas sensors, J. Phys. Chem. B, 2006,110, 17806-17812. [ Links ]
4 X. Gou, G. Wang, J. Park, H. Liu and J. Yang, Monodisperse hematite porous nanospheres: synthesis, characterization, and applications for gas sensors, Nanotechnology, 2008,19, 125606-125612. [ Links ]
5 S.D. Tilley, M. Cornuz, K. Sivula and M. Grátzel, Light-induced water splitting with hematite: improved nanostructure and iridium oxide catalysis, Angew. Chem, 2010,122, 6549-6552. [ Links ]
6 F. Herrera, A. Lopez, G. Mascolo, P. Albers and J. Kiwi, Catalytic combustion of Orange II on hematite: surface species responsible for the dye degradation, Appl. Catal. B-Environ, 2001, 29, 147-162. [ Links ]
7 Y. Xu, G. Zhang, G. Du, Y. Sun and D. Gao, a-Fe2O3 nanostructures with different morphologies: additive-free synthesis, magnetic properties, and visible light photocatalytic properties, Mater. Lett., 2013, 92, 321-324. [ Links ]
8 P. Tartaj, M.P. Morales, T. Gonzalez-Carreño, S. Veintemillas-Verdaguer and C.J. Serna, The iron oxides strike back: from biomedi-cal applications to energy storage devices and photoelectrochemical water splitting, Adv. Mater., 2011, 23, 5243-5249. [ Links ]
9 S. Zeng, K. Tang, T. Li, Z. Liang, D. Wang, Y. Wang and W. Zhou, Hematite hollow spindles and microspheres: selective synthesis, growth mechanisms, and application in lithium ion battery and water treatment, J. Phys. Chem. C, 2007, 111, 10217-10225. [ Links ]
10 I. Thomann, B.A. Pinaud, Z. Chen, B.M. Clemens, T.F. Jaramillo and M.L. Brongersma, Plasmon enhanced solar-to-fuel energy conversion, Nano Letters, 2011,11, 3440-3446. [ Links ]
11 R. Ramesh, K. Ashok, G.M. Bhalero, S. Ponnusamy and C. Mutha-mizhchelvan, Synthesis and properties of a-Fe2O3 nanorods, Cryst. Res. Technol., 2010, 45, 965-968. [ Links ]
12 X. Gou, G. Wang, X. Kong, D. Wexler, J. Horvat, J. Yang and J. Park, Flutelike porous hematite nanorods and branched nanostructures: synthesis, characterisation and application for gas-sensing, Chem.- Eur. J., 2008, 14, 5996-6002. [ Links ]
13 T.P. Almeida, M. Fay, Y. Zhu and P.D. Brown, Process map for the hydrothermal synthesis of a-Fe2O3 nanorods, J. Phys. Chem. C, 2009, 113, 18689-18698. [ Links ]
14 Y. Zhu, J.C. Zhang, J. Zhai and L. Jiang, Preparation of super-hydrophilic a-Fe2O3 nanofibers with tunable magnetic properties, Thin Solid Films, 2006, 510, 271-274. [ Links ]
15 W. Zheng, Z. Li, H. Zhang, W. Wang, Y. Wang and C. Wang, Electro-spinning route for a-Fe2O3 ceramic nanofibers and their gas sensing properties, Mater. Res. Bull., 2009, 44, 1432-1436. [ Links ]
16 X. Wen, S. Wang, Y. Ding, Z.L. Wang and S. Yang, Controlled growth of large-area, uniform, vertically aligned arrays of a-Fe2O3 nanobelts and nanowires, J. Phys. Chem. B, 2004, 109, 215-220. [ Links ]
17 R. Wang, Y. Chen, Y. Fu, H. Zhang and C. Kisielowski, Bicrystalline hematite nanowires, J. Phys. Chem. B, 2005,109, 12245-12249. [ Links ]
18 S.-B. Wang, Y.-L. Min and S.-H. Yu, Synthesis and magnetic properties of uniform hematite nanocubes, J. Phys. Chem. C, 2007, 111, 3551-3554. [ Links ]
19 A.-H. Lu, E.L. Salabas and F. Schüth, Magnetic nanoparticles: synthesis, protection, functionalization, and application, Angew. Chem. Int. Edn., 2007, 46, 1222-1244. [ Links ]
20 L, Liu, H.-Z. Kou, W. Mo, H. Liu and Y. Wang, Surfactant-assisted synthesis of a-Fe2O3 nanotubes and nanorods with shape-dependent magnetic properties, J. Phys. Chem. B, 2006, 110, 15218-15223. [ Links ]
21 M.R. Housaindokht and A. Nakhaei Pour, Study the effect of HLB of surfactant on particle size distribution of hematite nanoparticles prepared via the reverse microemulsion, Solid State Sci., 2012, 14, 622-625. [ Links ]
22 I. Abdulkadir and A.B Aliyu, Some wet routes for synthesis of hematite nanostructures. African Journal of Pure Appl. Chem., 2013, 7, 114-121. [ Links ]
23 W. Wu, Z. Wu, T. Yu, C. Jiang and W-S. Kim, Recent progress on magnetic iron oxide nanoparticles: synthesis, surface functional strategies and biomedical applications. Sci. Technol. Adv. Mater., 2015, 16, 023501-023543. [ Links ]
24 A. Danks, S. Hall and Z. Schnepp, The evolution of 'sol -gel' chemistry as a technique for materials synthesis. Mater. Horizons, 2016, 3, 91-112. [ Links ]
25 K. Kaneko, Determination of pore size and pore size distribution: 1. Adsorbents and catalysts. J. Membr. Sci., 1994, 96, 59-89. [ Links ]
26 A. Feinle, M.S. Elsaesser and N. Huesing, Sol -gel synthesis of monolithic materials with hierarchical porosity. Chem. Soc. Rev., 2016, 45, 3377-3399 [ Links ]
27 E. Darezereshki, One-step synthesis of hematite (a-Fe2O3) nano-particles by direct thermal-decomposition of maghemite, Mater. Lett., 2011, 65, 642-645. [ Links ]
28 N.M. Deraz and A. Alarifi, Novel processing and magnetic properties of hematite/maghemite nano-particles, Ceram. Int., 2012, 38, 40494055. [ Links ]
29 J. Jacob and M. Abdul Khadar, VSM and Mössbauer study of nano-structured hematite, J. Magn. Magn. Mater., 2010, 322, 614-621. [ Links ]
30 M. Zic, M. Ristic, and S. Music, 57Fe Mössbauer, FT-IR and FE SEM investigation of the formation of hematite and goethite at high pH values, J. Mol. Struct., 2007, 834-836, 141-149. [ Links ]
31 J.P. Gaviría, A. Bohé, A. Pasquevich and D.M. Pasquevich, Hematite to magnetite reduction monitored by Mössbauer spectroscopy and X-ray diffraction, Physica B, 2007, 389, 198-201. [ Links ]
32 A.T. Goulart, M.F.J. Filho, J.D. Fabris and J.M.D. Coey, Multiple iron-rich spinel phases and hematite in a magnetic soil developing on tuffite, Phys. Chem. Miner., 1997, 25, 63-69. [ Links ]
33 W.R. Fischer and U. Schwertmann, The formation of hematite from amorphous iron(III) hydroxide, Clay. Clay Miner., 1975, 23, 33-34. [ Links ]
34 H. Namduri and S. Nasrazadani, Quantitative analysis of iron oxides using Fourier transform infrared spectrophotometry, Corr. Sci., 2008, 50, 2493-2497. [ Links ]
35 C.J. Serna, M. Ocana and J.E. Iglesias, Optical properties of a-Fe2O3 microcrystals in the infrared, J. Phys. C: Solid State Phys., 1987, 20, 473-484. [ Links ]
36 P.S.R. Prasad, K. Shiva Prasad, V Krishna Chaitanya, E.V.S.S.K. Babu, B. Sreedhar, and S. Ramana Murthy, In situ FTIR study on the dehydration of natural goethite, J. Asian Earth Sci., 2006, 27, 503-511. [ Links ]
37 A. Lassoued, B. Dkhil, A. Gadri and S. Ammar, Control of the shape and size of iron oxide (a-Fe2O3) nanoparticles synthesized through the chemical precipitation method, Results Phys, 2017, 7, 3007-3015. [ Links ]
38 R. Gobinath, R. Singh, S. Datta, S. Datta and S. Kumar, Characterization of iron nano particles (Fe2O3) synthesized through coprecipita-tion and sol-gel methods. Clay Res., 2015, 34, 59-65 [ Links ]
39 M.A. Bellakki, V. Manivannan and J. Das, Synthesis, structural and magnetic properties of La1-xCdxFeO3 (0.0 £ x £ 0.3) orthoferrites. Mater. Res. Bull., 2009, 44, 1522-1527. [ Links ]
40 K. Sing, D. Everett, R. Haul, L. Moscou, R. Pierotti, J. Rouquérol and T. Siemieniewska, Reporting physisorption data for gas/solid systems, Pure Appl. Chem, 1985, 57, 603-619. [ Links ]
41 S. Akbar, S.K. Hasanain, N. Azmat and M. Nadeem, Synthesis of Fe2O3 nanoparticles by new sol-gel method and their structural and magnetic characterizations, Condensed Matter, 2004, 480, 19 pp. [ Links ]
42 T.P. Raming, A.J.A. Winnubst, C.M. van Kats and A.P. Philipse, The synthesis and magnetic properties of nanosized hematite (a-Fe2O3) particles, J. Colloid Interf. Sci., 2002, 249, 346-350. [ Links ]
43 Q. Liu, V. Barrón, J. Torrent, H. Qin and Y. Yu, The magnetism of micro-sized hematite explained, Phys. Earth Pt. Interior., 2010, 183, 387-397. [ Links ]
44 J. Lian, X. Duan, J. Ma, P. Peng, T. Kim and W. Zheng, Hematite (a-Fe2O3) with various morphologies: ionic liquid-assisted synthesis, formation mechanism, and properties, ACS Nano, 2009,3,3749-3761. [ Links ]
45 Ö. Özdemir and D.J. Dunlop, Hysteresis and coercivity of hematite, J. Geophys. Res. Solid Earth, 2014, 119, 2582-2594. [ Links ]
46 Ö. Özdemir and D.J. Dunlop, Thermoremanent magnetization of multidomain hematite, J. Geophys. Res. Solid Earth, 2005, 110, B09104-B09111. [ Links ]
47 R. Ramesh, S. Sohila, C. Muthamizhchelvan, M. Rajalakshmi, S. Ramya and S. Ponnusamy, Synthesis and vibrational properties of hematite (a-Fe2O3) nanoparticles, J. Mater Sci: Mater Electron, 2011,22, 1357-1360. [ Links ]
48 G. Gnanaprakash, S. Ayyappan, T. Jayakumar, J. Philip and B. Raj, Magnetic nanoparticles with enhanced g-Fe2O3 to a-Fe2O3 phase transition temperature, Nanotechnol., 2006,17, 5851-5857. [ Links ]
49 Y. El Mendili, J.-F. Bardeau, N. Randrianantoandro, F. Grasset and J.-M. Greneche, Insights into the mechanism related to the phase transition from g-Fe2O3 to a-Fe2O3 nanoparticles induced by thermal treatment and laser irradiation, J. Phys. Chem. C, 2012, 116, 23785-23792. [ Links ]
50 N. Harshada, N.V. Kulkarni, S. Karmakar, B. Sahoo, I. Banerjee, P.S. Chaudhari, R. Pasricha, A.K. Das, S.V. Bhoraskar, S.K. Date and W. Keune, Mössbauer spectroscopic investigations of nanophase iron oxides synthesized by thermal plasma route, Mater. Charact., 2008,59, 1215-1220. [ Links ]
51 E. Schmidbauer and M. Keller, Magnetic hysteresis properties, Mössbauer spectra and structural data of spherical 250 nm particles of solid solutions Fe3O4-g-Fe2O3, J. Magn. Magn. Mater., 2006, 297, 107-117. [ Links ]
52 R. Zboril, M. Mashlan and D. Petridis, Iron(III) oxides from thermal processes - Synthesis, structural and magnetic properties, Möss-bauer spectroscopy characterization, and applications, Chem. Mater., 2002,14, 969-982. [ Links ]
53 P.G. Bercoff, H.R. Bertorello and M.I. Oliva, Memory effect of ball-milled and annealed nanosized hematite, Physica B, 2007, 398, 204207. [ Links ]
54 S.J. Stewart, R.A. Borzi, E.D. Cabanillas, G. Punte and R.C. Mercader, Effects of milling-induced disorder on the lattice parameters and magnetic properties of hematite, J. Magn. Magn. Mater., 2003, 260, 447-454. [ Links ]
55 S. Kamali-M, T. Ericsson and R. Wáppling, Characterization of iron oxide nanoparticles by Mössbauer spectroscopy, Thin Solid Film, 2006, 515, 721-723. [ Links ]
56 O.M. Lemine, M. Sajieddine, M. Bououdina, R. Msalam, S. Mufti and A. Alyamani, Rietveld analysis and Mössbauer spectroscopy studies of nanocrystalline hematite a-Fe2O3, J. Alloy. Compd., 2010, 502, 279-282. [ Links ]
57 N.H. Gangs, A. Simopoulos, A. Kostikas, N.J. Yassoglou and S. Filip-pakis, Mössbauer studies of small particles of iron oxides in soil, Clay. Clay Miner., 1973, 21,151-160. [ Links ]
58 J. Zhang, L.X. Rong, Y. Liu and B.Z. Dong, SAXS study on the microstructure of Fe2O3 nanocrystal, Mater. Sci. Eng. A, 2003, 351, 224-227. [ Links ]
59 Z. Zhang, C.-C. Wang, R. Zakaria and J.Y. Ying, Role of particle size in nanocrystalline TiO2-basedphotocatalysts,J. Phys. Chem. B, 1998,102, 10871-10878. [ Links ]
60 N. Xu, Z. Shi, Y. Fan, J. Dong, J. Shi and M.Z.C. Hu, Effects of particle size of TiO2 on photocatalytic degradation of methylene blue in aqueous suspensions, Ind. Eng. Chem. Res., 1999, 38, 373-379. [ Links ]
61 M. Anpo, T. Shima, S. Kodama and Y. Kubokawa, Photocatalytic hydrogenation of propyne with water on small-particle titania: size quantization effects and reaction intermediates, J. Phys. Chem., 1987, 91, 4305-4310. [ Links ]
63 V.A. Khomchenko, V.V. Shvartsman, P. Borisov, W. Kleemann, D.A. Kiselev, I.K. Bdikin, J.M. Vieira and A.L. Kholkin, Effect of Gd substitution on the crystal structure and multiferroic properties of BiFeO3, Acta Materialia, 2009, 57, 5137-5145. [ Links ]
63 B. Ohtani, Preparing articles on photocatalysis: beyond the illusions, misconceptions, and speculation, Chem. Lett., 2008, 37, 216-229. [ Links ]
64 G. Liu, S. Liao, D. Zhu, L. Liu, D. Cheng and H. Zhou, Photo-degradation of aniline by goethite doped with boron under ultraviolet and visible light irradiation, Mater. Res. Bull., 2011, 46, 1290-1295 [ Links ]
Received 24 August 2017
revised 10 May 2018
accepted 14 May 2018
* To whom correspondence should be addressed. E-mail: martinci@ukzn.ac.za

