


Services on Demand
Article
 English (pdf)
 Article in xml format
 Article references
Indicators

Related links
-
 Cited by Google
 -
 Similars in Google
Share

 Permalink
South African Journal of Chemistry
On-line version ISSN 1996-840X
Print version ISSN 0379-4350
S.Afr.j.chem. (Online) vol.70 Durban 2017
http://dx.doi.org/10.17159/0379-4350/2017/v70a26
RESEARCH ARTICLE
Electrical properties and enhancement of photocatalytic activity of TiO2 nanorods doped with SiO2
Mehran Riazian*
Department of Engineering, Tonekabon Branch, Islamic Azad University, Tonekabon, Iran
ABSTRACT
Fabrication and characteristics of silicon oxide-doped titania nanorods by use of the sol-gel method and alkaline treatment (corrosion process) in base reflux is presented. Nanostructural properties and electrical properties of titania-synthesized nanorods are specified by use of FE-SEM (field emission scanning electron microscopy), AFM (atomic force microscopy), TEM (transmission electron microscopy), XRD (X-ray diffraction), Ultraviolet-visible spectroscopy and FT-IR (Fourier transform infrared spectroscopy). The degradation rate of methylene blue (MB) under UV radiation is investigated as an amount of photocatalytic activity. Dependence between photocatalytic activity and calcination temperature (CT) is determined. Dielectric constant, capacity, quality factor and resistance are measured. Moreover, the presence of silicon oxide dopant and thermal treatment on phases of crystallites, nanoparticle surface aspects, dielectric constant, electrical resistance and lattice investigation are studied. The results indicate that the photodegradation rate of MB by pure titania nanorods decreases as the CT increases also, the photocatalytic activity of nanorods can be enhanced by doping with SiO2. Dielectric investigations reveal that dielectric constant and quality factor of pure nanorods can be improved by doping and increasing the CT.
Keywords: Photocatalytic activity, dielectric, titania nanorods, doping, silicon oxide.
1. Introduction
Numerous investigations and studies have been recently devoted to titania and its various applications such as water photosplitting, photodegradation, photovoltaic systems, etc.1-3 The photocatalytic performance depends on physical properties and specification of nanocrystallites, such as structure, dimension, size and surface properties (porosity, specific area, and topography).4,5 One-dimensional (1D) structures can increase the photocatalytic activity of titania nanomaterials by generating the instant splitting of photo-induced electrons and holes and prolonging the recombination process of conduction and valence band carriers (e-b ,h+b ).1,6 One applicable method to alter the property and characteristics of titania nanocrystallites is by doping it with semiconductor or metal to increase the UV-Vis. absorption of titania.7,8 Silicon oxide has been imported into the titania nanostructure to optimize the photocatalytic performance due to its appropriate thermal stability, superb mechanical properties, and special photocatalytic efficiency. In addition, it can enhance to make new catalytic sites because of the lattice and structure interaction between titania and silicon oxide,9 and to create a large surface and an appropriate porous structure.6 Due to their suitable high dielectric constant and resistance to alkaline solutions, silicon oxide-titania coatings and films are considerable for many researchers which have instigated their study as the gate dielectric materials for FETs (field effect transistors) and MOS (metal-oxide-semiconductor) with very small dimension.10,11 The impressive oxide thickness of silicon oxide dielectrics in MOSFETs (metal-oxide semiconductor field effect transistors) is nearly three monolayer (less than 1 nm) and concluded to the physical restriction and limit that cause more disturbance and leakage current in the gate of FETs. This leakage may be affected by penetrating of light ions such as Na+ and quantum tunnelling through the thin layers. These constraints cause to candidate an alternative gate dielectric. Materials with high dielectric constant (k), such as Al2O3, HFO212,La2O313 could be as an applicable buffer insulator. The resistivity against alkaline solutions is forcefully determined and controlled by their porosity and surface properties.14,15 Various techniques and methods have been innovated to synthesize and fabricate 1D nanostructures.16,17 In this research, the titania nanorods (pure and doped) are fabricated by the sol-gel method without using performed templates and catalysis to avoid any pollution.
2. Experimental Procedures and Details
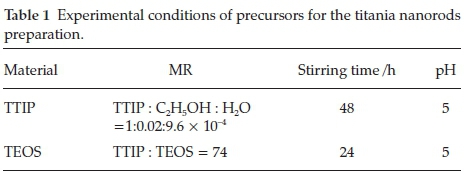
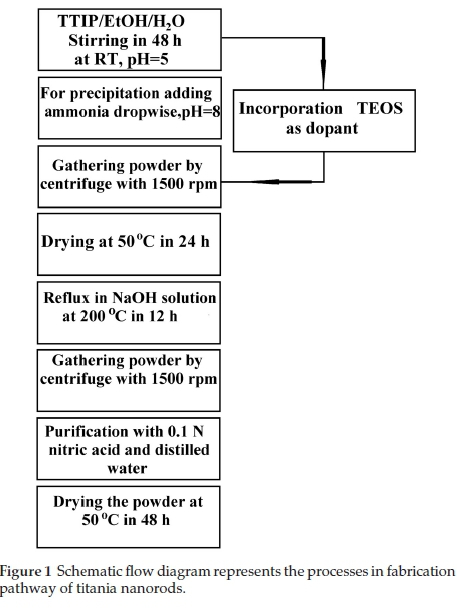
Experimental precursors, their molar ratio (MR) and chemical condition for perpetrating of titania nanorods are tabulated in Table 1. Besides, Fig. 1 shows the synthesis processes. The used precursors are: 0.1 N CH3COOH (Merck, >65 %), C2H5OH (Merck, > 97%), titania tetra-isopropoxide (TTIP) (Ti(OPri)4, Merck, > 98 %), tetraethoxysilane (TEOS) (Merck, >99 %), and pure distilled water are applied. The beginning point of the nanorod fabricationispreparingasolutioncorrespondingtothe specific molar ratio that is shown in Table 1. Lastly, the dried powders are calcined at three different temperatures of 300, 600 and 900 °C with a 10 °C min-1 gradient.
X-ray diffraction patterns are measured by XRD (model: GBC-MMA 007), X-ray diffractometer using Ka(Cu), 0.1540 nm 0.02 ° step size and 10 ° min-1 speed of radiation. TEM (CM10 Philips) is applied to study the nanostructure of the nanorods.
The FE-SEM, TEM, and AFM are carried using FE-SEM (model: S-4160 Hitachi), TEM (model: CM10 Philips) and AFM (model: Easy scan 2 Flex), respectively. Furrier transforms infrared spectroscopy measurements are recorded in KBr on an FT-IR (Perkin-Elmer 1600).
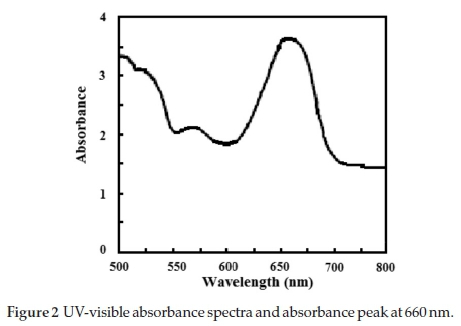
The photocatalyst degradation of MB is assigned as a measure to specify the photocatalytic activity of the titania nanorods doped with silicon oxide. The photocatalytic activity experiments are carried through at RT. The initial MB concentration was 100 mg L1. All experimental procedures to measure the photocatalytic activity are cited and presented in ref. 2. In all experiments, the temperature of photoreactor is fixed at 27 ± 1 °C by using a small ventilator. Reaction suspensions are prepared by adding 50 mg of pure and doped titania nanorods that calcined at three different CTs as a photocatalyst into 100 mL of MB aqueous solution. As seen in Fig. 2, the absorbance peak is around 665 nm (Imax).
3. Results and Discussion
3.1. X-ray Diffraction Analysis
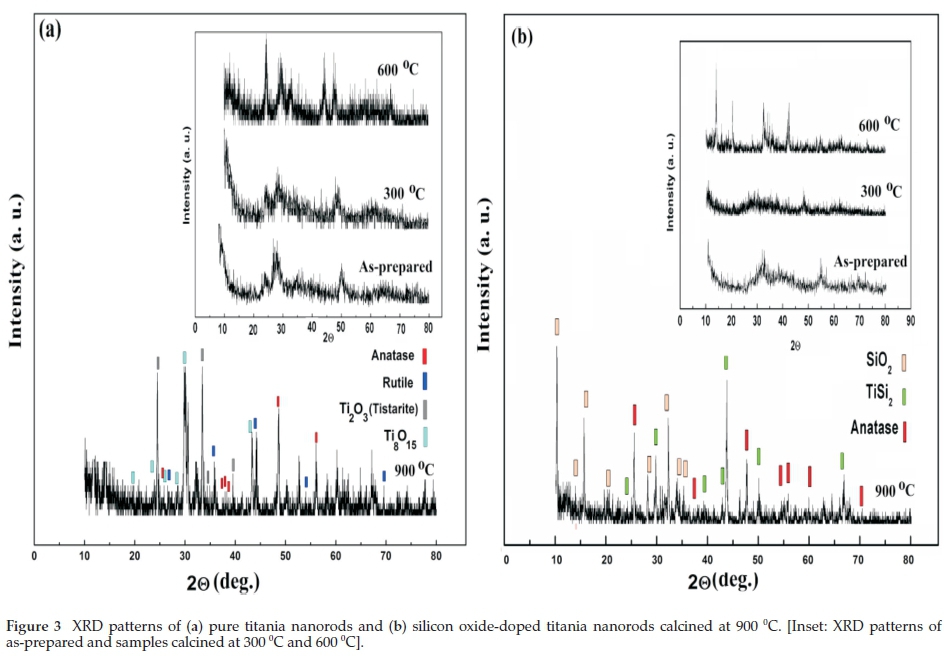
Crystalline phases have been investigated by XRD (Fig. 3). Crystalline phases and data of the XRD peaks are tabulated in Table 2. Amorphous structures are observed for the as-prepared and the 300 °C samples because of the short-range arrangement of lattice18 (Fig. 3), while the samples observed at 600 °C and 900 °C show a high degree of crystallinity. The peaks observed at 20 values of anatase (tetragonal, a = 0.3804 nm, c = 0.9614 nm), rutile (tetragonal, a = 0.4594 nm, c = 0.2959 nm), Ti2O3 (hexagonal, a = 0.5149 nm, c = 1.3642 nm), Ti8O15 (hexagonal, a = 4.844 nm, c =13.270 nm), TiSi2 (orthorhombic, a = 8.236 nm, b = 0.4773 nm, c = 0.2959 nm), and SiO2 (tetragonal, a = 1.02171 nm, c = 1.6396 nm) phases are match well with the powder diffraction standards (Crystal impact AMCSD). The average grain size (r) of the different crystalline phases has been estimated by the Scherrer's formula:

where λ = 0.1540 nm, β is the broadening at half maximum observed, 0 is the Bragg angle (angle of X-ray incidence) and k known as shape factor of grains is supposed to be 0.94. As seen in Table 2, the size of nanocrystallites increases by raising the CT due to the enlargement in the chemical bond length.
As seen in Table 2, the grain size of rutile crystalline raises from 31 nm to 145 nm by increasing the CT from 600 °C to 900 °C, while anatase crystallite size raises (from 45 nm to 60 nm). Phase transformation occurs because of surface energy, experimental conditions, and precursor chemistry. The prominent factor of the total energy of nanoparticle formation is the surface energy. The ana-tase phase has a lower surface energy than those of the rutile and brookite.19,20 Moreover, from the viewpoint of the molecular picture, the crystallite structure stability depends on nucleation and growth of various crystallite phases of titania that are affected by material chemistry and reaction conditions.21,22 Therefore, the rutile nanocrystallites show larger diameters by raising the CT.23 It has been presented the anatase nano-crystallites have higher stability at lower sizes. Aggregation-recrystallization process and coarsening procedure specify the particle growth kinetics under calcination conditions. These processes can influence and control the particle size and structure. Silicon oxide-dopant could affect the phase transformation via improving the thermal stability of anatase phase, in addition, inhibits the particle aggregation and rutile grain growth, and ultimately enhances the specific area of anatase crystalline phase. Dopants demonstrate stabilizing influence on anatase phase due to protection effect against agglomeration that acts as a protective casing of titania surface during calcination. The presence of silicon oxide-dopants in the titania lattice may raise the strain due to increase the lattice distortions, defects, and dislocations, which causes to retard the growth of rutile crystalline grains.
By increasing the CT from 600 °C to 900 °C, the grain sizes of Ti2O3 and Ti8O15 raises from about 13 and 12 nm to 24 nm, respectively. This event is associated with the crystallization and difference of grain growth of nanoparticles.24 Same as pure type, the nanocrystallites size raises by increasing CT in doped nanorods. The formation of silicon oxide crystallite is retarded to 600 °C in doped state.
Linear plots of ln D per 1/T (Figs. 4 and 5) are obtained according to Scott's equation25 by supposing the homogeneous growth of nanocrystallites during calcination represented:

where C is a constant of the equation, E is the activation energy, D is the nanocrystallite size, R is the gas constant, and T is the CT This energy E of pure titania nanorod phases is determined from the slope of the straight line as 5.78 kJ mol-1, 6.15 kJ mol-1, 5.41 kJ mol-1, 5.81 kJ mol-1 for anatase, rutile, Ti2Ü3, and Ti8O15, respectively. As shown in Fig. 5 in the doped state, E = 9.67 kJ mol-1 for anatase and 5.42 kJ mol-1 for TiSi2. The activation energy (E) of anatase of doped titania nanorod is more than of the pure titania nanorods. It shows that the presence of silicon oxide dopant has a remarkable effect on the growth of nanocrystallites such as anatase and rutile crystallites.
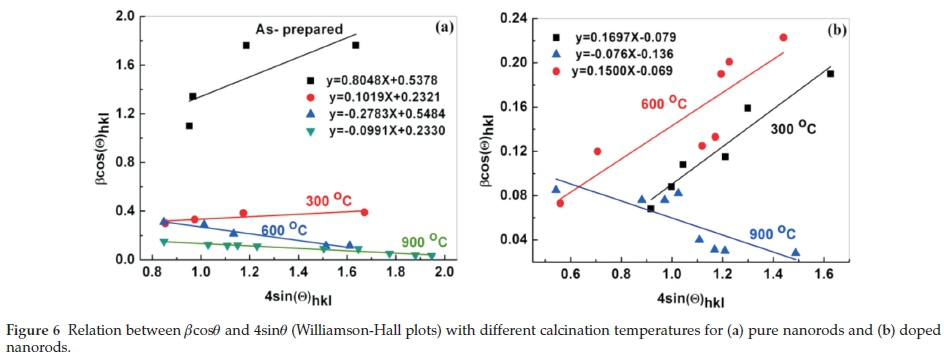
The two most important factors obtained from the full width at half maximum (FWHM) are the nanocrystallite size and the lattice strain. The crystalline dislocations, imperfections, lattice stresses, stacking faults, coherency stresses and grain boundary triple junction, may affect on lattice strain that is an amount of the modification of lattice strain.26 The Bragg peaks are affected by the lattice strain and the crystallite size, so that peak width, intensity, and 20 position could be modified accordingly. In addition, the peakbroadening obtained from the nanocrystallite size varies as 1/cos 0, whilst strain varies as tan 0. This distinction in relation as a function of 20 enables one to distinguish between the strain effects and the size on peakbroadening. The crystallite size has an inverse relation to the Bragg width.27 Hereby, in an integral breadth analysis (Williamson-Hall), the strain-induced and the size-induced derived from the relation between peak broadening and 20.28
Lattice strains (e) of nanocrystallites of titania nanorods are obtained from the relation between FWHMs and sin 0 on observed diffraction peaks in 20 ranging from 10°-80° corresponding to Williamson-Hall's formula24:
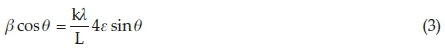
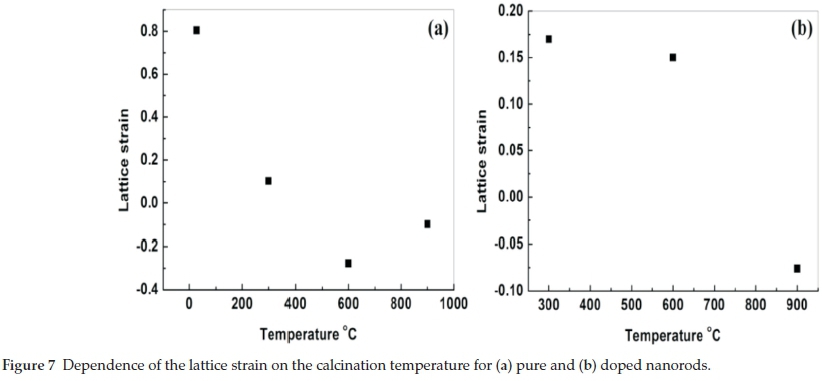
where ρ is the FWHM, e is lattice strain, shape factor k is 0.94 to Scherrer's shape factor and λ = 1.540 . Variation of bcos 0 against 4sin 0 for different samples is near to be linear. e is obtained from the slope of this linear dependence. Due to the low degree of crystallinity, there is not clear linearity between bcos 0 and 4sin 0.29 Variation of bcos 0 against 4sin 0 for diffraction peaks is shown in Fig. 6. In CTs ranging from room temperature (RT) to 600 °C, the scattering of experimental data is high due to weakness and broadness of Bragg peaks, so that it is not easy to calculate their FWHMs. In Fig. 7, e reduces by raising the CT. By raising the CT up to 600 °C in the pure nanorods, e reduces from 0.804 to 0.101 and by raising more than 600 °C to 900 °C, e varies from -0.278 to -0.099. In doped titania nanorods, by raising the CT from 300 °C to 900 °C, e reduces from 0.169 to -0.076 and the form of e changes from an external to an internal strain.
3.2. Transmission Electron Microscopy
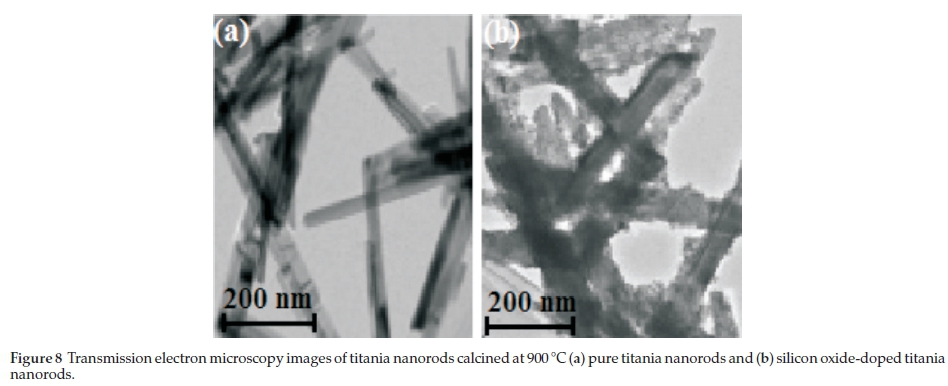
Figure 8 reveals TEM image of the pure and doped titania nanorods that calcined at 900 °C. Nanorods in the pure state show an average diameter and length of 47 nm and 395 nm, respectively. In the doped state, the nanorods have 60 nm average diameter and 460 nm average length. The doped nanorods have more thickness and length so that this increase in thickness and length is attributed to the presence of porous silicon oxide structure in titania nanorods.
3.3. Scanning Electron Microscopy
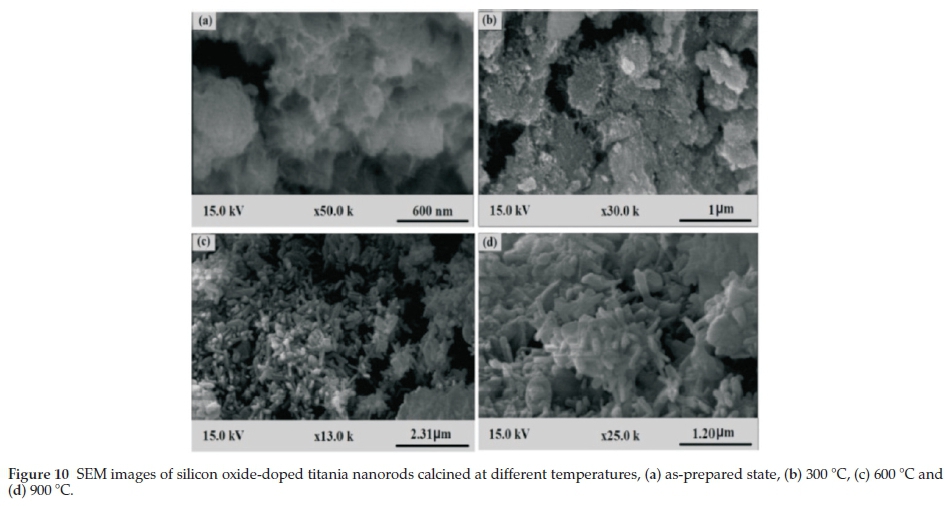
FE-SEM images are displayed in Figs. 9 and 10. The as-prepared particles have a spherical skein shape but envelop many rods. As shown, the nanoparticles are shaped in a narrow string figure. The nanoparticles with spherical coverage have a diameter about 550 nm exist only in the pure samples. This formation is because of the prohibitive influence of silicon oxide-dopants on crystallite growth of titania. Figures 9 and 10 reveal that the rods are created at high CTs. Figure 10 reveals FE-SEM images of silicon oxide-doped titania nanorods. It is seen that the particles in string-shape are formed in discrete regions in the as-prepared state, therefore form nanorods and are similar to each other by raising the CT.
Aggregation might result from the calcination conditions. Dopants modify the size, morphology, and shape in somehow that cause to enlarge the length and separate the nanorods. Dopants act as separate particles at the nanocrystallite inter-planar and curb the particle boundaries, also preventing surface diffusion and decreasing radius of the curvature of the nano-crystals.
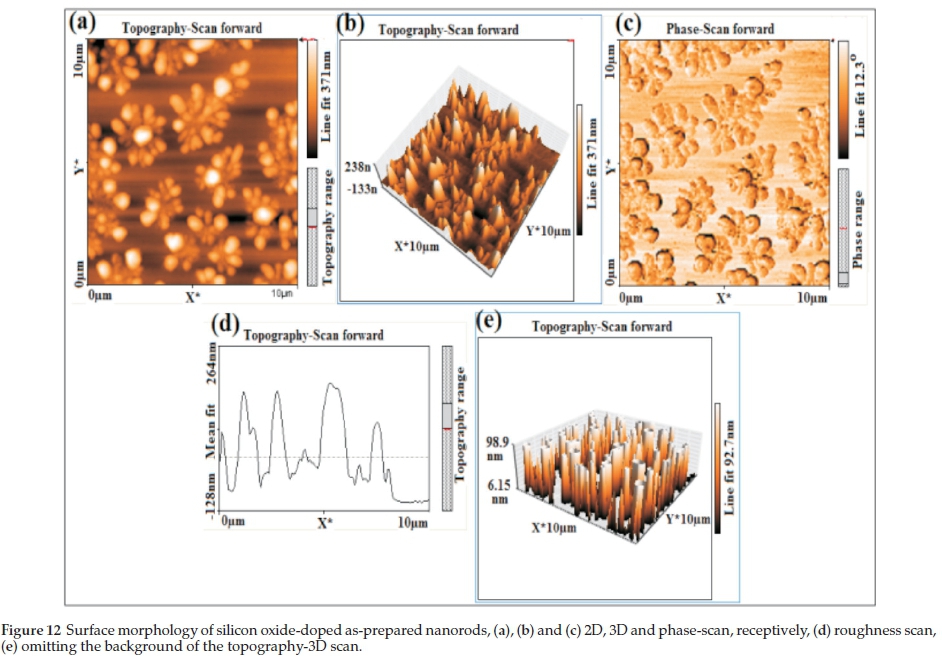
3.4. Atomic Force Microscopy
The morphologies of pure and silicon oxide-doped titania nanorods are revealed in Figs. 11 and 12. As seen, the discrete islands have a significant flower shape with the extent of 2 to 3.5 μιτι and 10 μm in the pure and doped state, respectively, whereas the islands are grown into an arm-like figure. The flower-like islands have a dendritic pattern in their arms. The arm-like shapes show about 6 μηι in width. Several factors could impress on the growth of the flower-like island in titania nanorods, such as diffusion of adatoms into the titania matrix, the formation of fractals, a larger fraction of deposited titania and dopants impinging onto the islands.3 Kinetic limitations and restrictions that result from thermal instability are responsible for the formation of dendritic arm-like figures.30 The AFM investigations are summarized in Table 3 by measuring the roughness parameters such the average roughness
the mean value
and the root-mean-square
in the 10 μm2 sections. It can be seen from Figs. 11 and 12 and Table 3 that the roughness parameter of silicon oxide-doped nanorods surface is smaller than that of pure titania nanorods, therefore doped nanorods have a smoother surface. Also, the maximum height (hmax) of the three-dimensional view of the pure titania nanorods structure is greater than that of the doped titania nanorods.
3.5. Photocatalytic Activity
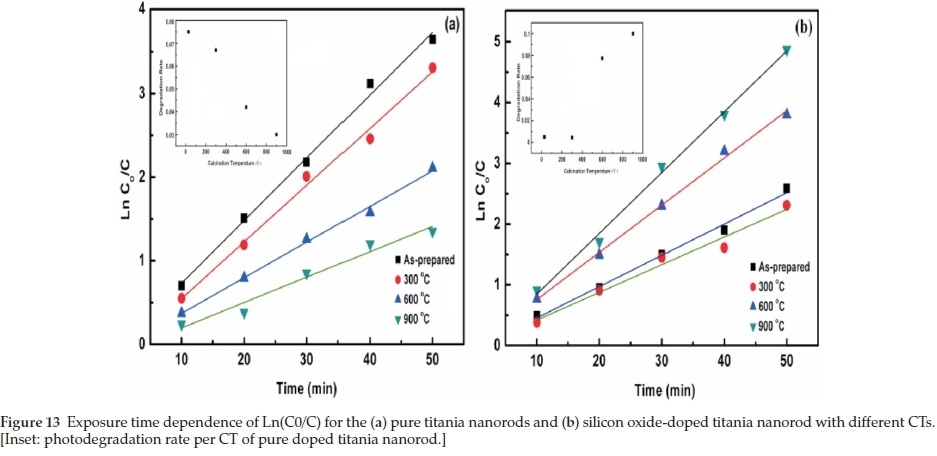
The comparative concentration of methylene blue in logarithmic scale  traced against UV-Vis exposure time according to samples that calcined at different temperatures. The slope of logarithmic plots is rate constant.7 The photocatalytic measurements in Table 4 reveal the relevant kinetic variables, such as CT, correlation coefficient (R2) and the degradation rate constant (k). All reactions reveal linear relation, as shown in Fig. 13.
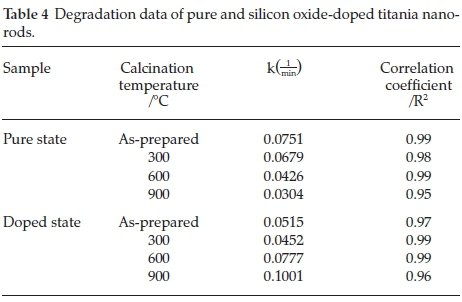
As shown in Fig. 13, rate constant, k is derived dependent on the presence of silicon oxide nanocrystallites in the titania nanorods and CT. In the pure state, the rate constant (k) reduces by raising the CT, due to increase in the particle size. In doped nanorods, the enhancement in photocatalytic efficiency has been imputed to improved thermal stability, the surface properties, and surface porosity. By reducing in particle size, the surface area as well as a number of active sites increases, in addition, the acceptor and donor carriers are adsorbed and participate in the reduction-oxidation reaction. Also, it is reasonable that doping titania nanorods by silicon-dopant is an effective method to increase the content of surface adsorbed water and hydroxyl groups as well as the photocatalytic performance, due to boundary of grains and the improved thermal stability of silica-mixed oxide, the phase transformation from anatase to rutile is inhibited.8,9
3.6. Dielectric Measurements
In order to determine the electric resistance (R), dielectric constant (k) and capacitance (C), samples are manufactured by a fine and flat tablet of pure and doped samples in different CTs. Circle silver electrodes by silver paste are coated and attached on the tablet sides. All electrical investigations are performed by digital LCR meter (GPS-132A Lutron, Korea) at a frequency of 120 KHz. The capacitance (C) is measured and dielectric constant (k) is calculated by using the following equation:
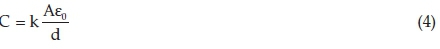
where C is the measured capacitance, (ε0= 8.85x10⁻¹² F.m-1)is the permittivity of free space, A  0.96 cm2) is the surface area of the capacitor and d (1.5 mm £ d< 1.8 mm) is the thickness of the dielectric, in that k, can be determined.
As shown in Table 5, electrical resistivity (R), capacitance (C), dielectric constant (k) and quality factor (QF) are determined for pure and doped titania nanorods. Higher QF indicates a less rate of the energy dissipation relative to the stored energy of the capacitor as follow:
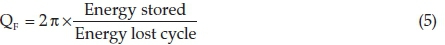
DF is a quantity used to determine dissipation rate of the energy capacitor and can alter depending on dopant, CT, structure, crystallite size, chemical properties and dielectric material. It is the opposite of QF as  . Obviously, the QF and capacitance increase by raising the CT.
As seen in Table 5, the electrical resistance of tablet samples reduces by raising the CT. This is because of increasing the arrangement, crystallite growth and reduction of lattice strain by increasing the CT. Increasing CT caused to rearrange and order the sites of atoms and nanocrystallites. In the doped state, the electrical resistance becomes more than pure states due to silicon oxide-dopant in titania nanorod matrix. By increasing the CT, dielectric constant and capacitance are increased. This increase can be demonstrated by reducing the lattice defects, lattice strain and increasing the number of electric bipolar with a preferable orientation with increasing CT. Conforming to Table 5, samples have a high-k dielectric and can be a candidate for a suitable gate dielectric in FET transistors. Accordingly, current density could be measured from Poole-Frenkel equation given by:
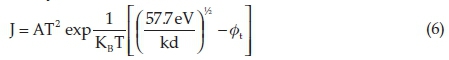
where K is the dielectric constant of the thin layer, KB is the Boltzmann constant, d is electrode spacing in Å, ft is the deep ness of the trap potential well and A is the Richardson constantassumed to be 129 = Tunneling current and leakage current decrease by increasing the dielectric constant.
3.7. Fourier Transforms Infrared Spectroscopy
Figure 14 reveals FT-IR investigation of nanopowders that calcined at different temperatures. The band at 3200 cm-1 has to be assigned to hydroxyl groups from water and ethanol, which are obturated in titania pore. The OH bending band of water is assigned at 1650 cm-1,1061 and below 1000 cm-1 is attributed to the Ti-O bond. The IR spectra show characteristic peaks of Ti-O-Ti (495^36 cm-1). The observed peaks at 1090 cm-1 and 1010 cm-1 demonstrates the Si-O-Si bond in the silicon oxide-doped nanorod. The Si-O-Ti linkage has an absorption peak at 925 cm-1. This bond shows the successful incorporation of silicon oxide-doped with titania. By raising the CT up to 900 °C, high-energy stretching band almost vanishes and 1650 cm-1 and 3200 cm-1 bending vibration band intensities decrease due to vaporization of the liquid. The band at 925 cm-1 in doped state increases by raising the CT and do not vary in the pure state. Results reveal that by raising the CT, position, and intensity of characteristic bonds at 495-436 cm-1, 1010 cm-1, 1090 cm-1 and 925 cm-1 do not change and at higher CT Ti-O-Si bond is not broken.
4. Conclusions
Experimental data indicate that synthesis of pure and silicon oxide-doped titania nanorods by the sol-gel route is a competent method for manufacturing photocatalytic and high dielectric material. The results show that phase transformation of titania depends on the CTs. The CTs and the addition of other oxides such as silicon oxide affected the nanostructural and lattice characteristics such as the size, strain, activation energy and electrical properties. Average nanocrystallite sizes increase by raising the CTs. The photodegradation rate of MB by pure titania nanorods decreases as the CT increases. Silicon oxide-doped nanorods show more photocatalytic activity than of the pure nanorods. The photodegradation rate of silicon oxide-doped titania nanorods in as-prepared samples and samples that calcined at 300 °C is approximately equal, but increases by raising the CT and formation silicon oxide crystallite phase. Dielectric constant and quality factor of pure and doped titania nanorods increase by raising the CT. The electrical resistivity of pure and doped titania nanorods reduces by raising the CT. The roughness of silicon oxide-doped titania nanorods is less than pure titania nanorods. The obtained results show that silicon oxide-doped titania nanorods have higher dielectric constant, higher photocatalytic activity, less leakage current, less roughness surface, less lattice strain and more thermal durability. Therefore, these nanorods have the potential to be a suitable candidate as a gate dielectric material for the future of FETs.
Author information
Corresponding author
E-mail: m.riazian@toniau.ac.ir
ORCID
M. Riazian: © orcid.org/0000-0003-4343-9016
Acknowledgement
The author thanks Islamic Azad University, Tonekabon Branch, for financial support throughout this research project.
References
1 X. Wu, S. Fang, Y. Zheng, J. Sun and K. Lv, Thiourea-Modified TiO2 Nanorods with Enhanced Photocatalytic Activity, Molecules, 2016,21, 181194. [ Links ]
2 M. Riazian, J. Nano Str., Dependence of photocatalytic activity of TiO2-SiO2 nanopowders,2014,4, 433-441. [ Links ]
3 M. Riazian, Synthesis of pure and aluminum oxide doped TiO2 nanorods and study of lattice strain and activation energy of crystalline phases, Indian. J. Chem, 2014, 53, 1377-1383. [ Links ]
4 S. Qiong and Xu. Yiming, Evaluating intrinsic photocatalytic activities of anatase and rutile TiO2 for organic degradation in Water, J. Phys. Chem. C., 2010,114, 18911-189158. [ Links ]
5 M. Gao, L. Zhu, W. L. Ong, J. Wang and G.W. Ho, Structural design of TiO2-based photocatalyst for H2 production and degradation applications, Catal. Sci. Tech., 2015, 5, 4703-4726. [ Links ]
6 M. Pal, U. Pal, J.M. Jimenez and F. Pérez-Rodríguez, Effects of crystallization and dopant concentration on the emission behavior of TiO2:Eu nanophosphors, Nanoscale Res. Lett., 2012, 7,1-12. [ Links ]
7 L.L. Si, Z.A. Huang, K.L. Lv, D.G. Tang and C.J. Yang, Facile preparation of Ti3+ self-doped TiO2 nanosheets with dominant {0 01} facets using zinc powder as reductant, J. Alloys Compd., 2014, 601, 88-93. [ Links ]
8 G. Liu, H.G. Yang, X.W. Wang, L. Cheng, J. Pan, G.Q. Lu and H.M. Cheng, Visible Light Responsive Nitrogen doped anatase TiO2 sheets with dominant {001} facets derived from TiN, J.Am. Chem. Soc.,2009, 131, 12868-12869. [ Links ]
9 C.C. Wang, K.W. Wang and T.P. Perng Electron field emission from Fe-doped TiO2nanotubes, Appl. Phys. Lett., 2010, 96, 143102-143110. [ Links ]
10 M. Riazian and A. Bahari, The growth of thin TiO2 film and nano size TiO2 powder, Int. J. Phy. Sci., 2011, 6, 3756-3767. [ Links ]
11 M. Wu, Y.I. Alivov and H. Moorkoc, High-k dielectrics and advanced channel concepts for Si MOSFET, Mater. Electron., 2008, 19, 915-951 [ Links ]
12 M. Zaharescu, VS. Teodorescu, M. Gratner and M. Anastasescu, Correlation between the method of preparation and the properties of the sol-gel HfO2 thin films, J. Non-Crystalline Solids, 2008, 354, 409-415. [ Links ]
13 P. Femina and P. Sinjay, LaCoO3 Perovskite catalysts for the environmental application of automotive CO oxidation, Res. J. Rec. Sci., 2012, 1, 178-184. [ Links ]
14 T. Kokubo and H. Takagi, Alkali-resistant Ba0-Ti02-Si02 glasses, Bull. Inst. Chem. Res., Kyoto Univ., 1981, 59, 224-233. [ Links ]
15 Q. Chen and G.H. Frischat, Sol-gel coatings of BaO-TiO2-SiO2 compositions, J. Sol-Gel Sci. Tech. 1994, 2, 535-538. [ Links ]
16 M. Yazdanbakhsh, H. Tavakkoli and S.M. Hosseini, Electrical and optical properties of nanosized Perovskite-type La0.5Ca0.5MO3 (M=Co,Ni) prepared using a sol-gel method, S.Afr.J. Chem., 2011,64, 71-78. [ Links ]
17 E.T. Mombeshoraa, R. Simoyia, V.O. Nyamoria and P.G. Ndungu, Multiwalled carbon nanotube-titania nanocomposites: understanding nano-structural parameters and functionality in dye-sensitized solar cells, S. Afr. J. Chem., 2015, 68, 153-164. [ Links ]
18 J. Qiu, F. Zhuge, X. Li, X. Gao, X. Gan, L. Li, B. Weng, Z. Shi and Y.H. Hwang, Coaxial multi-shelled TiO2 nanotube arrays for dye sensitized solar cells, J. Mater. Chem., 2012, 22, 3549-3554. [ Links ]
19 H. Zhang and J. Banfield, Thermodynamic analysis of phase stability of nanocrystalline titania, J. Mater. Chem., 1998, 8, 2073-2081. [ Links ]
20 H. Zhang and J. Banfield, Understanding Polymorphic Phase Trans formation behavior during growth of nanocrystalline aggregates: insights from TiO2, J. Phys. Chem. B., 2000,104, 3481-3487. [ Links ]
21 P.K. Naicker, P.T. Cummings, H. Zhang and J.F. Banfield, Characterization of titanium dioxide nanoparticles using molecular dynamics simulations, J. Phys. Chem. B., 2005,109, 15243-15252. [ Links ]
22 I.N. Khlomanov, E. Barborini, S. Vinati, P. Piseri, A. Podesta, C. Ducati, C. Lenardi and P. Milani, The influence of the precursor clusters on the structural and morphological evolution of nanostructured TiO2 under thermal annealing, Nanotechnology, 2003,14, 1168-1173. [ Links ]
23 K.R. Zhu, M.S. Zhang, J.M. Hong and Z. Yin, Size effect on phase transi- tion sequence of TiO2 nanocrystal, Mater. Sci. Eng. A., 2005,403, 87-93. [ Links ]
24 A.K. Zaka, W.H. Abd. Majida, M.E. Abrishamib and R. Yousefi, X-ray analysis of ZnO nanoparticles by Williamson-Hall and size-strain plot methods, Solid State Sci., 2011,13, 251-256 [ Links ]
25 M.G. Scott, Amorphous Metallic Alloys, Butterworth, London, 1983, p. 151. [ Links ]
26 J. Zhang, Y. Zhang, K.W. Xu and V. Ji, General compliance transformation relation and applications for anisotropic hexagonal metals, Solid State Commun, 2006,139, 87-91. [ Links ]
27 V.K. Pecharsky and P.Y. Zavalij, Fundamentals of Powder Diffraction and Structural Characterization of Materials, Springer, New York, 2003, p. 218. [ Links ]
28 C. Suranarayana and M.G. Norton, X-ray Diffraction: A Practical Approach, Plenum Press, New York, 1998, p. 65. [ Links ]
29 M. Inagaki, R. Nonaka, B. Tryba and A.W. Morawski, Dependence of photocatalytic activity of anatase powders on their crystallinity, Chemosphere, 2006, 64,437-445. [ Links ]
30 J. Ivanco, T. Haberb, J.R. Krenna, F.P. Netzera, R. Reselb and M.G. Ramseya, Sexithiophene films on ordered and disordered TiO2(110) surfaces: Electronic, structural and morphological properties, Surf. Sci , 2007, 601, 178-187. [ Links ]
Received 17 June 2017
Rrevised 20 November 2017
Accepted 24 November 2017
* E-mail: m.riazian@toniau.ac.ir

