


Services on Demand
Article
 English (pdf)
 Article in xml format
 Article references
Indicators

Related links
-
 Cited by Google
 -
 Similars in Google
Share

 Permalink
South African Journal of Chemistry
On-line version ISSN 1996-840X
Print version ISSN 0379-4350
S.Afr.j.chem. (Online) vol.70 Durban 2017
http://dx.doi.org/10.17159/0379-4350/2017/v70a24
RESEARCH ARTICLE
Physical chemical properties of Ce08Sm02IryCo1-yO3-ô (y = 0.03-0.04) and preliminary testing as cathode material for low-temperature SOFC
Chima B. NjokuI; Bernard OmondiI, *; Patrick G. NdunguII, *
ISchool of Chemistry and Physics, Westville Campus, University of KwaZulu-Natal, Private BagX54001, Durban, 4000, South Africa
IIDepartment of Applied Chemistry, Doornfontein Campus, University of Johannesburg, P.O. Box 17011, Doornfontein Johannesburg, 2028, South Africa
ABSTRACT
Sol-gel method was used to prepare Cea8Sma2IryCoj_yO3_ä (CSIC) (y = 0.03 and 0.04). All materials were characterized using powder X-ray powder diffraction (XRD), Raman spectroscopy, infrared (IR) spectroscopy, high resolution transmission electron microscopy (HRTEM) and scanning electron microscopy (SEM). The materials were then tested as cathodes in solid oxide fuel cell (SOFC). The XRD data showed distinct peaks for samarium-doped ceria and iridium oxide while Raman data confirmed the presence of perovskite and pyrochlore phases. Materials calcined at 1000 °C had the highest power density of 0.287 W cm-2 and 0.222 W cm-2 at 500 °C for the materials with y = 0.03 and 0.04, respectively, when tested in SOFC button cells.
Keywords: Solid oxide fuel cell, iridium oxide, samarium-doped ceria, oxides, sol-gel chemistry, Raman spectroscopy, X-ray diffraction, electrochemical properties.
1. Introduction
Solid oxide fuel cells (SOFC) are electrochemical devices that generate electricity and give off heat as by-product. SOFCs have attracted significant attention for several years, because of their high energy efficiency, excellent fuel flexibility, the growing global demand for non-polluting energy conversion systems, and a need for devices that can utilize renewable energy.1"1 However, SOFC systems, specifically those operating above 800 °C, also have some disadvantages which include longer start-up and cool down times, specialised and expensive balance of plant material, thermal management issues, and degradation of cell and stack components. Thus the reduction of SOFC operating temperature has become a key issue for the wide scale commercialization of these systems and an area of intensive research.5
The improvement in the activity of SOFCs that can operate in the temperature range of 300 to 600 °C has increased dramatically in the last few years; however, at lower temperatures the electrolyte conductivity and electrode kinetics decrease signifi-cantly.6-8 One way to overcome these drawbacks is to design and synthesize alternative cell materials based on cheaper precursors and using simpler methodologies.6,8,9 In fact, the development of good cathode materials for low-temperature SOFCs remains one of the main challenges in this area, as its sensitivity affect the performance of low-temperature SOFCs. The quest for low-temperature SOFCs has led to the use of a mixture of electro catalyst-electrolyte composites as cathode material. Jiang et al. reported that an anode supported fuel cell with a co-synthesized 70 wt.% Sm05Sr05CoO3 - 30 wt.% Sm02Ce08O19 (SSC-SDC73) composite cathode exhibited a peak power density of 924 mW cm-2 at 800 °C.10 Li et al. exploited the fabrication of a porous SDC/SSC composite cathode layer using environmentally friendly water-based ink. The results indicated that the cell with the inkjet printing cathode layer exhibited fantastic electrochemical performance, with a peak power density as high as 940 mW cm-2 at 750 °C.11 Wu et al. reported a minimum interfacial polarization resistance of 0.21 Ω cm2 and a power density of 0.24 W cm-2 at 700 °C for Sm05Sr05CoO3-d and BaCe08Sm02O3-d composites.12 Wang et al. reported a peak power density of 382 mWcm-2at500 °CforBa05Sr05Co08Fe02O3-d + Sm02Ce08O19(SDC) composites . 13Nie et al. also recorded an interfacial resistance of 0.44 Ω cm2 at 650 °C and a current density of 400 mA cm-2 at 750 °C forLa0.6Sr0.4C00.2Fe0.8O3-σ+ SDC.14"
In this study, we synthesized a novel composite cathode material from iridium and cobalt oxide with samarium-doped ceria (SDC) using a sol-gel method. Samarium-doped ceria tends to have promising oxygen ion conductivity and good electronic properties at low temperature.6,9,15-17 Our previous work demonstrated the excellent potential that iridium, cobalt, iron and SDC mixed phase materials have as low-temperature SOFC materials.18 In this work, the materials are iron free, and this is of interest since some reports in the literature have shown that cobalt, without the presence of iron, can improve the performance of mixed phase perovskite materials for low-temperature SOFC (LTSOFC) applications.19,20
2. Experimental Methods
2.1. Material Synthesis
Cobalt (II) acetylacetonate hydrate, (99 % purity), samarium (III) acetylacetonate hydrate (99.9 %), cerium (III) acetylacetonate hydrate, (99.9 % purity), and pluronic F-127 were purchased from Sigma-Aldrich (Pty) Ltd, South Africa. Iridium (III) acetylacetonate hydrate (98 % purity) was purchased from Alfa Aesar UK and these materials were used as received. The metal acacs were weighed out in various masses to make the different compositions. For they = 0.04 composition, 0.0500 giridium(III) acetylacetonate hydrate, 0.6481 g of cerium (III) acetylacetonate hydrate, 0.2286 g of samarium(III) acetylacetonate hydrate and 0.0394 g of Cobalt(II) acetylacetonate hydrate were used. For the y = 0.03 composition, the masses were 0.0379 g of Iridium(III) acetylacetonate hydrate, 0.6551 g of cerium(III) acetylacetonate hydrate, 0.2321 g of samarium(III) acetylacetonate hydrate and 0.0465 g of Cobalt(II) acetylacetonate hydrate. The various perovskite nanocomposite compositions were prepared by weighing out the metal salts and adding a mixture of 50 mL of ethanol and 15 mL of deionized water. The mixture was then placed in an ultrasound bath (UMC 20, 50 kHz) and sonicated for 30 min to dissolve all the solids. The mixture was then heated up to 80 °C on a hot plate and stirred at 180 rpm for 30 min, after which the solution was put in a convection oven for 18 h at 200 °C to dry completely. Samples were made in triplicate. Samples were then calcined in a muffle furnace (Kittec Squadro 1350) at a heating rate 2 °C min-1 and a final hold time, at the final temperature, of 10 h. The samples were calcined at 800 °C, 900 °C, and 1000 °C, respectively. The samples were allowed to cool to ambient conditions and then used for further analysis.
The electrolyte (SDC) was synthesized by weighing out 0.200 g of samarium (III) acetylacetonate and 0.534 g of cerium (III) acetylacetonate into 50 mL of ethanol and 15 mL of deionized water. The mixture was sonicated for 30 min in an ultrasound bath (UMC 20, 50 kHz), and then placed on a hotplate and heated up to 80 °C at 120 rpm for 20 min. The sample was then calcined at 850 °C for5hata heating rate of 2 °C min-1 in a muffle furnace (Kittec Squadro 1350). The SDC material formed was then hand mixed with sodium carbonate (Na2CO3) in the ratio of 60:40% before use.
2.2. Characterization
Characterization of the samples was done using powder XRD, high resolution transmission electron microscopy (HR-TEM), Raman spectroscopy and Fourier transform infrared spectros-copy (FTIR), scanning electron microscopy (SEM). The powder patterns were recorded using Brucker D8 Advance Bragg-Brentano X-ray diffractometer (Cu-a radiation, 1.5401510 A) operating at 40 kV and 35 mA. Data were collected between 20 and 100° (2Θ) at room temperature with a 2° step size and a minute acquisition per step. The instrument has a linear Vantec D detector with an active area of 50 by 16 mm, covering 13°(2Θ). The tube was fixed while the sample was rotated at Θ° min-1 and the detector at 2Θ° min-1 with a measurement geometry of 0.028° 2Θ at ~ 30° 2Θ. Mean crystallite sizes 'D' were determined according to the Scherer equation:

where λ = X-ray wavelength (1.5405 Å), β = full width at half maximum of the diffraction line, and Θ = diffraction angle.
For HRTEM small amounts of the samples were dispersed in ethanol and sonicated using an ultrasound bath, then drop-dried onto a carbon coated copper TEM grid, and examined using a JOEL 2100 HRTEM (200 kV accelerating voltage, beam current of 110 μΑ and a current density of 2.4 pA cm-2). For SEM analysis, small amounts of the powders were placed onto double-sided carbon tape that was firmly adhered to aluminium stubs and then the supported powder samples were coated with gold for SEM observations on a ZEISS FEGSEM Ultra Plus. For Raman analysis, the spectra were collected on a DeltaNu advantage 532TMTM Raman Spectrometer (100 mWNd:YAG laser with an excitation wavelength of 532 nm). FTIR analysis of the samples was done by using an ATR accessory in a Perkin Elmer 1200 FTIR.
2.3. Button Cell Fabrication
Anode powder consisting of 60 wt % NiO and 40 wt % SDC were mixed and pressed usinga 20 ton press and a 13 mm die kit. The electrolyte powder (SDC + Na2CO3) was then added on top of the anode disc, and then the cathode powder was placed on top of the electrolyte powder and finally the materials were pressed together using 15 ton pressure to form a tri-layer structure. Thus the button cell consisted of NiO-SDC|SDC + Na2CO3|Ce08Sm02IryCo1-yO3-d. The single cell had an active surface area of 1.342 cm2 and was then heated up to 500 °C for 2 h at a heating rate of 5 °C min-1 in air to densify the electrolyte. The sintering temperature was used because the addition of Na2CO3 to the electrolyte improves its densification at lower temperatures.21
2.4. Electrochemical Performance Test
The fabricated cells were mounted in an open flange test set-up from Fiaxell SOFC Technologies™ with platinum mesh as the current collector and distributor connected to the cells. The test-bed was placed on a Kittec Squadro muffle furnace and connected to a steady flow of air on the cathode and humidified hydrogen gas on the anode side. Current and voltage from the cells were measured with a Nuvant™ Powerstat potentiostat and galvanostat. The measurements were taken between the temperatures of 300 and 500 °C and the ionic conductivity was calculated using Equation 1,

where L = electrolyte thickness, S = electrode area of the electrolyte surface, R = resistance in ohms (cell resistance).
The activation energy and the electrical conductivity were calculated using the following Arrhenius relationship in Equation 2,22
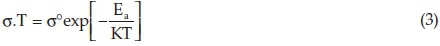
where Ea = activation energy of conduction, T = absolute temperature, σ°= pre-exponential factor, and K = Boltzmann constant.
The polarization curves were recorded between 300 and 500 °C and the potentiostatic durability testing was carried out in order to assess long-term static stability of the cell.
3. Results and Discussion
3.1. Powder X-ray Diffraction Analysis
Figure 1 shows representative XRD patterns of the perovskite nanoparticles (y = 0.03-0.04) composition, calcined at 800 °C, 900 °C and 1000 °C. The XRD pattern displayed characteristic peaks for SDC.22-24 The SDC phases were observed at 2Θ values of 28.44, 47.33, 56.19, 88.22 and 95.20 indexed to (111), (220), (311), (422) and (511), respectively, in addition to iridium oxide structure peaks were at 2Θ values of 34.71, 58.90, 69.22 and 77.03 and indexed to (101), (200), (301) and (310), respectively.
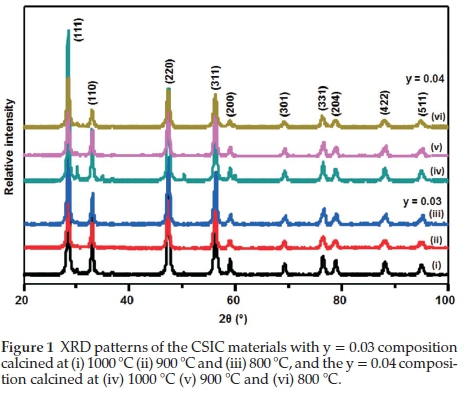
The average lattice parameter a = 3.4712 A for the calcined CSIC samples was calculated using Equation 4,22

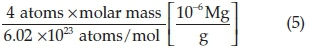
Where λ = wavelength of the instrument, Φ = 2Θ values/2 and he mass of the unit cell for all samples, was 1.601 x 10⁻²⁸ mg for y = 0.03 compositions and 1.690 x 10 28mgfory = 0.04 compositions calculated using Equation 5,
Mass of the unit cell (m) =
The volume of the unit cell was 3.184 x 10 30 m3 which was calculated from:

The volume density of the unit cell was 50.28 mg m 3 calculated from Equation 7,

The lattice parameter of the cathode material was different from the lattice parameter of CeO2 (JCPDS file No. 00-034-0394) which confirms the formation of a new compound.
The tolerance factor was also used to estimate the symmetry of the perovskite structure as shown in Equation 8,25
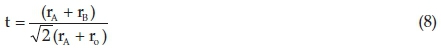
where r = ionic radii, and t = tolerance factor.
The ionic radii for this structure (Ce08Sm02IryCo1-yO3-d) are as follows:
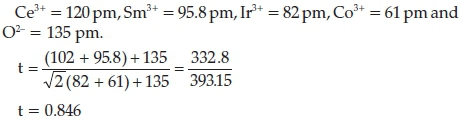
where 075 <t<0.9isan indication of an orthorhombic symmetry.
No separate cobalt oxide peaks were observed, and this could be due to the cobalt ion substituting into either the iridium oxide or the SDC phase. Previous work by Dreifus el al. has shown that Co2+ can substitute Ir4+ in the iridium oxide lattice,26 and Yao el al. reported on the formation of solid solution with cobalt and SDC.27
The crystallite sizes for the composites with y = 0.03 were calculated to be 21.80 nm, 20.41 nm and 18.45 nm for the samples calcined at 1000 °C, 900 °C and 800 °C, respectively. The composites with the y = 0.04 composition had crystallite sizes of 22.32 nm, 21.09 nm, and 14.92 nm for the samples calcined at 1000 °C, 900 °C and 800 °C. In general, the crystallite sizes increased as the calcination temperature was increased and is an expected result.
3.2. FTIR Analysis
Figure 2 shows the FTIR spectra of composites with (a) y = 0.03 and (b) y = 0.04 calcined at 800 °C, 900 °C and 1000 °C, respectively. The stretching vibrations observed in the spectra between 1000 and 1100 cm-1 were attributed to Ce-O-Ir or Sm-O-Co or Ce-O-Co (M-O-M) stretching vibrations. Samarium-doped ceria, after calcination, does not typically display any FTIR peaks within the region 1000-1100 cm-1.1
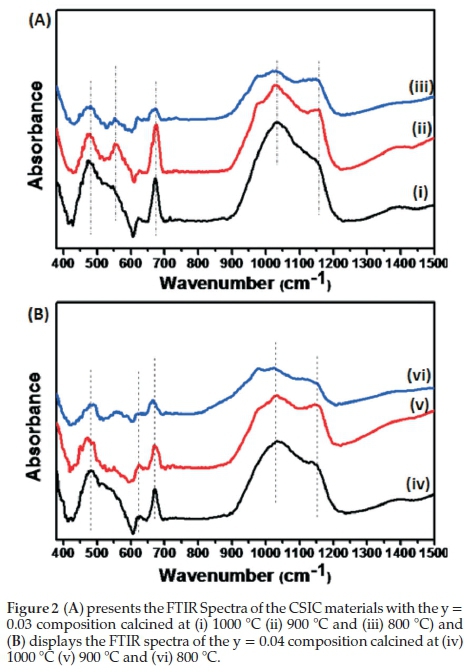
The absorption bands ~470-680 cm-1 indicate the presence of metal oxides, these bands are usually observed with perovskite structure containing materials with metals such as doped ceria.28-30 According to Waldron,31 the vibration of a unit cell of the cubic spinel can be constructed in the tetrahedral (A) sites and octahedral (B) sites. The absorption bands at 554 cm-1, 672 cm-1, 673 cm-1, 675 cm-1, 670 cm-1, 670 cm-1 and 666 cm-1 are therefore assigned to the vibrations of the tetrahedral metal-oxygen (M-O) bond and the absorption band at 472 cm-1, 474 cm-1, 478 cm-1, 480 cm-1, 482 cm-1 and 488 cm-1 are due to the metal-oxygen (M-O) vibrations in the octahedral sites. The change in band positions is expected because of the variation in the compositions of the materials and the difference in the M+-O2-distances in the tetrahedral and octahedral sites.
3.3. Raman Analysis
Figure 3 shows the Raman spectrum of the composite with y = 0.03 calcined at (a) 1000 °C (b) 900 °C and (c) 800 °C. Samarium-doped ceria has a main peak (F2g vibration mode) at 460 cm-1,2324 and the peak is present but shifted slightly at 800 °C (462 cm-1), 900 °C (459 cm-1), and 1000 °C (465 cm-1). The red shift is indicative of changes within the SDC fluorite structure; specifically, incorporation of Ce3+ cations and thus increase in oxygen vacancies and defects.32 Co3O4 A1g vibrational modes were observed at 686 cm-1 (800 °C), 691 cm-1 (900 °C), and 697 cm-1 (1000 °C). These shifts with the Co3O4 A1g mode are attributed to the different calcination temperatures. For the samples calcined at 800 °C, the minor peak at 314 cm-1 could indicate that some small amount of the iridium and samarium may have formed a pyrochlore phase,33 and the small peak at 818 cm-1 could be due to oxygen defects from the mixed phase metal oxides.34 The disappearance of the peak at 314 cm-1 at higher calcination temperatures and the slight increase in the intensity of the peaks at 831 cm-1 (900 °C) and 826 cm-1 (1000 °C) are a further indication that the minor pyrochlore phase has transitioned to a defect fluorite structure. Several authors have reported on pyrochlore to defective fluorite transitions.34,35
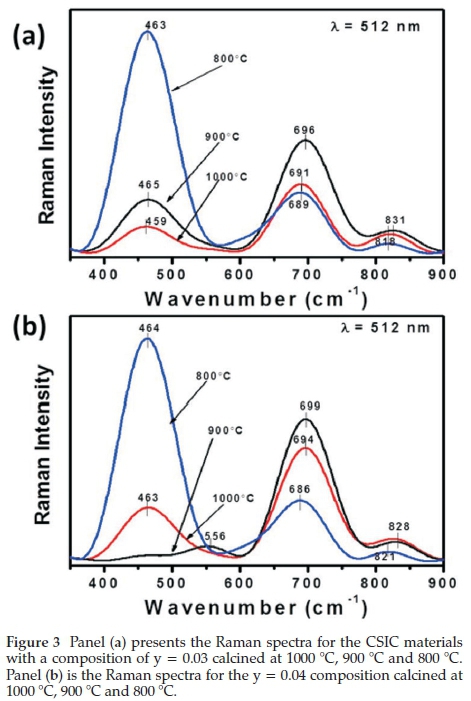
The material with the composition y = 0.04 (Fig. 3b) showed similar peaks to the y = 0.03 composition at all temperatures except the sample calcined at 900 °C, which showed an interesting transition. The F2g vibration mode around 460 cm-1 for samarium-doped ceria decreases substantially, and a new peak at 552 cm-1 is observed, which indicates the new peak is not a simple substitution of the Ce4+ for trivalent cations in the SDC fluorite structure, as was the case reported by Luo el al.23Instead, the appearance of the peaks at 552 and 831 cm-1 are indicative of pyrochlore phases due to the processing temperature and iridium content.
This result further supports the earlier discussions regarding the pyrochlore to a defect fluorite structure transition observed with the lower iridium content samples (y = 0.03). Finally, regarding the Raman spectra, a pure pyrochlore structure has six Raman-active modes; these are, A, ,E and 4T2 ,34,35 and Hasegawa el al. observed a weak T2g Raman peak for SmIr2O7 pyrochlore at 549 cm-1.33 The shift and increased intensity observed with the sample y = 0.04 calcined at 900 °C can be attributed to the presence of various other dopant ions35 and the complexity of the different phases present.
3.4. HRTEM Analysis
Figure 4 shows the HRTEM images for the various samples. The morphology for all the samples showed some differences in shape and sample contrast. Differences in contrast are indicative of changes in amorphous and crystalline regions within the sample and the differences seen with the HRTEM images as the samples are calcined from 800-1000 °C can be attributed to changes in the materials crystalline phases, which correlates with the phase changes noted and commented on in the Raman section.
For Fig. 4a the measured distance between the fringes shown in the inset was 0.147 nm indexed to (310) plane, for Fig. 4b the fringes in the inset were 0.110 nm indexed to (422) plane, and in Fig. 4c the distance between the fringes were 0.091 nm and indexed to (402) plane. The distance between the fringes shown in the inserts in Fig. 4d-f were measured and found to be 0.200 nm indexed to (220), 0.254 nm indexed to (002) and 0.257 nm indexed to (002) planes. These correlates with the XRD patterns presented and are identified as the SDC and IrO2 structures.
The selected area electron diffraction patterns are provided as a second inset within the HRTEM images and differ slightly in terms of the intensity of the rings and spots displaying a decrease in crystallinity as the calcination temperature decreases.
3.5. SEM Observations
The morphology of the materials synthesized are shown in Fig. 5, and show that the metal oxides accumulated to form agglomerates with differing pore sizes, and spaces between the various particles. The displayed morphology of the particles show a general trend where the samples with y = 0.03 composition displayed bigger pore spaces with the calcination temperature decreasing from 1000 in Fig. 5a - 800 °C in Fig. 5c. Whereas they = 0.04 composition showed a different trend with the smallest spaces between agglomerates observed with the sample calcined at 900 °C in Fig. 5e, and the largest spaces seen with the sample calcined at 1000 °C in Fig. 5d. This observation can be attributed to the change in the materials phases as per the Raman observations and discussion.
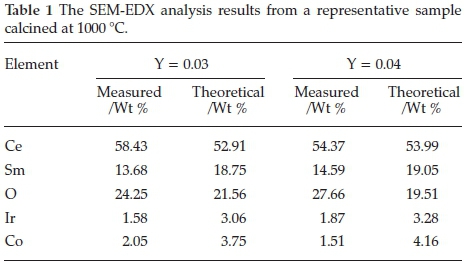
Energy-dispersive X-ray spectroscopy (EDX) analysis was done on the powders, Fig. 6a, identified the individual metals within the samples. The mapping showing a description of the individual element present in the sample as shown in Fig. 6b indicates a uniform distribution of the metals and did not show any obvious concentration of a particular metal within a specific area. The percentage compositions measured by EDX analysis are shown in Table 1.
3.6. Electrochemical Properties
The materials electrochemical properties were then tested by using the NiO-SDC as the anode SDC-NaCO3 as the electrolyte and CSIC as cathode in a SOFC button cell. The asymmetric cell was tested using a Kittec SQUADRO device. Compressed air with flow rate of 50 mL and humidified hydrogen with a flow rate of 200 mL was passed through the cell and the cell was tested for 14 h.
3.6.1. Polarization Curve
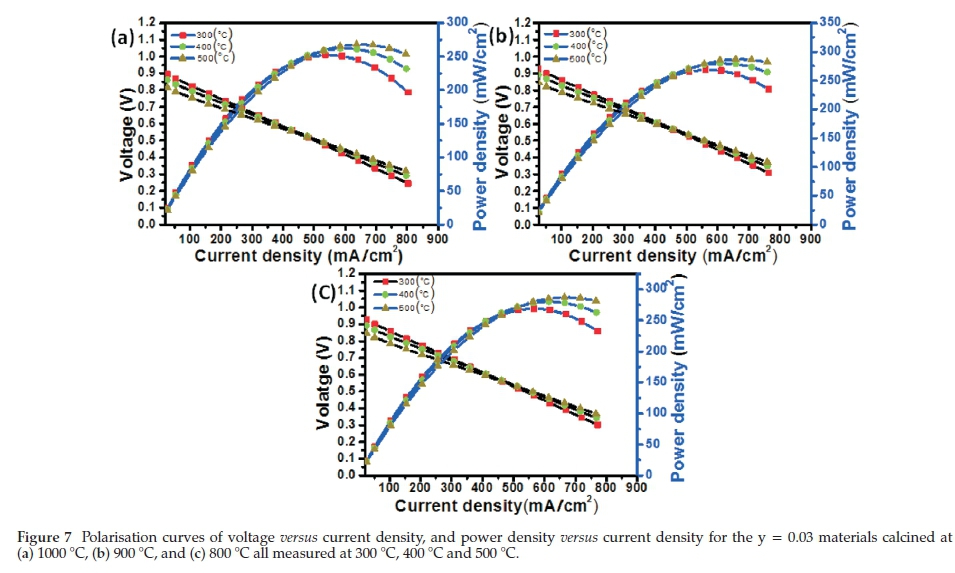
Recently, Hanna el al. reviewed in detail the current state of knowledge on the electrochemical characterizations and physical-chemical property relationships regarding SOFCs.4 One key aspect is polarization curves. Polarization curves provide crucial fundamental information on how a system deviates from ideal behaviour and the potential to utilize a material in a fuel cell. The polarization curves for the samples with y = 0.03 and y = 0.04 compositions calcined at 800-1000 °C are shown in Figs. 7 and 8, respectively. These were obtained in humidified hydrogen and compressed air at temperature intervals of 300, 400 and 500 °C. From Fig. 6 the values for the open circuit voltage (OCV) dropped, as expected, as the button cell was tested at 300, 400 and 500 °C, respectively. The lowest OCV value observed was 0.81 V with the sample calcined at 1000 °C and tested at 500 °C (Fig. 7, and the highest OCV value noted was 0.93 V with the sample calcined at 900 °C and tested at 300 °C (Fig. 8).
These values are below the theoretical Nernst potential, which can be attributed to either the non-optimal partial pressures of the gases on the electrodes,4 the presence of pinholes within the electrolyte or poorly formed electrolytes.11
The Polarization curves in Fig. 7 showed that the y = 0.03 compositions do not have any large differences in the gradients of the voltage-current density curves at the three temperatures; however, there are some differences at low current density, and since this the region of the polarization curve that is dominated by losses due to activation overpotentials,4 the differences are ascribed to the different temperatures. The maximum power densities for the y = 0.03 compositions were observed at 500 °C test temperature and the values were 268.2 mW cm-2, 287.3 mW cm-2, and 287.6 mW cm-2 for samples calcined at 1000, 900 and 800 °C, respectively. The samples did show relatively stable performance at 500 °C for 3600 min.
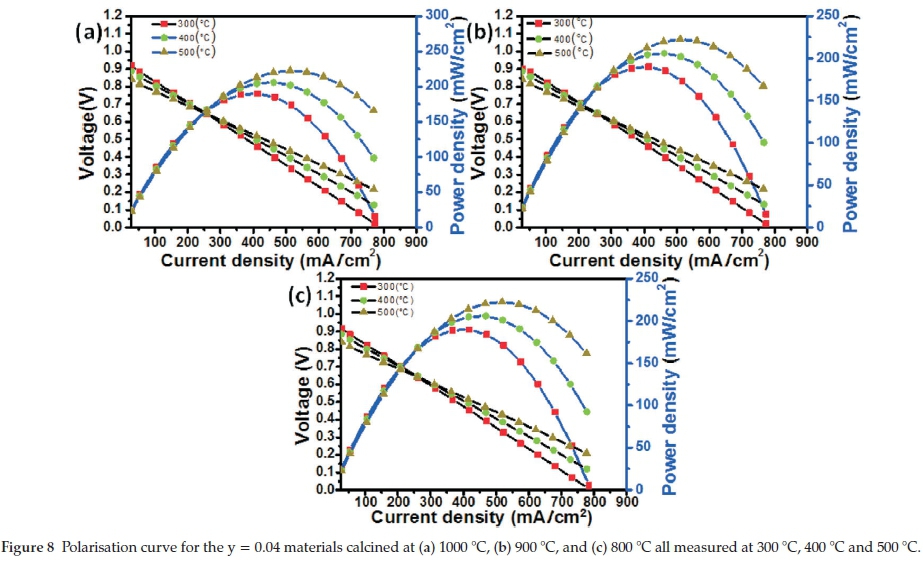
At low current densities, similar trends are seen with the composition y = 0.04 materials (Fig. 8). However, overall the samples with y = 0.04 have a larger gradient with the voltage- current density curves. The decrease in the central part of the polarization curve is usually ascribed to ohmic losses,4 and the two composition show some differences, with the y = 0.04 composition having larger differences with calcination temperature, when compared to the y = 0.03 composition. The decreased concentration of cobalt in the y = 0.04 composition clearly has a slight detrimental effect on the performance of the SOFC electrode material. This is further highlighted by the drop to zero voltage at 300 °C with the y = 0.04 composition (Fig. 8), and the non-zero value for the y = 0.03 materials. Furthermore, the observed power densities were lower for the y = 0.04 composition, with values of 222.8 mW cm-2, 222.5 mW cm-2, and 222.6 mW cm-2, for the samples calcined at 1000, 900, and 800 °C, respectively. Similar to the y = 0.03 composition, the samples with the y = 0.04 stoichiometry did show relatively stable performance for 3600 min. However, it should be noted that a greater amount of cobalt, and less iridium, within these SDC materials seems to decrease concentration polarization losses.
Liu el al. reported on micro-tubular SOFC systems with power densities of 50 mW cm-2 at 500 °C.17 Although our current materials are a bit of an improvement on what has been reported, they still showed a lower performance than our previous report of 400 mW cm-2 at 500 °C.18 Thus it would seem the removal of iron from the materials actually decreases performance.
3.6.2. Area-Specific Resistance
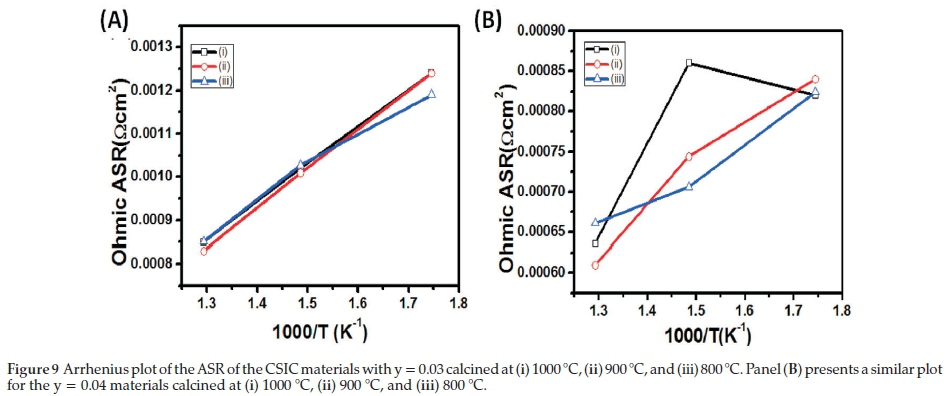
Figure 9 shows the normalized area-specific resistance (ASR) of the single cells for the composites with y = 0.03 and 0.04. For each composition, the ASR decreased with an increase in the SOFC test temperature. The area-specific resistance can be related to the material thickness and is a measure of the ionic and electronic conductivity.4 The ASRs are calculated from the slope of the substantial linear portion (in the centre) of the I-V curve, where the Ohmic resistance is dominant.4 The ASR is directly related to the design of the cell, anode, electrolyte and cathode properties and the assembly process used to make the single cell.4,11 The ASR values for the y = 0.03, Fig. 9A, showed some slight differences between 300 and 500 °C and this may imply the materials will have a similar operational profile in a fully functional SOFC system.
The ASR for the y = 0.04 composition (Fig. 9B) displayed some interesting variations. At the highest operating temperatures, 500 °C, the sample calcined at 900 °C had the lowest ASR values. This can be attributed to the mixed perovskite pyrochlore phase observed with the Raman analysis. At the mid operating temperature in this study, 400 °C, The mixed phase materials have the lower ASR, which are the materials with y = 0.04 calcined at 900 and 800 °C, respectively. It is only at the lowest temperature used to test SOFC viability did the sample calcined at 1000 °C have the lowest ASR. These observations suggest that the mixed phase materials may have better oxygen ion conductivity at 500 °C, and 400 °C, and merits further investigation.
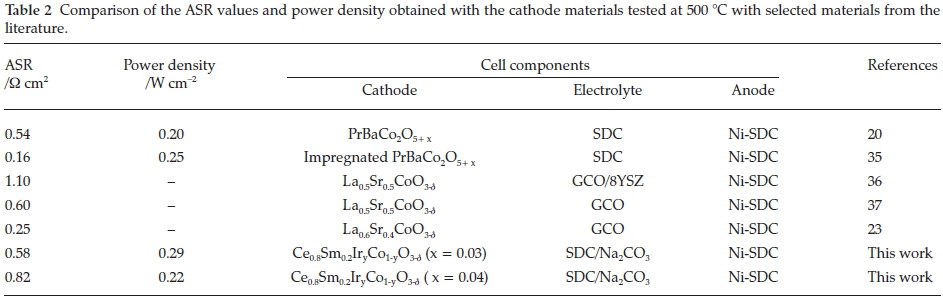
The ASR values obtained in this work are compared with selected examples from the literature, and the values are tabulated in Table 2. Using PrBaCo2O5+x materials, Wang el al.20 reported on slightly lower ASR and power density values than those in the current work, whereas Chen el al.36reported on a lower ASR, and a slightly lower power density when compared to the best cathode in this work. The lower ASR value in the work by Chen el al. can be ascribed to the impregnation technique used by the authors. Other examples with cobalt based cathode materials include work by Peters el al.,37Wang el al.,38and Hayd el al.19The higher ASR with the work of Peters el al. is most likely due to the GCO/8YSZ electrolyte used, and the much lower value with the work with Hayd el al. can be due to the optimized microstructure of the SOFC assembled in that body of work.
Table 1 shows the corresponding weight percentage analysis using SEM-EDX. This confirmed that the metals were present and the ratios were within reasonable and expected ranges, as seen by the small deviations.
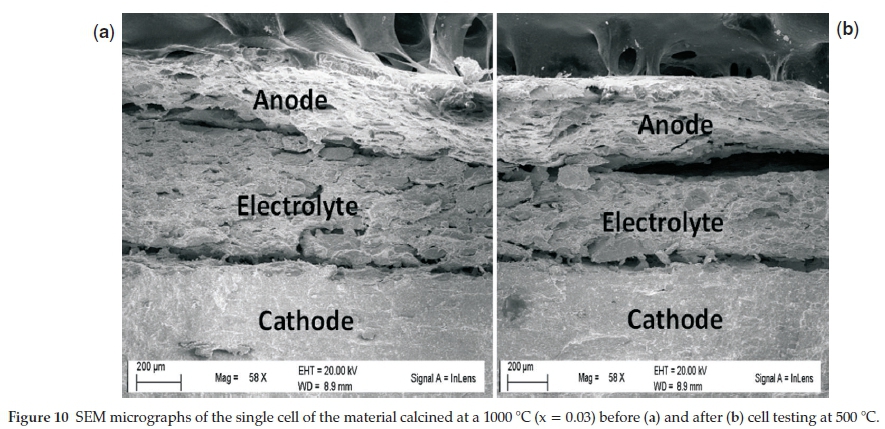
Figure 10 shows the SEM image of the button cell cross-section before and after testing. The electrolyte does show some porosity and this correlates with the low OCV values reported.
However, one interesting aspect is the simple button cell assembly used in this study produces comparable values, as shown in Table 2, and highlights that these cathode materials can be optimized further in the SOFC assembly process.
4. Conclusions
Sol-gel technique was successfully adapted to synthesize a samarium-doped ceria with iridium and cobalt oxides. The powder XRD patterns did not show any distinct cobalt oxide phases, but only samarium-doped ceria and iridium oxide. The Raman data revealed that these materials form complex oxide structures with perovskite, pyrochlore and defective fluorite phases. The initial electrochemical tests showed slight differences in the maximum power density for the different calcined samples. There were some small differences between the different compositions, with the sample with the y = 0.03 composition calcined at 800 °C having the highest power density of 287.6 mW cm-2 at 500 °C, and the sample with y = 0.04 calcined at 1000 °C having a maximum power density of 222.7 mW cm-2 at 500 °C. The materials merit further investigation and optimisation studies using plasma sintering, pore formers, thin electrolytes to improve the power density, and studies on their performance with hydrocarbon based fuels should be carried out.
Acknowledgements
The authors thank the University of KwaZulu-Natal, for an enabling environment, ESKOM-TESP and NRF South Africa (Thuthuka Grant No: 76318) for financial support.
References
1 A. Arabaci, Effect of Sm and Gd dopants on structural characteristics and ionic conductivity of ceria, Ceram. Int., 2015,41, 5836-5842. [ Links ]
2 J. Liu, Z. Zhao, Y. Chen, C. Xu, A. Duan and G. Jiang, Different valent ions-doped cerium oxides and their catalytic performances for soot oxidation, Catal. Today, 2011,175, 117-123. [ Links ]
3 S. Wolf, R. Adam, L. Fuhrmann, S.A. Ansar and K.A. Friedrich, Characterization of electrolyte layers of plasma-sprayed metal supported solid oxide fuel cells. Solid State Ionics, 2013, 243, 30-35. [ Links ]
4 J. Hanna, W.Y. Lee, Y. Shi and A.F. Ghoniem, Fundamentals of electro-and thermochemistry in the anode of solid-oxide fuel cells with hydrocarbon and syngas fuels, Prog. Energy Combust. Sci., 2014, 40, 74-111. [ Links ]
5 E.D. Wachsman and S.C. Singhal, Solid oxide fuel cell commercialization, research and challenges, Electrochem. Soc. Interface, 2009, 18, 38-43. [ Links ]
6 W. Tan, L. Fan, R. Raza, M. Ajmal Khan and B. Zhu, Studies of modified lithiated NiO cathode for low temperature solid oxide fuel cell with ceria-carbonate composite electrolyte, Int. J. Hydrogen Energy, 2013, 38, 370-376. [ Links ]
7 Y.B. Go and A.J. Jacobson, Solid solution precursors to gadolinia-doped ceria prepared via a low-temperature solution route, Chem. Mater, 2007,19, 4702-4709. [ Links ]
8 K.T. Lee and E.D. Wachsman, Role of nanostructures on SOFC performance at reduced temperatures, Mater. Res. Bull., 2014, 39, 783-791. [ Links ]
9 C. Veranitisagul, A. Kaewvilai, W. Wattanathana, N. Koonsaeng, E. Traversa and A. Laobuthee, Electrolyte materials for solid oxide fuel cells derived from metal complexes: gadolinia-doped ceria, Ceram. Int., 2012, 38, 2403-2409. [ Links ]
10 W. Jiang, B. Wei, Z.Lü, Z.H. Wang, X.B. Zhu and L. Zhu, Co-synthesis of Sm05Sr05CoO3-Sm02Ce08O19 composite cathode with enhanced electrochemical property for intermediate temperature SOFCs, Fuel Cells, 2014, 14, 966-972. [ Links ]
11 C. Li, H. Chen, H. Shi, M.O. Tade and Z. Shao, Green fabrication of composite cathode with attractive performance for solid oxide fuel cells through facile inkjet printing, J. Power Sources, 2015, 273, 465-471. [ Links ]
12 T. Wu, R. Peng and C. Xia, Sm05Sr05CoO3- <5-BaCe08Sm02O3-d composite cathodes for proton-conducting solid oxide fuel cells, Solid State Ionics, 2008,179, 1505-1508. [ Links ]
13 K. Wang, R. Ran, W. Zhou, H. Gu, Z. Shao and J. Ahn, Properties and performance of Ba05Sr05Co08Fe02O3-J +Sm02Ce08O19 composite cathode, J. Power Sources, 2008,179, 60-68. [ Links ]
14 L. Nie, M. Liu, Y. Zhang and M. Liu, La06Sr04Co02Fe08O3-J cathodes infiltrated with samarium-doped cerium oxide for solid oxide fuel cells, J. Power Sources, 2010, 195, 4704-4708. [ Links ]
15 V. Esposito and E. Traversa, Design of electroceramics for solid oxides fuel cell applications: playing with ceria, J. Am. Ceram. Soc., 2008, 91, 1037-1051. [ Links ]
16 N. Jaiswal, D. Kumar, O. Parkash and S. Upadhyay, Ca2+ and Sr2+ co-doped ceria/carbonates nanocomposites for low temperature solid oxide fuel cells: composite effect, Ceram. Int., 2015, 41, 15162-15169. [ Links ]
17 J. Xiao, W. Sun, Z. Tao, Z. Zhu and W. Liu, Fabrication and electrochemical characterization of anode-supported microtubular solid oxide fuel cells based on Ce08Sm02OM Electrolytes, Int. J. Appl. Ceram. Technol., 2012, 9, 1064-1070. [ Links ]
18 C.B. Njoku and P.G. Ndungu, Synthesis and characterization of novel Ce08Sm02Fe09Ir003Co007 O3-J perovskite material and possible application as a cathode for low-intermediate temperature SOFCs, Mater. Res. Bull., 2015, 68, 100-108. [ Links ]
19 J. Hayd, L. Dieterle, U. Guntow, D. Gerthsen and E. Ivers-Tiffée, Nanoscaled La06Sr04CoO3-J as intermediate temperature solid oxide fuel cell cathode: microstructure and electrochemical performance, J. Power Sources, 2011, 196, 7263-7270. [ Links ]
20 Y. Wang, H. Zhang, F. Chen and C. Xia, Electrochemical characteristics of nano-structured PrBaCo2O5+x cathodes fabricated with ion impregnation process, J. Power Sources, 2012, 203, 34-41. [ Links ]
21 L. Zhang, R. Lan, A. Kraft and S. Tao, A stable intermediate temperature fuel cell based on doped-ceria-carbonate composite electrolyte andperovskitecathode, Eleclrochem. Commun.,2011,13,582-585. [ Links ]
22 H. Okkay, M. Bayramoglu and M. Faruk Öksüzömer, Ce08Sm02O19 synthesis for solid oxide fuel cell electrolyte by ultrasound assisted co-precipitation method, Ultrason. Sonochem., 2013, 20, 978-983. [ Links ]
23 M. Guo, J. Lu, Y. Wu, Y. Wang and M. Luo, UV and visible raman studies of oxygen vacancies in rare-earth-doped ceria, Langmuir, 2011,27, 3872-3877. [ Links ]
24 L. Li, F. Chen, J.Q. Lu and M.F. Luo, Study of defect dites in Ce1-xMxO2-J (x = 0.2) solid solutions using raman spectroscopy, J. Phys. Chem. A, 2011,115, 7972-7977. [ Links ]
25 M. Johnsson and P. Lemmens, Crystallography and chemistry of perovskites, in Handbook of Magnetism and Advanced Magnetic Materials , Wiley Online Library, John Wiley & Sons, 2007. [ Links ]
26 D. Von Dreifus, A.J.A. de Oliveira, A.V. do Rosario and E.C. Pereira, Magnetic and structural characterization of IrO2 and Co: IrO2 samples synthesized via Pechini method, J. Supercond. Nov. Magn., 2013, 26, 2319-2321. [ Links ]
27 H.C. Yao, X.L. Zhao, X. Chen, J.C. Wang, Q.Q. Ge, J.S. Wang and Z.J. Li, Processing and characterization of CoO and Sm2O3 codoped ceria solid solution electrolyte, J. Power Sources, 2012, 205, 180-187. [ Links ]
28 A. Arabaci and Ö. Serin, Characterization of Sm-doped ceria ceramics synthesized by two different methods, J. Mater. Eng. Perform., 2015, 24, 2730-2737. [ Links ]
29 Y. Tao, J. Shao, J. Wang and W.G. Wang, Morphology control of Ce0.9Gd0.1O1.95 nanopowder synthesized by sol-gel method using PVP as a surfactant, J. Alloys Compd, 2009,484, 729-733. [ Links ]
30 K.C. Anjaneya, G.P. Nayaka, J. Manjanna, G. Govindaraj and K.N. Ganesha, Preparation and characterization of Ce1-xSmxO2-d (x = 0.1-0.3) as electrolyte material for intermediate temperature SOFC, Solid State Sci, 2013, 26, 89-96. [ Links ]
31 R.D. Waldron, Infrared spectra of ferrites, Phys. Rev., 1955, 99, 1727-1735. [ Links ]
32 T.S. Nguyen, G. Postole, S. Loridant, F. Bosselet, L. Burel, M. Aouine, L. Massin, P. Gelin, F. Morfin and L. Piccolo, Ultrastable iridium-ceria nanopowders synthesized in one step by solution combustion for catalytic hydrogen production, J. Phys. Chem. A, 2014, 2, 19822-19832. [ Links ]
33 T. Hasegawa, N. Ogita, K. Matsuhira, S. Takagi, M. Wakeshima, Y. Hinatsu and M. Udagawa, Raman scattering study in iridium pyrochlore oxides, J. Phys.: Conf. Series, 2010, 200, 012054. [ Links ]
34 M. de los Reyes, K.R. Whittle, Z. Zhang, S.E. Ashbrook, M.R. Mitchell, L.Y. Jang and G.R. Lumpkin, The pyrochlore to defect fluorite phase transition in Y2Sn2-xZrxO7, RSC Adv., 2013, 3, 5090-5099. [ Links ]
35 F.N. Sayed, V. Grover, K. Bhattacharyya, D. Jain, A. Arya, C.G.S. Pillai and A.K. Tyagi, Sm2-xDyxZr2O7 pyrochlores: probing orderdisorder dynamics and multifunctionality, Inorg. Chem., 2011, 50, 2354-2365. [ Links ]
36 D. Chen, R. Ran, K. Zhang, J. Wang and Z. Shao, Intermediate-temperature electrochemical performance of a polycrystalline PrBaCo2O5+d cathode on samarium-doped ceria electrolyte. J. Power Sources, 2009, 188, 96-105. [ Links ]
37 C. Peters, A. Weber and E. Ivers-Tiffée, Nanoscaled (La05Sr05)CoO3-] thin film cathodes for SOFC application at 500°C<T<700°C, J. Electrochem. Soc, 2008,155, B730-B737. [ Links ]
38 S. Wang, J. Yoon, G. Kim, D. Huang, H. Wang and A.J. Jacobson, Electrochemical properties of nanocrystalline La0.5Sr0.5CoO3-x thin films, Chem. Mater., 2010, 22, 776-782. [ Links ]
Received 22 January 2016
Revised 2 April 2017
Accepted 17 August 2017
* To whom correspondence should be addressed. E-mail: owaga@ukzn.ac.za/ pndungu@uj.ac.za

