


![Polyaniline/SiO2 catalyzed one-pot synthesis of tetrahydrobenzo[b]pyran derivatives](/img/en/prev.gif)


Services on Demand
Article
 English (pdf)
 Article in xml format
 Article references
Indicators

Related links
-
 Cited by Google
 -
 Similars in Google
Share

 Permalink
South African Journal of Chemistry
On-line version ISSN 1996-840X
Print version ISSN 0379-4350
S.Afr.j.chem. (Online) vol.69 Durban 2016
http://dx.doi.org/10.17159/0379-4350/2016/v69a31
RESEARCH ARTICLE
Alternative method for qualitative analysis of specific non-volatile organic compounds present in South African water systems
R. BruttiI, II; M.M. MaguI, *; E.S. AgorkuI; P.P. GovenderI, *
IDepartment of Applied Chemistry, University of Johannesburg, 17011 Johannesburg 2028 Doornfontein, South Africa.
IIDépartement de Chimie, Ecole Nationale Supérieure des Ingénieurs en Arts Chimiques et Technologiques (INP), 31030 Toulouse, France
ABSTRACT
Currently, water quality assessment has become a necessity in order to maintain healthy living. Point and non-point sources of water pollutants are either organic or inorganic in nature. Non-volatile organic compounds (nVOCs) mostly exist as solids at room temperature and are used on a large scale in most chemical industries. Since these nVOCs are toxic to both animals and humans and some of these non-volatile organic compounds are carcinogenic, it is important to analyze the water in order to ascertain its quality by identifying which types of compounds are present in these systems and quantifying them. This work reports on the use of a new and alternative method for qualitative analysis of nVOCs in water systems. Analysis was done for 13 sampling sites (seven from wastewater and six from surface water found in Gauteng and KwaZulu-Natal provinces, respectively). Vacuum evaporation followed by methanol extraction of the residues was performed. Fourier Transform Infrared (FTIR) was conducted using NaCl disc and KBr pellets and their results compared. High Performance Liquid Chromatography (HPLC) was chosen as a technique for comparison and to prove that the simple infrared (IR) can be used instead. In addition, HPLC is an ideal analytical technique for non-volatile substances.
Keywords: Water quality, non-volatile organic compounds, FTIR, HPLC.
1. Introduction
In South Africa, water systems present in Gauteng and KwaZulu-Natal provinces continue to be polluted daily due to heavy industrial and mining activities. The pollutants in most surface water are organic compounds and are either volatile or non-volatile in nature. Non-volatile compounds (nVOC) are substances which, despite having low vapour pressure, may evaporate at room temperature.1 They exist mostly as solids at room temperature (20-25 °C). The presence of non-volatile organics in water systems originate from humans activities, such as the petroleum industry, agrochemicals and many other chemical industries.
Chlorinated organic compounds (COCs) represent an important class of compounds and many of them have been produced in large quantities. COCs may sometimes be released during their production and use from several industries. Spills and accidental release contaminate the environment unintentionally, but also natural processes such as volcanoes and weathering of rocks can also contribute to the environmental load of COCs.2 Chlorinated organic substances can be negative for both animals and human health and can also potentially cause adverse effects on the ecosystem. Therefore, it is always crucial to ensure and maintain the good quality of water systems in South Africa through frequent monitoring of organic pollutants such as COCs.3
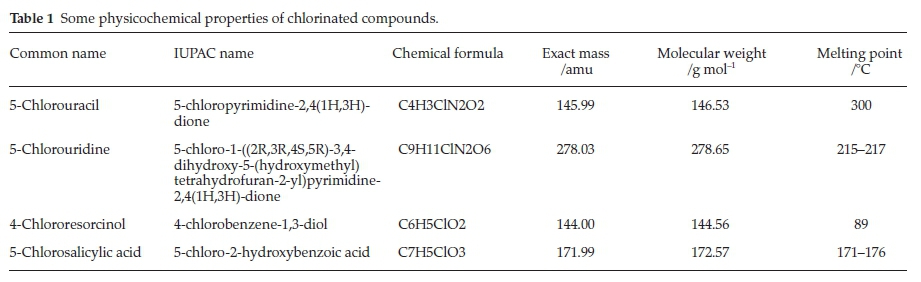
Polyglycols, surfactants, rubber additives, pesticides, dyes and pharmaceuticals are chemical families containing a large number of non-volatile compounds.4 Crathrome et al.5provides a description for the determination of four particular non-volatile chlorinated compounds (Fig. 1) namely: 5-chlorouracil used in pharmaceuticals, 4-chlororesorcinol used in the formulation of hair dyes, colours and tints, 5-chlorouridine used as a biomarker and finally 5-chlorosalicylic acid used as an intermediate of pesticide.6
The physical and chemical properties of these 4 chlorinated non-volatile organic compounds are given in Table 1.
When non-volatile compounds are mixed with volatile liquids such as methanol, it is easy to separate them by evaporation. The volatile liquid will evaporate leaving the non-volatile solid as a residue. Most organic compounds identified in water are volatile and account for approximately 20 % of the total organic content, while the rest are known as non-volatiles.4
For water samples, several procedures exist for the isolation of non-volatile organic compounds.7 They include, but are not limited to, liquid-liquid extraction, precipitation and adsorp-tion.8 Vacuum evaporation followed by methanol extraction seems to be the most appropriate technique for small samples of water (<1 L).9 The freeze-drying method followed by methanol or dichloromethane (DCM) extraction can be used for sample volumes ranging between 1 and 60 L. The experimental and developmental (XAD)9-10 resins adsorption technique, known for having high recoveries of organics from natural waters (>80 %), is used for water samples up to 150 L.10c,10e,11 However, most of these analytical techniques are time-consuming during sample extraction and analysis. In addition, they require use of complex equipment/instruments for the extraction of the organic compounds. Therefore, a cheap, more convenient, reliable and fast method is needed.
Carbon-Chloroform extraction12 and reverse osmosis13 are also available techniques which are used for non-volatile organics6b extraction in water. In addition, both freeze-drying and vacuum evaporation techniques have shown that they can both be applied for the isolation and the concentration of non-volatile organics in water.14
Gas chromatography coupled with mass spectrometer (GC-MS)15 has been used extensively for volatile organics analysis16 in water. However, GC-MS cannot be used for non-volatile organics identification6b due to the insufficient volatility of these compounds. The method used for non-volatile compounds separation6b must have a great resolution power and detection sensitivity.5,6b High performance liquid chromatography (HPLC) seems to be the closest ideal analytical technique for non-volatile substances. In the 1990s, several chromatographic methods such as HPLC using normal-phase or reversed-phase chromatography were reviewed many times. Ion exchange chromatography is also used and provides high resolution of separation of non-volatile organics present in water.17
The characterization of separated non-volatiles is possible with a mass spectrometer linked to HPLC in order to identify molecules which have a molecular weight below 2000 g mol-1.8 Other useful characterization techniques include, ultraviolet-visible (UV-Vis), infrared (IR) spectroscopy and nuclear magnetic resonance (NMR).18
2. Experimental
2.1. Sample Collection
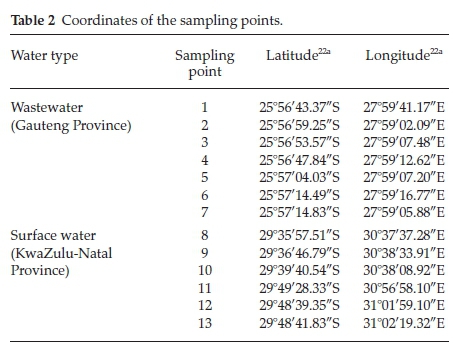
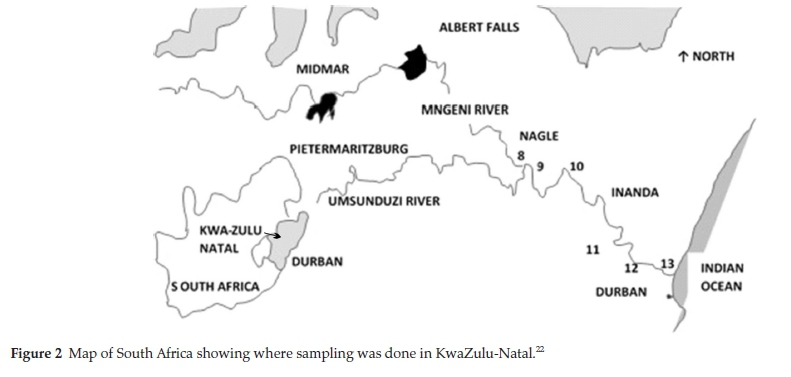
Thirteen sampling sites were chosen; seven from a wastewater treatment plant located in Gauteng and six from surface water (river) running from the Nagel dam (29.5836°S, 30.6169°E) to the Indian Ocean in Durban, KwaZulu-Natal, South Africa (Fig. 2; Table 2). In the wastewater treatment plant, samples at all the treatment stages were collected including two samples from upstream and downstream of the river in which the final effluent was discharged. The selection of these sites was guided by probable pollution from high vehicle movement, industrial discharge and/or domestic waste in that region.19 Water samples were collected for a period of one year between May 2014 and April 2015 in order to include different seasons of the year. The sample collection technique was in agreement with the methods reported by Korfali and Davies19 for use in shallow rivers.20 This involved wading in water to collect samples at different points along the river which had low levels of water.21
One-litre glass bottles23 were used to collect water samples after rinsing them twice with the river water and/or wastewater at each sampling point. Immediately after, the bottles were filled with flowing water in the direction of river current23 or using a steel bailer especially in wastewater treatment plant when fetching samples from the treatment ponds.24 Labelling of sample bottles was done with respective site location, date and time of collection as recommended by Eaton, et al.25Conductivity and pH of the samples collected was measured in the field immediately after collecting them. The samples were later preserved as recommended by standard methods for examination of water and wastewater.25-26 The samples were transported in cooler boxes filled with ice cubes in order to maintain a temperature of 4 °C and below. In the laboratory, samples were stored in a refrigerator maintained at below 4 °C. Sample analysis was carried out within 14 days from collection date.
2.2. Theoretical Calculations of Selected Non-volatile Organic Compounds (nVOCs)
Geometrical optimization was carried out using three different program namely, Gaussian 09, Spartan and Chem3DBio. Raman and IR spectra calculations were done using Density Functional Theory (DFT), B3LYP functional and 3-21G basis set.
2.3. Sample Preparation
2.3.1. Extraction using Vacuum Rotary Evaporator
A volume of 250 mL of each sample was transferred into 500 mL round-bottom flask and fitted in the vacuum rotary evaporator. The water bath was set at 55 °C and the sample evaporated to dryness. Methanol (25 mL) was later added to the solid residue for the extraction, and the mixture was centrifuged in order to collect the liquid. This operation was repeated three times, and the organic liquid extract8,27 was concentrated in the rotary evaporator (water bath at the temperature of 45 °C) to obtain around 0.5 mL. The final product was transferred into a sample vial and later stored in the refrigerator.
2.3.2. Separation and Identification
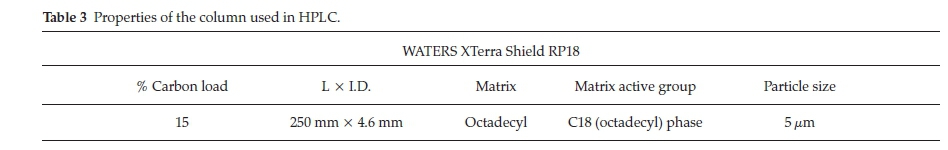
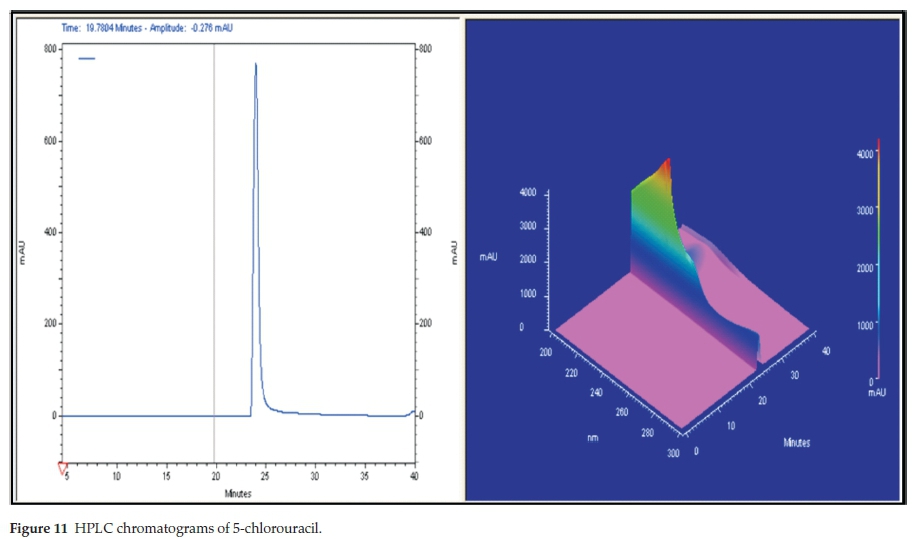
High performance liquid chromatography (HPLC) with UV-Vis detector at fixed wavelength (280 nm), was used for the analysis of extracted non-volatile organic compounds.5 nVOCs were isolated and identified from the chromatograms. The separation was performed on an XTerra Shield RP18 Column. Properties of the column are provided in Table 3.
The 5-chlorouracil standard was run, giving the characteristic peak at 23 min as shown in Fig. 11. This peak was taken as our reference peak since we wanted to qualitatively determine the presence of non-volatile organic compounds in water systems.6b
Chloride levels were determined using ion chromatography.
A reverse phase column with a solvent composed of 60 % methanol and 0.1 % aqueous acetic acid was used.28 Standards were initially run through the column and samples were later injected under the same experimental conditions.
In addition, FTIR was used for functional group identification. Solid disks were prepared using KBr and NaCl. Since the samples were liquid, the 'drop and dry' method was used for sample preparation. Once the KBr pellets were prepared, a drop of extract was placed on the disc/pellets and dried at room temperature before analysis.
3. Results and Discussion
Measurements of conductivity, pH and chloride levels were conducted on all of the collected samples. The data for conductivity and chlorides are presented in Fig. 3.
From Fig. 3, it was observed that there exists a relationship between chloride concentration and conductivity, where an increase in chloride ultimately increases the level of conductivity. This can be explained by the presence of free ions (both cations and anions) responsible for electrical conductivity in any liquid. The figure shows high levels of both conductivity and chlorides especially at sampling point 5 (wastewater system). Points 4 and 5 are direct wastewater samples from a textile industry before released to the municipal wastewater treatment plant and hence the high levels could be attributed to the nature of the work in this textile industry. Points 11 and 12 comprised samples from the river before entry into the ocean and after the river mixed with the ocean/sea. Highest levels of conductivity and chloride are due to salts present in the seawater. In addition, sea water is known to have high salinity and hence contributing to high values of chlorides and conductivity. Sampling point 8 was in a mountainous area where there is minimal human activity and hence the water showed low values of chlorides. The maximum allowable limit (MAL) for chlorides in drinking water is 250 mg L-1.29 MAL for electrical conductivity in water is between 1200 and 1500 µS cm-1.30
Figure 4 shows the change in pH at all the sampling points. Monitoring the pH describes how acidic or basic the water is and whether it is safe for use. The World Health Organization (WHO) recommends that drinking water should have pH values ranging between 6.5 and 8.5.31 All sampling points except points 4 and 5 were within these limits. Industrial water is reported as acidic and hence requires treatment before discharge into the environment.
3.1. Identification of Functional Groups
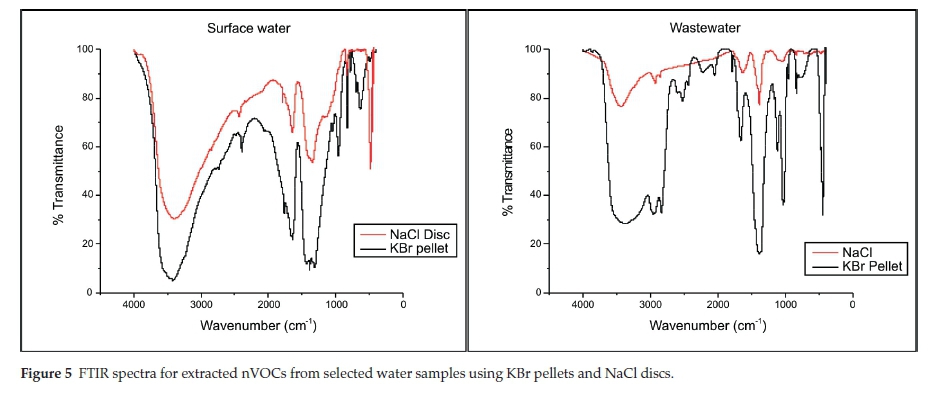
Fourier Transform infrared (FTIR) was done in order to determine the functional groups of the nVOCs extracts from water samples. FTIR results for both KBr pellets and NaCl disc are presented in Fig. 5.
These spectra show the presence of the C-Cl bond at approximately 600-650 cm-1 in most of the analyzed samples. Fig. 5 gives the difference between the use of KBr pellet and NaCl disc. Comparing the two methods shows that the KBr pellet preparation ('drop and dry' method) gave better spectra and peaks as opposed to NaCl discs for both surface water and wastewater extracts. In addition, characteristic peaks for -OH bond were observed between 3500 and 3100 cm-1.
Table 4 presents possible assignments of FTIR peaks for extracts from surface and wastewater samples. It provides an idea of the probable compounds which could be present in these two samples. Distinctive peaks detected by vC=O bond near 1760 cm-1, vC=C bond near 1640 cm-1, δ = C-H at 825 cm-1 and vC-C at 1045 cm-1 usually confirms the presence of organic compounds.
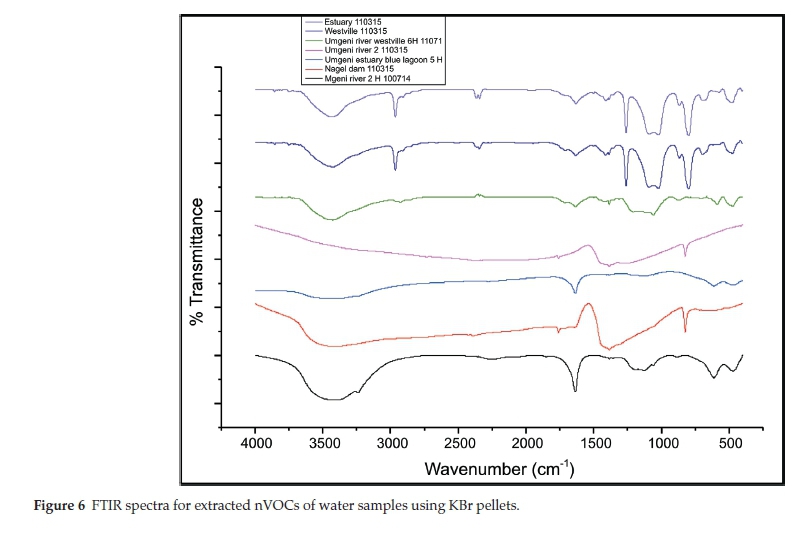
Figure 6 Shows FTIR spectra for non-volatile organic compounds extracted from water samples collected from surface water in KwaZulu-Natal province. All samples appear to have a -OH group between 3500-3200 cm-1. Nagel Dam and Blue Lagoon have very few peaks compared to all the other sampling points. Nagel Dam sampling points show few FTIR peaks probably due to its geographical location which has no or limited human activities, hence could be least polluted. The fewer peak for Blue Lagoon extract could be attributed to low flow rate of the river hence leading to deposition/settling of pollutants in the river bed/bottom. Additionally, the mixing of the surface water and the ocean might have triggered deposition of pollutants due to changing pH of the resulting mixed water.
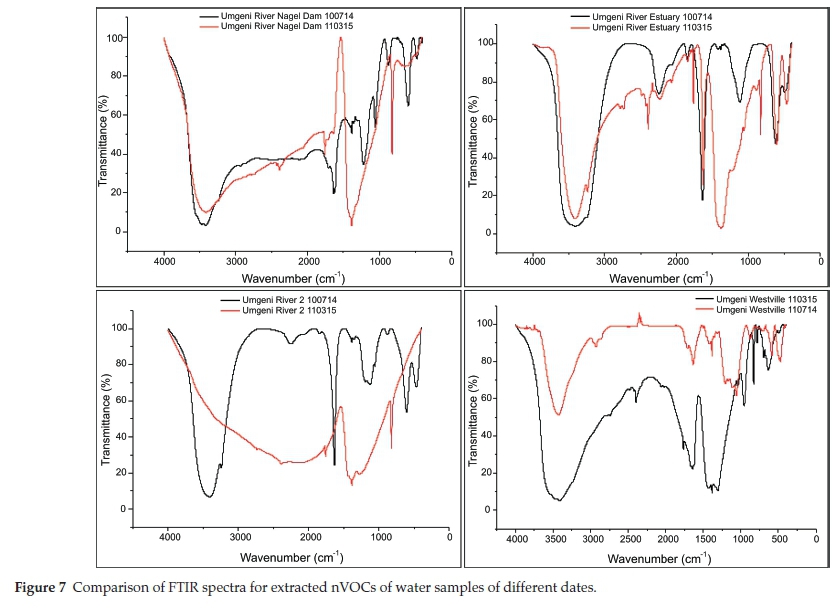
Figure 7 shows comparison of nVOCs extracted from four water samples collected in two different seasons of the year; namely winter and summer. There is a notable difference between the FTIR peaks of the same sampling site but different seasons. Comparing all sampling sites, only Umgeni River 2H showed a great spectrum difference. This can be attributed to the different activities taking place in this particular sampling site. The site has numerous human activities for example, in 2014, during sample collection, many activities such cattle grazing, agriculture, swimming, washing of clothes and cars beside the river and collection of water from this sampling were observed as opposed to sampling done in 2015.
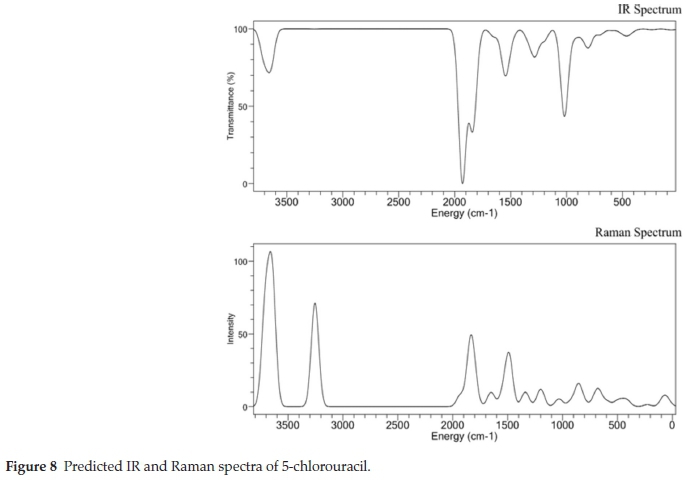
The results given in Fig. 8 shows the vibrational frequencies of 5-chlorouracil. The energy from the minimization calculation is as follows:
5-Chlorouracil.pdb
Minimize (Energy/Geometry) B3LYP/3-21G
Potential Energy = -1088651.7331 Kcal/Mol
Total Energy = -545702.3138 Kcal/Mol
Finish @ energy = -545702.313775 Kcal/Mol (-869.632711 Hartrees)
Simulated FTIR spectrum of the standard, 5-chlorouracil, is also presented (Fig. 8). In addition, the Raman spectrum of the sample compound was calculated using Spartan 14 software version 1.1.4 running on Windows operating system.
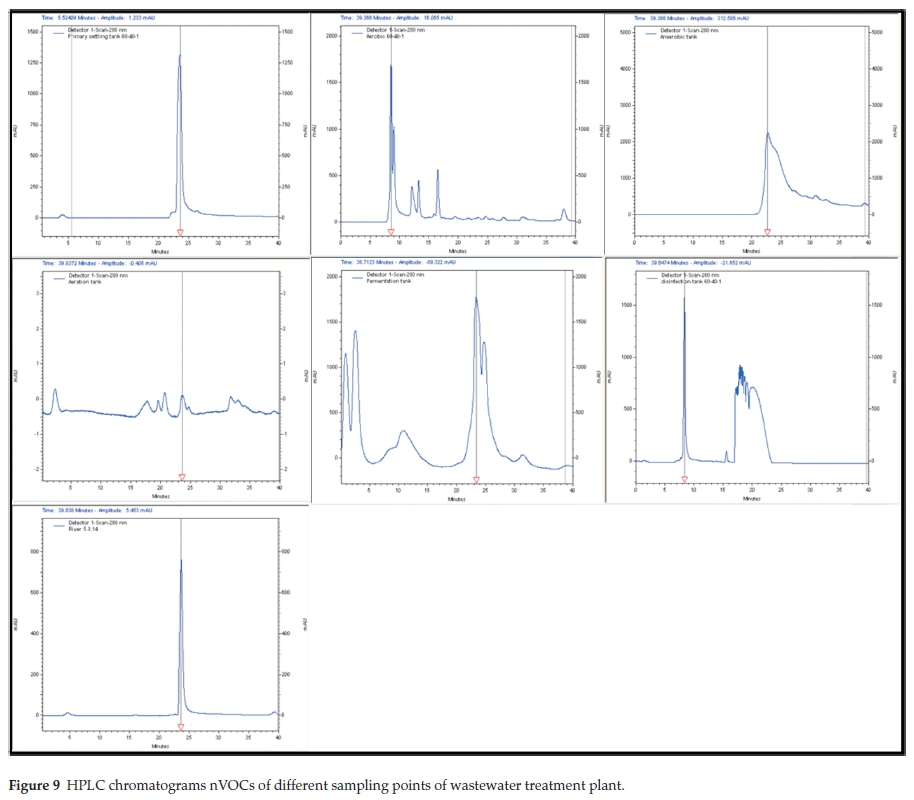
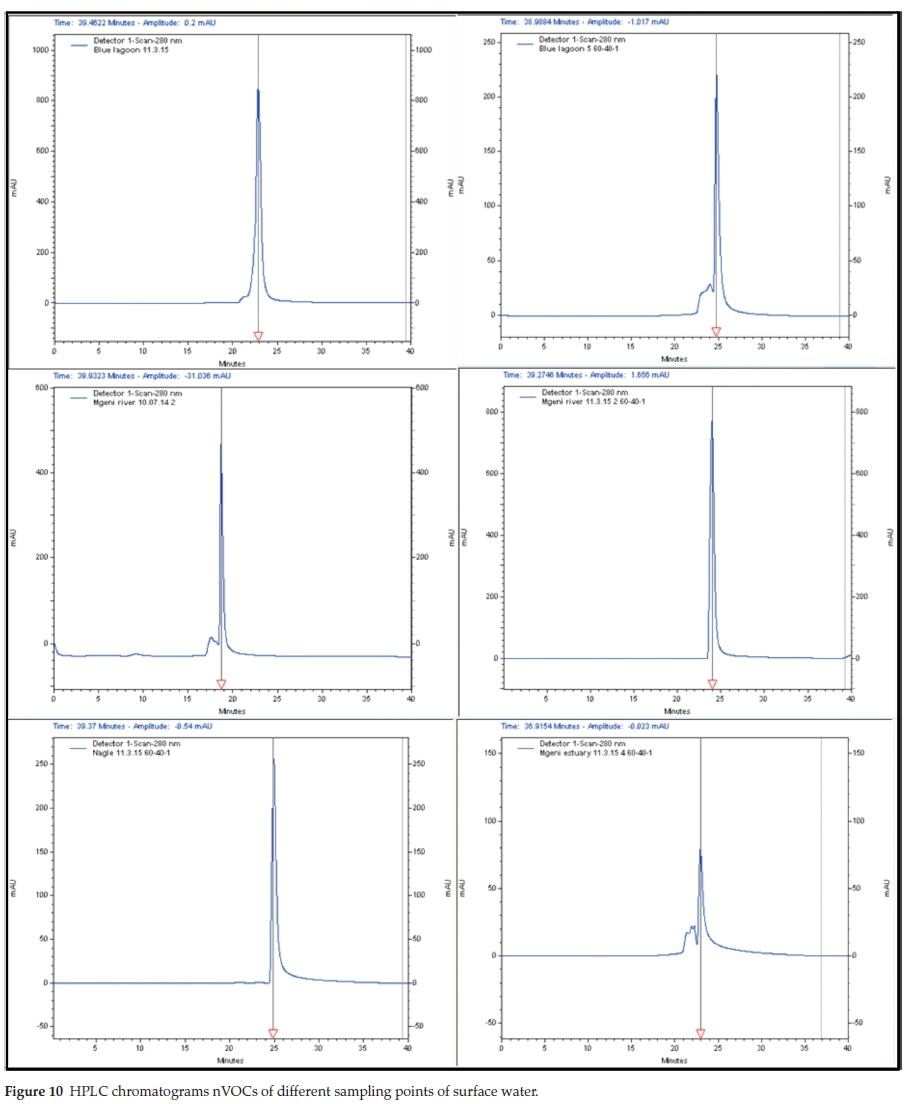
FTIR results were further supported by HPLC chromatography results presented in Fig. 9 and Fig. 10. 5-chlorouracil is used widely in the pharmaceutical industry and its detection in wastewater was expected. Both Fig. 9 and Fig. 10 exhibited the characteristic peak at 23 min with a difference in peak area and height.
Compounds such as 5-chlorouracil, 4-chlororesorcinol, 5-chlorouridine and 5-chlorosalicylic acid5 have been found in several treated waters in the United Kingdom in the past.6a All these compounds are chlorinated and could be attributed to the water treatment methods used. These pollutants have been known to be harmful to human health. As a result, it is always better to keep monitoring their levels in drinking waters. Furthermore, surface waters known to be used for drinking by both humans and animals should be regularly monitored in order to prevent the consequences caused by intake of such pollutants.
4. Conclusion
The largest percentage of organic content detected in both surface and treated waters is composed of non-volatile organic compounds (nVOCs). Majority of non-volatile compounds present in many agricultural, industrial and pharmaceutical wastes, finally end up in the aquatic environment. Research on the chlorination and ozonation organic by-products have shown that most of them are non-volatile. Unavailability of proper techniques for the extraction and characterization of nVOCs from water has led to minimal data on the amounts and types of nVOCs found in water. The determination of nVOCs in water would benefit considerably from a more extensive use of new techniques such as the one highlighted here.
Most of samples from surface water had chloride concentrations below MAL except samples from sapling sites 11 and 12 that showed high concentrations. FTIR spectra qualitatively indicated the presence of chlorinated organic compounds in the samples. Comparison between KBr pellets and NaCl disks proved that KBr pellets gave more precise spectra for all the extracts.
HPLC chromatograms were in agreement with FTIR spectra concerning the presence of organics in the samples. Therefore, 5-chlorouracil was qualitatively detected in all the water samples but in different intensities.
Acknowledgements
The authors are most grateful to the department of applied chemistry of University of Johannesburg for providing facilities to undertake this research. In addition, the authors give special thanks to Johannesburg Water Company for their continued support in accessing their facilities during sampling and the South African Water Research Commission (WRC) number K5-2321 and Global Excellence and Stature (GES) for financial support during this research.
References
1 Murphy, B. Buckley and L. Lippincott, The characterization of tentatively identified compounds ( TICs ) in samples from public water systems in New Jersey, Environ. Assess. Risk Anal. Elem., 2003, 1-37. [ Links ]
2 a) B. Huang, C. Lei, C. Wei and G. Zeng, Chlorinated volatile organic compounds (Cl-VOCs) in environment - sources, potential human health impacts, and current remediation technologies, Environ. Int., 2014, 71, 118-138; [ Links ] b) D. Henschler, Toxicity of chlorinated organic compounds: effects of the introduction of chlorine in organic molecules, Angew. Chem. Int. Edn. Engl., 1994, 33, 1920-1935. [ Links ]
3 S. Ramamoorthy and S. Ramamoorthy, Chlorinated Organic Compounds in the Environment: Regulatory and Monitoring Assessment, 1997, CRC Press, Boca Raton, Florida. [ Links ]
4 J. Rivera, D. Fraisse, F. Ventura, J. Caixach and A. Figueras, Identification of non-volatile organic compounds in GAC filters and in raw and drinking water extracts by FAB and FAB-CID-MIKE spectrometry, Anal. Chem, 1987, 328(7), 577. [ Links ]
5 B. Crathorne, C.D. Watts and M. Fielding, Analysis of non-volatile organic compounds in water by high-performance liquid chromatography, J. Chromatogr. A, 1979, 185, 671-690. [ Links ]
6 a) H. Davy, Chlorinated Drinking Water, 1986, WHO, London; [ Links ] b) G. Angeletti and A. Bj0rseth, Analysis of organic micropollutants in water, in Proceedings of the Third European Symposium on Pollution and Remediation held in Oslo, Norway, September 19-21,1983, 2012; [ Links ] c) D.T.E. Hunt and A.L. Wilson, The Chemical Analysis of Water: General Principles and Techniques, Springer, Brussels, 1986. [ Links ]
7 I. Liska, Pesticides in water: sampling, sample preparation, preservation, in Encyclopedia of Analytical Chemistry, John Wiley & Sons, New York, 2006, pp. 1-16. [ Links ]
8 C. Watts, B. Crathorne, M. Fielding and S. Killops, Nonvolatile organic compounds in treated waters, PMC, 46, 1982, 87-99. [ Links ]
9 B. Crathorne and C.D. Watts, Identification of non-volatile organic compounds in water, in Analysis ofOrganic Micropollutants in Water SE-20 (A. Bjørseth and G. Angeletti, eds.), Springer, Brussels, 1982, pp. 159-173. [ Links ]
10 a) L. Lienig, Measurement of Organic Pollutants in Water and Waste Water. American Society for Testing and Materials Technical Publication 686, Internationale Revue der gesamten Hydrobiologie und Hydrographie, 1981, 66(3), 440-441. [ Links ] b) M.M. Hussein and D.A.M. Mackay, Large bore coated columns in analysis for trace organic pollutants in water, J. Chromatogr., 1982, 243, 43-50; [ Links ] c) I.H. Suffet and M. Malaiyandi, A.C.S.D.o.E. Chemistry, A.C.S.D.o.A. Chemistry, in Organic Pollutants in Water: Sampling, Analysis, and Toxicity Testing, American Chemical Society, Washington, DC, 1987, pp. 1-780; [ Links ] d) Y. Hasegawa, Y. Nakamura, Y. Tonogai and Y. Ito, New methodology for analysis of small amount of organic pollutants in environmental water using Dean-Stark distillation method, Eisei Kagaku, 1988, 34, 508-517; [ Links ] e)M.F. Mehran,M.G. Nickelsen, N. GolkarandW.J. Cooper, Improvement of the purge-and-trap technique for the rapid analysis of volatile organic pollutants in water, Hrc-J. High Res. Chrom., 1990, 13, 429-433. [ Links ]
11 a) J.A. Graham, HPLC for determination of trace organic compounds in aqueous environmental samples, in Organic Pollutants in Water, Vol. 214, American Chemical Society, Washington, DC, 1986, pp. 97-135; [ Links ] b) H. Frischenschlager, M.L. Peck, C. Mittermayr, E. Rosenberg and M. Grasserbauer, Improved screening analysis of organic pollutants in river water samples by gas chromatography with atomic emission detection (GC-MIP-AED), Presen J. Anal. Chem., 1997, 357, 1133-1141. [ Links ]
12 J.C. Loper and M.W Tabor, Detection of organic mutagens in water residues, in Short-Term Bioassays in the Analysis of Complex Environmental Mixtures II (M.D. Waters, S.S. Sandhu, J.L. Huisingh, L. Claxton and S. Nesnow, eds.), Springer US, Boston, MA, 1980, pp. 155-165. [ Links ]
13 M. Deinzer, R. Melton and D. Mitchell, Trace organic contaminants in drinking water; their concentration by reverse osmosis, Water Res., 1975, 9, 799-805. [ Links ]
14 B. Crathorne and C.D. Watts, Non-volatiles in drinking water, WRC Environmental Protection, 1986, pp. 1-73. [ Links ]
15 T.L. Jones-Lepp, D.A. Alvarez, B. Englert and A. L. Batt, Pharmaceuticals and hormones in the environment, in Encyclopedia of Analytical Chemistry, John Wiley & Sons, New York, 2006, pp. 1-20. [ Links ]
16 C. Water Resources Scientific Information, S. United, R. Office of Water, Technology, S. Geological, Selected water resources abstracts, Selected Water Resources Abstracts, The Center, Washington D.C., 1968, pp. 1991. [ Links ]
17 a) R.L. Jolley, Concentration techniques for analysis and toxicity testing of organic-constituents in environmental water samples, Abstr. Pap. Am. Chem. S., 1984, 188, 19-Envr; [ Links ] b) R.L. Jolley, R.B. Cumming W.W. Pitt, F.G. Taylor, J.E. Thompson and S.J. Hartmann, Ecological impact of chloro-organics produced by chlorination of cooling tower waters, Microbiology of Power Plant Thermal Effluents, 1977, 09(13), pp. 1-11. [ Links ]
18 C.H. Yoder, P.A. Leber and M.W. Thomsen, The Bridge To Organic Chemistry: Concepts and Nomenclature, Wiley, New York, 2010. [ Links ]
19 S.I. Korfali, B.E. Davies, Speciation of metals in sediment and water in a river underlain by limestone: Role of carbonate species for purification capacity of rivers, Adv. Environ. Res., 2004, 8, 599-612. [ Links ]
20 E. Askew, Quality control for federal clean water act and safe drinking water actregulatory compliance, J.AOACInt, 2013, 96, 171-177. [ Links ]
21 M.W. Clark, D. McConchie, D.W. Lewis and P. Saenger, Redox stratification and heavy metal partitioning in Avicennia-dominated mangrove sediments: a geochemical model, Chem. Geol., 1998, 149, 147-171. [ Links ]
22 a) M.M. Magu, P.P. Govender and J.C. Ngila, Geochemical modelling and speciation studies of metal pollutants present in selected water systems in South Africa, Phys. Chem. Earth, Parts A/B/C, 2016, 92, 44-51; [ Links ] b) Google-maps, Google, Google Maps, 2016. [ Links ]
23 S.I. Korfali and B.D.E. Davies, The relationships of metals in river sediments (Nahr-Ibrahim, Lebanon) and adjacent floodplain soils, Agric. Eng. Int.: CIGR J., 2004, VI. [ Links ]
24 Industrial Waste Resource Guidelines (IWRG), Samplingand Analysis ofWaters, Wastewaters, Soils and Wastes, Environment Protection (Industrial Waste Resource) Regulations, EPA, Victoria, 2009, 1-36. [ Links ]
25 A.D. Eaton and M.A.H. Franson, A.P.H. Association, A.W.W. Association, W.E. Federation, Standard Methods for the Examination of Water & Wastewater, American Public Health Association, California, 2005. [ Links ]
26 K. Ayoub Momani, Chemical assessment of bottled drinking waters by IC, GC, and ICP-MS, Instrum. Sci. Technol., 2006, 34, 587-605. [ Links ]
27 M.C. Hennion, Sample handling strategies for the analysis of nonvolatile organic-compounds from environmental water samples, Trac-Trend. Anal. Chem., 1991, 10, 317-323. [ Links ]
28 J. Lehotay, K. Hroboova and S. Hatrik, Trace analysis of some organic compounds in environmental samples by HPLC., Crit. Rev. Anal. Chem., 1999, 29, 95-98. [ Links ]
29 O.S. Fatoki, Quality assessments for chlorides, nitrates and phosphates in drinking water and waste-water effluents of major cities in the Eastern Cape, South Africa, S. Afr. J. Sci., 1999, 95, 237-239. [ Links ]
30 a) U. Rivett, M. Champanis and T. Wilson-Jones, Monitoring drinking water quality in South Africa: designing information systems for local needs, Water SA, 2012, 39, 409-414; [ Links ] b) U. Rivett, M. Champanis and T. Wilson-Jones, Monitoring drinking water quality in South Africa: designing information systems for local needs, Water SA, 2013, 39, 409-414; [ Links ] c) R.B. McCleskey, D. Kirk Nordstrom and J.N. Ryan, Electrical conductivity method for natural waters, Appl. Geochem., 2011, 26, Supplement, S227-S229. [ Links ]
31 WHO, Water Quality and Health Strategy, 2013, pp. 1-15. [ Links ]
Received 28 April 2016
Revised 11 October 2016
Accepted 14 October 2016
* To whom correspondence should be addressed. E-mail: magujnr@gmail.com / pennyg@uj.ac.za

