


Serviços Personalizados
Artigo
 Inglês (pdf)
 Artigo em XML
 Referências do artigo
Indicadores

Links relacionados
-
 Citado por Google
 -
 Similares em Google
Compartilhar

 Permalink
South African Journal of Chemistry
versão On-line ISSN 1996-840X
versão impressa ISSN 0379-4350
S.Afr.j.chem. (Online) vol.69 Durban 2016
http://dx.doi.org/10.17159/0379-4350/2016/v69a26
REVIEW ARTICLE
Mine air analysis on the reef in the early 1900s -Observations from the work of James Moir, Government Analyst
Peter Loyson*
Chemistry Department, Nelson Mandela Metropolitan University, P.O. Box 77000, Port Elizabeth, 6031, South Africa
ABSTRACT
James Moir was a pioneering chemist in the early 1900s who played a leading role in various chemical societies in South Africa. He was heavily involved in the gold mining industry, and as the Government Analyst in Johannesburg he was responsible for mine air quality in the Witwatersrand mines. This article traces his contributions dealing with the analysis of mine air in the early 1900s as reported in the local Journal of the Chemical, Metallurgical and Mining Society of South Africa. It deals with CO2 and CO analyses and the methods used in those days, describes his work on gases arising from explosions of gelignite, and covers the two main air-sampling techniques for dust analysis used in his time, namely the sugar tube method and the konimeter.
Keywords: History of chemistry, mine air analysis, dust-sampling in the early 1900s.
1. Introduction
James Moir (1874-1929) played a leading role in the field of chemistry in South Africa in the early 1900s. His activities as a chemical analyst, physical chemist, inorganic chemist and especially organic chemist, as well as his professional career have already been described in previous publications in this journal.1-4 In 1904 he was appointed chemist to the Transvaal Department of Mines, and in 1914 joined the staff of the Government Analyst at the Government Chemical Laboratories in Johannesburg, a position which he held for 15 years until his death. He was elected President of the Chemical, Metallurgical and Mining Society of SA in 1910 and during his inaugural address, he gave his opinions on many different aspects of chemistry, geophysics, education and the chemical industry.5
As a chemist to the Transvaal Department of Mines he was associated with the gold-mining industry which led him to investigate the extraction of gold by the cyanide process. As a Government Analyst he was called upon to analyze the air in the mines and to apply dust-sampling techniques, which led to a better understanding of the character of dust particles found in mine air. Some of these particles were already associated with phthisis, a lung disease affecting mine workers. This article covers his involvement as a mining chemist, concentrating mainly on the analysis of mine air in the early 1900s in the Witwatersrand area in South Africa, as reported in the pages of the Journal of the Chemical, Metallurgical and Mining Society of South Africa, now the Journal of the Southern African Institute of Mining and Metallurgy.
2. Early Work in 1904-1905
In July 1905 James Moir published a paper entitled 'The vitiation of the air in Transvaal mines' in the Journal of the Chemical, Metallurgical and Mining Society ofSouth Africa.6It dealt with some 40 air-sample analyses carried out by his Department at various levels in certain Rand deep-level mines over the period June to November 1904. He reported the concentration of CO2 in parts per thousand (ppt). For example, in the South Reef, the 5th and 6th level gave respectively 1.79 and 1.39 ppt, the high values reflecting the previous day's blasting; in the fresh return air it was 0.42 ppt; the return air from workings gave high values varying from 1.34 to 4.20 ppt. The CO content in the working air was also reported, giving values ranging from 0.13 to 0.53 ppt. He analyzed the results in three parts: air from compressors, ordinary working mine air and air after blasting with nitroglycerine explosives. In his paper he criticized a Dr Haldane's report on similar analyses under more ideal conditions in a mine in Cornwall. He maintained that the results of working air, as compared to a 1903 investigation, had improved due to better ventilation. The Cornwall mine had an air supply of 1926 m3 (68 000 ft3) per minute, whilst that in the mine Moir had investigated varied from 400 to 1600 m3 (14000 to 58000 ft3) per minute.
Also in the Cornwall mine there were 230 men underground, whilst in the Ferreira Deep Mine there were 350 at one time, with the corresponding larger number of lights, etc.
In his paper he made an interesting calculation to determine theoretically the amount of CO2 in working mine air: the volume of CO2 evolved per head per hour during active work at that altitude could be taken as 0.051 m3 (1.8 ft3). Consider 350 men breathing and 60 whole candles used up per hour; explosives could be taken as giving off 4.0 m3 (140 ft3)ofCO2 per hour. Using an air supply of 708 m3 (25000 ft3) per minute, containing an average of 0.034 % CO2, the results shown in Table 1 summarize his calculation.
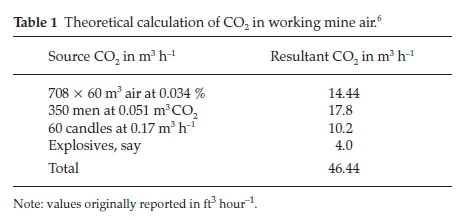
At the end of an hour this amount of CO2 will have been distributed over 708 x 60 m3 or 42480 m3 of air, giving a final proportion of 1.1 parts per thousand in the up-cast air. This value corresponded very closely with the amounts actually found during the summer months. The Western Australian Commission had recommended that the air in a mine shall be condemned 'if the CO2 exceeds 1.5 % , or if the O2 falls below 20 %'.7
Sampling gases after blasting was dangerous: the highest values of CO were reported in air samples obtained as soon after blasting as possible, the samplers starting along the 60 m drive immediately after the blast, to work at once on the dangerous and unpleasant work of sampling: as things were, they were frequently ill with headache and unsteadiness.6
In the same paper,7 he mentions a new development regarding sampling of explosive gases, consisting of the use of smoke-jackets attached to the compressed air system. By protecting the samplers in this way, it was possible to collect the gases in less than 2 min after the blasting was over, and as a consequence showing up to 7 % CO2 on occasion.
3. Chemical Methods of Air Analysis in the Early 1900s
Regarding the analysis of the air in the early 1900s, Moir mentions two methods that he used: the iodine pentoxide method, and the Orsat method. These methods will now be briefly described.8
a) Iodine pentoxide method: this was specifically for CO analysis. A measured volume of gas is passed through a series of reagents to remove interferences such as unsaturated hydrocarbons, H2S and SO2, and then through a tube containing iodine pentoxide heated to 145 0C, where the CO is oxidized to CO2 with the liberation of I2, according to the reaction

The I2 vapour produced may be collected by passing the hot vapours into asuitable dryabsorbent, suchas silicagel, andthe I2 titrated with standard thiosulphate usinga micro-burette. Alternatively the analysis could be performed gravimetrically by weighing the tube and determining the amount of I2O5 reacted. Moir thought that the gravimetric method was more accurate.6
An alternative method forCO analysis was to pass the gas over heated palladium asbestos, converting CO to CO2.9
b) Orsat analyzer: Figure 1 shows the details of an Orsat analyzer.8 It consisted of a calibrated water-jacketed gas burette A, connected through glass capillary tubing to 3 (sometimes more) absorption pipettes (B, C, D) containing chemical solutions that would absorb the required gases for measurement. The gas to be tested was collected through the inlet tube E into burette A. A levelling bottle F, containing some slightly acidic water with an indicator such as methyl orange, was used to adjust the sampled gas to normal atmospheric pressure, to push the gas sample into the respective absorption chamber and to bring the gas back for measurement. The apparatus was enclosed in a wooden box to make it portable. It was patented by Mr H. Orsat in 1873.10
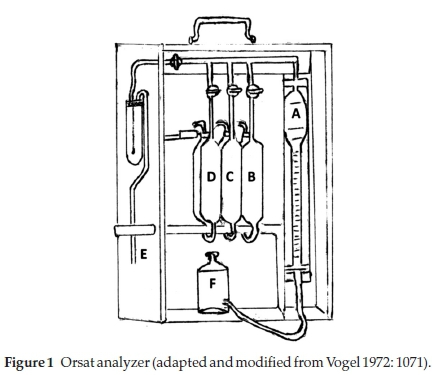
Each absorption pipette was in two parts: an absorber and a reservoir for the displaced liquid, from which it returned when the gas was withdrawn; generally the two parts were side by side. The following reagents were usually used in the absorption pipettes: in B, for CO2, a 25-33 % aqueous solution of KOH; in C, for O2, alkaline pyrogallol solution consisting of 15 g pyrogallol in 100 mL of concentrated KOH solution; and in D, for CO, acidic cuprous chloride consisting of 100 g of CuCl2 in 1:1 HCl:water.
The gas was sampled into the gas burette A and its volume was adjusted to 100 mL at atmospheric pressure, using the levelling bottle. The trapped gas was then successively pushed into each of absorbers for removal of the particular gas and the remainder brought back each time into the gas burette by lowering the levelling bottle and the volume of the left-over gas was determined by levelling; the % of the particular gas absorbed was the difference between two successive readings.
In a short communication to the journal, Moir investigated the effect of the presence of water vapour in the air.11 Assume that the fresh air inside the burette contained 0.05 % CO2,20.27 % O2, 76.45 % N2 and 3.23 % H2O; yet, on analysis, the 3.23 % of water disappeared partially because there is, at the end, only the space occupied by the nitrogen to hold it, viz. 79 % of the original space; hence 21 % of 3.23 % or 0.68 % also disappears and is counted as O2; the O2 is raised from 20.27 % to 20.95 %,which is exactly the % existing in the dry air before it entered the apparatus.
He also elaborated on the true cause of the error of about 0.4 % in O2 which one obtained with this type of apparatus. He suggested that it was due to a shifting of the apparent position of the main meniscus according to whether the reading is taken near the bottom or further up the burette.
4. Mine Air Analysis in 1906-1907
In September 1906 Moir published a more detailed report on the CO2 content of 256 samples of air collected from different parts of 46 mines around the Witwatersrand area.12 Of the 256 samples, 109 or nearly 43 % were classified as bad, being over the 1.5%CO2. This was a damning report and received severe criticism in the meetings of the Society in the following months from mine managers and others.13-16 In the same report he also produced the results of the analysis of eight samples of air collected immediately after blasting, using a new and automatic method.12 An 'empty' oxygen cylinder was evacuated by a water pump, the valve closed, and the nozzle fitted with a rubber tube ending in a sealed glass tube. This apparatus was left near the face to be blasted, about 5 to 10 m away, the valve being first opened to a minimum. The cylinder was protected from the flying stones. The first shot shattered the glass and the cylinder filled in about 30 seconds and collected the gases formed during that time of the blast. As the sample was taken underground, it was under pressure when brought to the lab and easily yielded 200 cm3 for volumetric analysis in duplicate. Owing to the extreme narrowness of the valve-inlet, no outward diffusion of the gas occurred in the interval before the cylinder was collected, even if it was 2 hours later. These samples had a CO2 content varying from 1.76-3. 7%,CO varied from 0.30-0.60 % , whilst the O2 was in the range 19.4-21.1 % . The ratio of CO/CO2 varied from 0.12 to 0.30.
In his reply at a meeting in February 1907 to all the discussions and criticism about his report, he supplied another 430 new tests, which he hoped would make the position clearer.17 He bemoaned the fact that if 50 samples were to be taken from 70 mines, the work would take 8-10 years to complete with the present resources of the Mines Department. He admitted that his previous report was perhaps over-critical, and suggested that the number of bad places all over would have been about 15 % of the whole. He however assured everyone that the dissemination of the truth, or the portion of the truth that he could see, was a public duty higher by far than even the interests ofthe chiefindustry ofthe country; nothing could be allowed to interfere with the sovereignty ofthe truth. He stated that 10 to 12 mines used an air-supply containing 0.8-1.0 ppt of CO2, and this was air that had passed already through one or more deep-level mines. He gave a calculation in which he showed that a man with candle required about 0.85 m3 (30 ft3) of fresh air per minute, so as to keep the air, which the man would breath, down to 1.5 ppt CO2.
Regarding the 0.15 % CO2 standard adopted by the Mines Department, this should be a mean for the different parts of the mine: for winzes, in dead ends and general development this could be too strict; however, on the other hand, it is far too lax for main connections and up-cast shafts. The maximum of 0.15 % CO2 prescribed by Article 56 of the Regulations would ensure that there should never be a CO content of more than 0.03 % or more than traces of organic contamination in mine air. He also showed that a standard of 0.15 % CO2 in the Witwatersrand mines was not exactly the same thing as a 0.15 % standard at sea level or in Australia, due to the different altitude and the effect of pressure: although men working at different altitudes give out the same weight of CO2 per minute, the weight in question possessed a different bulk at different altitudes. The result was that more air was required here to dilute that amount of CO2 to 0.15 %.
He further defended his report by stating that certain mines were termed bad based on their air-supply being only 0.85 m3 (30 ft3) per minute, instead of the 2.0 m3 (70 ft3) prescribed by the Regulations. He also maintained that the ratio of CO/CO2 was about 1/10 in areas where blasting occurred and not over the entire mine.
5. Analysis of Air after Explosion
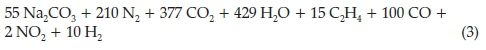
In a paper dating to November 1905,7 Moir calculated the real composition of the gases arising from the explosion of gelignite, which practically were found to be the following: no O2, 40-50 % CO2, 30-33 % N2 and 20-30 % of a mixture of CO, H2,CH4 and others. It is interesting to follow his reasoning: he assumed the following composition for gelignite with its wrapper: nitroglycerine 58.26 % , nitro-cotton 2.67 % , wood fibre + paper wrapper 14.41 % , sodium nitrate 23.76 % and paraffin wax 0.90 %. From this composition, the molecular ratio of the constituents is 101:1:35:110:1, which gives the left-hand side of the chemical equation, describing the explosion of gelignite, as follows:

He then put forward four possible alternatives for the right-hand side of the equation, the most probable one being the one containing carbon monoxide and ethylene, given below:
The presence of CO in the gases emanating from the burning of high explosives was confirmed in later work.18,19 In a short paper dating from 1909 Moir mentioned the test he used to analyze for nitrate and nitrite, when burning nitro-glycerine explosives.20 The fumes were caught in excess soda and treated in the cold with KMnO4 until it turned green and acidified. This converts the nitrogen, originally present as a mixture of nitrate and nitrite, entirely into nitrate. The solution, which should be pink is boiled with a little sodium acetate, filtered from the MnO2 and precipitated with nitron acetate, a yellow base which gives an insoluble nitrate and finally weighed as nitron nitrate C20H17N4(NO3).
The analysis of NO2 resulting from blasting in mines was a challenging analytical problem in those days. The miner's fuse-igniter was a long strip of gelatin wound round a stick. This gave off so much NO2 on burning that the government prohibited its use and made a regulation that fuse-igniters must be such that the NO2 given off on burning shall not exceed 0.5 % .1Chemical testing required the analysis of a quantity of NO2 (ranging from 2 to 7 mg) distributed over a large volume of air possibly containing nitrite, nitrate, carbonate and CO2. Moir later developed a method to determine NO2 gas in the presence of nitrite ion, based on a titrimetric method where the vapours were passed into a KI solution and the liberated I2 was titrated against thiosulphate.21 This method was superior to the hydrogen peroxide method. Further details of this method and the reaction sequence have been discussed in a previous publication.1
6. Dust Sampling in the Mines
Even in the early 1900s crystalline silica or quartz particles were already acknowledged to be dangerous, leading to miner's phthisis, a lung disease.22 Methods were therefore developed to test the dust in mines and Moir played a leading role in these developments. There were essentially two methods for analyzing the dust in mines in those early days: a gravimetric method using a sugar tube, and the konimeter. These two methods will now be described.
a) South Africa led the way in the early days of gravimetric sampling, followed by the UK and later the USA.22 A known volume of air was passed through a tube, containing a filter media. At first cotton-wool fibres were used and the mass of sampled dust particles was determined by weighing the cottonwool filter media before and after sampling. Sometimes the cotton plug was incinerated and the residue weighed. Around 1903 some dust determinations were performed using a sugar tube, in which a packed bed of sugar granules was used as the filter medium and the mass of the collected insoluble material determined after the sugar granules were dissolved in water. Moir was especially involved with this technique. The particles could be viewed using a microscope or even analyzed.
In two later reports by Gray and Mavrogordato details are given of the mechanism of the action within the sugar tube:23,24 the grains of sugar in the sugar tube were so large in comparison with the dust particles that they could not act as a filter; the air passing through the interstices between the grains of sugar would impinge on other grains, which must be slightly moist, or they would not catch the dust; it was simply a series of impacts of the particles in the air passing through the sugar tube which gave the result.
The Chamber of Mines, using the sugar tube method, claimed that in development drives the average particle density was 2.4 mg m-3.25 They also claimed that the average diameter of the particles was 1.5 microns. So, one could convert the sugar tube results in number of particles: 1 mg per m3 of air was arithmetically equivalent to approximately 800 particles per cm3; therefore the 2.4 mg sample would be arithmetically equivalent to about 1920 particles.25
b) The term konimeter was used before the 1960s to indicate a one-stage impacter.22 The first konimeter was constructed by Sir Robert Kotze in 1919 in the Union of South Africa.22 It was a very practical and efficient little instrument for trapping suspended matter in the air. A pump, actuated by releasing a spring, drew 5 cm3 of air through a small cell, bounded by a rubber ring. The inlet of this cell was a fine jet tapered down to 0.8 mm in diameter, through which the air was drawn at a high velocity, causing it to impinge on a cover glass set at a distance of 0.5 mm from the nozzle of the jet. The outlet was a circular aperture in the centre of which the jet was fixed. The cover glass or slide was coated with a film of some adhesive (petroleum or glycerine jelly) to which the suspended particles adhered. The slide was movable, so that different spots could be taken on one slide. In a later design a powerful lens was attached to the konimeter so that by holding the jet in line with the light of an acetylene lamp the spot could be seen immediately after taking the sample and even estimated with a certain degree of accuracy.26 Further microscopic analysis followed in the laboratory, where silica particles could easily be distinguished from the others. A Dr Rogers had described a method to microscopically distinguish silica from all other particles.26The main disadvantages of the Kotze konimeter were: the necessity for frequently changing slides in a dust-laden atmosphere, the time spent in locating spots under a microscope, and the time spent in cleaning and preparing a large number of slides. A circular konimeter was designed later to eliminate some of the main drawbacks of the Kotze konimeter.26
By 1922 there were a number of other konimeters in use: the Harris double disc konimeter, the multiple jet konimeter, and the Harris automatic recording konimeter. However the Kotze konimeter was used exclusively by the Mines Department.26 Moir claimed that the Kotze konimeter was the only one that didn't leak.27 Sir Robert Kotze had proved that, of the dust in the air that entered it, a konimeter caught over 85 % of up to 500 particles per cm3. These results were confirmed by the Dust Sampling Laboratory of the Chamber of Mines.24
The accepted standard for particle density was that put forward by the Miners' Phthisis Prevention Committee to be 100 particles per cm3 to 1 mg per m3.24 As was pointed out at the time, however, the number of particles will vary with their mean diameter, and this will vary with the type of work. The konimeter gave total particle content, whereas the sugar tube gave insoluble mineral content.
Moir developed a method for removing calcium sulphate from the konimeter spot using HCl.27,28 He calculated that the maximum amount of CaSO4 on a konimeter spot was about 0.00002 gram, which would require only half a milligram of HCl to dissolve it. During discussions on the topic at the Society meeting he criticized a certain Mr Boyd for being an amateur, and suggested that he was using the wrong technique, e.g. exposing the slide to air while taking a microphotograph and thus evaporating the HCl.
A report entitled 'Some Methods and Results in Dust-Sampling on the Witwatersrand' by Dr Mavrogordato, dated April 1923 specifies the particle size of phthisis-producing dust to be below 5 microns in diameter,24 and lamented the absence of dust-measuringmethods which could differentiate accordingto particle size. Dr Moir of the Government laboratories is mentioned in this report as having been an important contributor to the science of dust-sampling.
7. Conclusion
This article shows that James Moir played an important role in the early analysis of mine air in order to ensure mine safety. He was an authority on both the iodine pentoxide and the Orsat methods of gas analysis. He analyzed gases emanating from burning high explosives and determined nitrous fumes in the air. Finally he played a key role in dust-sampling techniques in order to study fine particles that could produce miner's phthisis.
The sampling and analysis of mine air nowadays has developed to a fine art, with automated sampling and instantaneous analysis using all kind of sophisticated sensors. Also dust-sampling techniques have advanced tremendously from those distant days, out of necessity, with modern particle size analyzers able to give particle size distributions at the press of a button, and sensitive analytical instruments analyzing minute traces of particles. Silicosis, the new name for miner's phthisis, is still of great concern and research is continuing to minimize its effect. However it is important to be aware of the contributions made in those early days by people such as James Moir, the Government Analyst.
References
1 P. Loyson, James Moir (1874-1929) pioneering analyst in South Africa in the early 1900s, S. Afr. J. Chem., 2014, 67, 61-66. [ Links ]
2 P. Loyson, The contributions of James Moir to physical chemistry, S. Afr. J. Chem., 2014, 67, 139-142. [ Links ]
3 P. Loyson, James Moir as inorganic chemist, S. Afr. J. Chem., 2014, 67, 167-174. [ Links ]
4 P. Loyson, James Moir as organic chemist, S. Afr. J. Chem., 2014, 67, 124-136. [ Links ]
5 J. Moir, Inaugural address, J. Chem. Metall. Min. Soc. S.A., 1910, 12, 3-10. [ Links ]
6 J. Moir, The vitiation of the air in Transvaal Mines, J. Chem. Metall. Min. Soc. S.A., 1905, 6, 11-17. [ Links ]
7 J. Moir, The vitiation of the air in Transvaal mines: discussion, J. Chem. Metall. Min. Soc. S.A., 1905, 6, 158-161. [ Links ]
8 A.I. Vogel, A Textbook of Quantitative Inorganic Analysis, 3rd edn., Longman, Lowe and Brydone., London, 1972, pp. 1054-1087. [ Links ]
9 W.H. Jollyman, The vitiation of the air in Transvaal mines: discussion, J. Chem. Metall. Min. Soc. S.A., 1905, 6, 114-115. [ Links ]
10 http://en.wikpedia.orgwiki/Orsat_gas_analyser (accessed November 2015).
11 J. Moir, Misleading analyses of air: a correction. J. Chem.Metall. Min. Soc. S.A.,1908, 9, 208. [ Links ]
12 J. Moir, Witwatersrand mine air: recent investigations, J. Chem. Metall. Min. Soc. S.A.,1906, 7, 67-71. [ Links ]
13 T. Lane Carter, Witwatersrand mine air: recent investigations by Moir: discussion, J. Chem. Metall. Min. Soc. S.A., 1906, 7, 120. [ Links ]
14 W.E.C. Mitchell, Witwatersrand mine air: recent investigations by Moir: discussion, J. Chem. Metall. Min. Soc. S.A., 1906, 7, 175-176. [ Links ]
15 W. Bradford, Witwatersrand mine air: recent investigations by Moir: discussion, J. Chem. Metall. Min. Soc. S.A., 1906, 7, 176-181. [ Links ]
16 A. Johnston, Witwatersrand mine air: recent investigations by Moir: discussion, J. Chem. Metall. Min. Soc. S.A. ,1907, 7, 203-206. [ Links ]
17 J. Moir, Witwatersrand Mine air: recent investigations by Moir: reply to discussion, J. Chem. Metall. Min. Soc. S.A., 1907, 7, 248-264. [ Links ]
18 J. Moir, The gases resulting from the use of high explosives by W. Cullen: discussion, J. Chem. Metall. Min. Soc. S.A., 1909,9, 235-236. [ Links ]
19 J. Moir, The gases resulting from the use of high explosives by W. Cullen: discussion, J. Chem. Metall. Min. Soc. S.A., 1909, 9, 306. [ Links ]
20 J. Moir, Analyses of gases from burning nitroglycerine explosives, J. Chem. Metall. Min. Soc. S.A., 1909,10, 210. [ Links ]
21 J. Moir, The determination of nitrous fumes in air with special reference to fuse-igniters, J. S.A. Assoc. Anal. Chem., 1921, 4, 3-8. [ Links ]
22 J.H. Vincent, Aerosol Sampling: Science, Standards, Instrumentation and Applications, John Wiley and Sons, The Attrium, Chichester, England, 2007. [ Links ]
23 C.J. Gray, Some notes on the evolution of the konimeter by Flugge-De-Smidt: discussion, J. Chem. Metall. Min. Soc. S.A., 1923, 24, 164. [ Links ]
24 A. Mavrogardato, Some methods and results in dust-sampling on the Witwatersrand, J. Chem. Metall. Min. Soc. S.A., 1923, 24, 188-191. [ Links ]
25 C.J. Gray, Some methods and results in dust-sampling on the Witwatersrand by Mavrogordato: discussion, J. Chem. Metall. Min. Soc. S.A., 1923, 24, 191. [ Links ]
26 R.A.H. Flugge-De-Smidt, Some notes on the evolution of the konimeter, J. Chem. Metall. Min. Soc. S.A., 1922, 23, 77-82. [ Links ]
27 J. Moir, Some notes on the evolution of the konimeter by Flugge-De-Smidt: discussion, J. Chem. Metall. Min. Soc. S.A., 1923,23, 177. [ Links ]
28 R.A.H. Flugge-De-Smidt, Some notes on the evolution of the konimeter: reply to discussion, J. Chem. Metall. Min. Soc. S.A., 1923, 24, 213-215. [ Links ]
Received 16 November 2015
Revised 4 August 2016
Accepted 15 August 2016
* E-mail: peter.loyson@nmmu.ac.za

