


Services on Demand
Article
 English (pdf)
 Article in xml format
 Article references
Indicators

Related links
-
 Cited by Google
 -
 Similars in Google
Share

 Permalink
South African Journal of Chemistry
On-line version ISSN 1996-840X
Print version ISSN 0379-4350
S.Afr.j.chem. (Online) vol.69 Durban 2016
http://dx.doi.org/10.17159/0379-4350/2016/v69a19
RESEARCH ARTICLE
4-(4'-Nitrobenzylideneimino)-3-methyl-5-mercapto-1, 2, 4-triazole, A new chromogenic reagent for extractive spectrophotometric determination of copper (II) in pharmaceutical and alloy samples
Abdul B. ShaikhI; Umesh B. BaracheI; Mansing A. AnuseII; Shashikant H. GaikwadI, *
IChemistry Research Laboratory, Department of Chemistry, Shri Shivaji Mahavidyalaya, Barshi, Dist. Solapur, (MS) India-413411.
IIAnalytical Chemistry Laboratory, Shivaji University, Kolhapur, (MS) India-416004
ABSTRACT
A simple, selective and rapid extractive spectrophotometric method has been developed for the extraction and determination of Cu (II) with 4-(4'-nitrobenzylidene imino)-3-methyl-5-mercapto-1, 2, 4-triazole, (NBIMMT). The reagent (NBIMMT) instantly forms stable orange-red coloured complex with Cu (II) at room temperature and quantitatively extracted in chloroform at pH 6.2. The extracted species exhibits absorption maximum at 470 nm against reagent blank. The Beer's law was followed in concentration range 4.75 to 16.13 ppm of Cu (II) and optimum concentration range obtained from Ringbom's plot was found to be 5 to 17.5 ppm. The molar absorptivity and Sandell's sensitivity of Cu (II)-NBIMMT in chloroform was 2.825 x 10³ L mol-1 cm-1 and 0.0224µg cm-2, respectively. The optimum extraction conditions were evaluated by studying various parameters such as effect of pH, reagent concentration, solvents, shaking time and foreign ions. The use of masking agents enhances the selectivity of method. The composition of the extracted species was determined by Job's method, mole ratio method and verified by log-log plot. The ratio of Cu (II): NBIMMT was found to be 1:2. The proposed method was successfully applied for the determination of Cu (II) in synthetic mixtures, pharmaceutical samples and alloys.
Keywords: Alloys, Cu (II), extraction, pharmaceuticals, spectrophotometry.
1. Introduction
Copper is widely distributed in nature and it is the third most nutritionally essential trace element in the body after iron and zinc.1 The copper is present in all body tissues; however, the liver, the brain, the heart and the kidney contain copper in maximum amount. Copper is absorbed, transported, distributed, stored and excreted in the body. A complex homeostatic process ensures a constant and sufficient supply of micronutrient and simultaneously avoids excess level.2 As a micronutrient, copper plays a vital role in many biological systems during cell respiration in the blood of invertebrate animals and in the formation of hemocyanine and important respiratory protein is found in the lymph of most animals belonging to the phyla Mucosa and Arthropoda.3 Copper is essential micronutrient which acts as an electron donor or acceptor as its oxidation state fluxes between Cu1 (cuprous) and Cu2 (cupric). Copper is an integral part of antioxidant enzyme, copper-zinc superoxide dismutase (Cu, Zn-SOD) and has a role in iron homeostatic as a co-factor in ceruloplasmin.4 Copper deficiency causes diseases like anemia, low immune function, osteoporosis, wound healing, arthritis and cardiovascular diseases. The surplus intake of copper leads to diarrhoea, stomach upset, nausea and it also causes jaundice, Wilson disease and tissue injury, etc. Dietary deficiency of copper causes variety of clinical disorders which can be cured by copper therapy.5
Due to high electrical conductivity of copper at room temperature, maximum copper production in the world is utilized in electrical industries.6 Copper is also used in pipe making, roof sheeting and bronze paints. Pure copper is extensively used for wires, cables, conducting parts and electrical contacts. The copper alloys find extensive applications in automobile radiators, heat exchangers and home-heating systems. Copper is used as fungicide, insecticide and micronutrient fertilizer in agriculture.
Various analytical techniques such as X-ray Fluorescence Spectroscopy, Atomic Absorption Spectrophotometry and Inductively Coupled Plasma-Mass Spectrometry are used for the determination of copper at micro level. These methods are highly sensitive but not selective, involves a number of steps, preconcentration of sample is costly and experts are required to monitor the instrument. Among these techniques, the spectro-photometric methods are easier to handle, more sensitive, rapid and involve less expensive instrumentation.7-17 Therefore, the extraction and spectrophotometric determination of trace amount of copper is significant. The phenyl thiosemicarbazones are the extensively used sulphur and nitrogen containing chromogenic reagents which form stable complexes with Cu (II) and are extracted into organic solvents. The literature survey reveals that only a few phenyl thiosemicarbazones were employed for extractive determination of Cu (II).18-24 Various spectrophotometric methods for determination of Cu (II) are summarized in the Table 1.
It was revealed from the reported methods that they suffer from disadvantages such as maximum absorbance in UV region and some require surfactant for full colour development, more shaking time, heating of aqueous phase for complexation and synergic extraction.
In the present work, we introduce a new chromogenic reagent 4-(4'-nitrobenzylidene imino)-3-methyl-5-mercapto-1, 2, 4-tria-zole, (NBIMMT) and it is applied to develop a new, rapid, selective, simple and reproducible extractive spectrophotometric method for determination of Cu (II) in pharmaceuticals, synthetic mixtures and alloys. The reagent NBIMMT in chloroform forms orange-red colored complex with Cu (II) and was extracted quantitatively. The method does not require heating of aqueous phase, surfactant, synergists and extracted complex shows absorbance in visible region.
2. Experimental
2.1. Instrumentation
Absorbance measurements were carried out using Elico digital spectrophotometer (model SL-159) with 1 cm matching quartz cells. The pH measurements were made by using Equiptronics digital pH meter (model EQ-615). Analytical reagent grade chemicals and reagents were used throughout the study. Calibrated glassware was used for volumetric measurements. A Chemito 203 atomic absorption spectrophotometer was used for comparative purposes.
2.2. Reagents
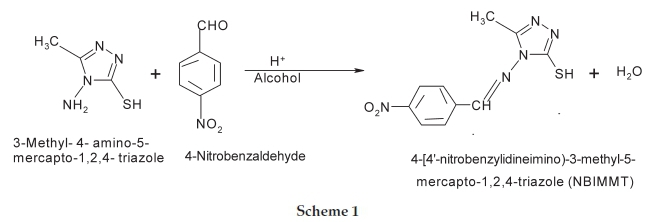
Preparation and characterization of 4-(4'-nitrobenzylideneimino)-3-methyl-5-mercapto-1, 2, 4-triazole (NBIMMT).32,42 The reagent NBIMMT was prepared by simple condensation of 3-methyl-4-amino-5-mercapto-1,2,4-triazole (2.6 g, 0.02 M) with 4-nitrobenzaldehyde (3.029 g, 0.02 M). The mixture of 3-methyl-4-amino-5-mercapto-1,2,4-triazole and 4-nitrobenzaldehyde in 100 mL of ethanol containing 3 drops of glacial acetic acid was refluxed for 3-4 hours. The product was separated and recrystallized from hot ethanol. On cooling faint yellow needles were obtained. The Scheme 1 shows the reaction for preparation of NBIMMT.
By using thin layer chromatography, the purity of the NBIMMT was checked. The melting point of ligand was 224 °C and structure was confirmed by using NMR and IR spectra.
1H NMR (400 MHz, DMSO, Δ ppm): 2.39 (s, 3H, -CH3), 8.17 (d, 2H, Ar-H, J = 8.6 Hz), 8.36 (d, 2H, Ar-H, J = 8.6 Hz), 10.40 (s, 1H, -N=CH), 13.82 (s, 1H, -SH).
IR (KBr, cm-1) 3370 (SH), 1600, 1590 (C=C), 1530, 1340 (NO2).
By dissolving 3.96 g of cupric sulphate pentahydrate (CuSO4.5H2O, Merck) in water, a standard stock solution of Cu (II) was prepared. The stock solution was standardized titrimetrically by known method.43 The working standard of Cu (II) solution was prepared by appropriate dilution of standard stock solution with water.
A reagent solution (0.01 M) was prepared in chloroform by dissolving 0.263 g NBIMMT in 100 mL volumetric flask. The fresh reagent solution was used as and when required. Other standard solutions of foreign ions were prepared by dissolving requisite quantities of their salt in water. Various synthetic mixtures containing Cu (II) were prepared by combining it with commonly associated metal ions in definite composition.44Doubly distilled water was used throughout the experiments. The buffer of pH 6.2 was prepared by mixing appropriate volume of 0.1 M NaOH and 0.1 M KH2PO4 solutions.45
2.3. Recommended Procedure
Sample solution (1 mL) containing 100 ppm of Cu (II) was diluted with phosphate buffer (pH 6.2) up to the mark in 25 mL volumetric flask. The solution was transferred into 125 mL separating funnel, followed by addition of 10 mL 0.01 M NBIMMT in chloroform. The two phases equilibrated for 30 s. The organic extract was collected over anhydrous sodium sulphate (1 g) to remove the traces of water and then it was transferred in 10 mL volumetric flask and diluted up to the mark with chloroform. The absorbance of the extracted complex was measured at 470 nm against reagent blank. The reagent blank was prepared in the same way without taking Cu (II). A calibration curve was prepared and unknown amount of Cu (II) was determined from the calibration curve.
The percentage extraction (% E) and metal distribution ratio (D) were calculated according to Equations (1) and (2), respectively.27
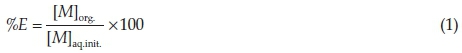
where, [M]aq.init. represents the initial concentration of metal in aqueous phase, [M]aq. and [M]org. are the total concentrations of metal ion in aqueous and organic phases after equilibrium, respectively.
3. Results and Discussion
3.1. Spectral Characteristics
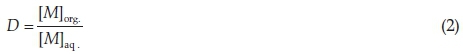
Figure 1 shows absorption spectra of the Cu (II)-NBIMMT complex at pH 6.2 against reagent blank. The absorption measurements were made in the spectral range 360-750 nm. The absorbance curves indicate that the orange-red coloured Cu (II)-NBIMMT complex in organic phase exhibits absorbance maximum at 470 nm. The absorbance of reagent, NBIMMT at 470 nm is negligibly small against chloroform blank, therefore the spectrophotometric measurements were made at 470 nm against the reagent blank and Cu (II) was determined.
3.2. Effect of pH
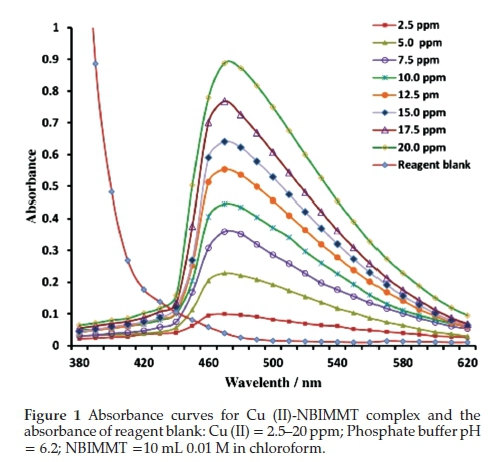
Change in pH affected the complexation of Cu (II)-NBIMMT. Therefore, the absorbance of complex was studied between pH 1 to 10 by using dilute HCl and NaOH solutions. The absorbance values of extracted complex were measured. The maximum absorbance was obtained in the pH range 5.8 to 6.4. Beyond this pH range, the observed absorbance values were lower. pH effect was also studied by using acetate and phosphate buffer solutions. The values of absorbance observed using buffer solutions coincide with the absorbance values obtained by adjusting the pH of aliquots by pH meter. Therefore, phosphate buffer of pH 6.2 was used conveniently for all the subsequent studies which do not require pH adjustment (Fig. 2).
3.3 . Choice of Solvent
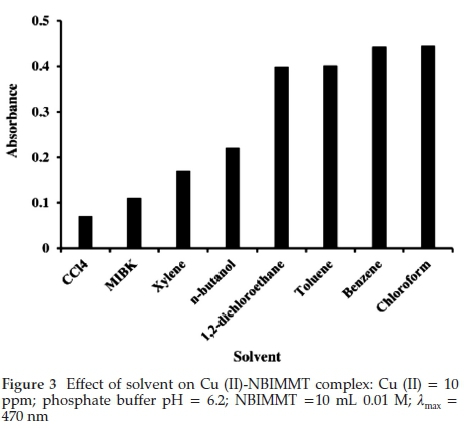
Various organic solvents were tested for the extraction of Cu (II)-NBIMMT complex. It was found that the absorbance values at λmax 470 nm increased in the order: carbon tetrachloride < MIBK < xylene < n-butanol < 1,2,-dichloroethane < toluene < benzene = chloroform (Fig. 3). Benzene is carcinogenic hence chloroform was recommended for further studies.
3.4. Effect of NBIMMT Concentration and Stability of Complex
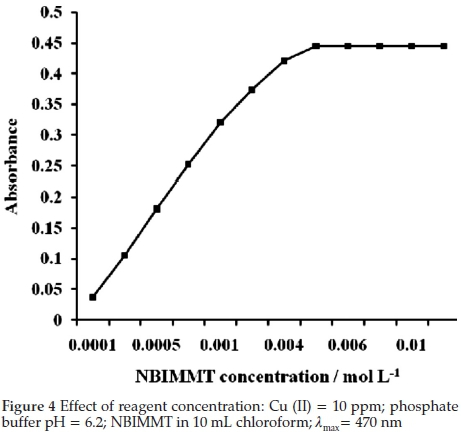
The effect of reagent concentration was investigated by measuring absorbance of solution containing 10 ppm Cu (II) constant and NBIMMT of various concentrations in 10 mL chloroform at 470 nm. It was found that about thirty-two-fold molar excess of reagent over Cu (II) was required to complete the complexation (Fig. 4). It was also found that there was no adverse effect of excess reagent concentration. Therefore sixtyfold excess of reagent was suggested in general procedure to ensure complete complexation of Cu (II). The orange-red colour of Cu (II)-NBIMMT complex was found to be stable for more than 24 hours.
3.5. Effect of Shaking Time
Extraction of Cu (II) by 0.01M NBIMMT in chloroform was found to be very rapid. Percentage of extraction remained unaffected, when the shaking time was varied from 5 s to 30 min. In present investigation 20 s shaking time was recommended for quantitative extraction of Cu (II) in organic phase.
3.6. Validity of Beer's Law, Sensitivity
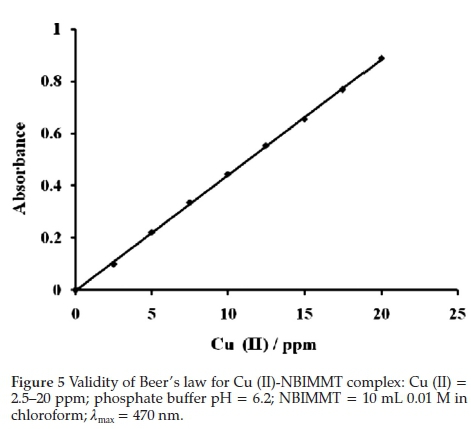
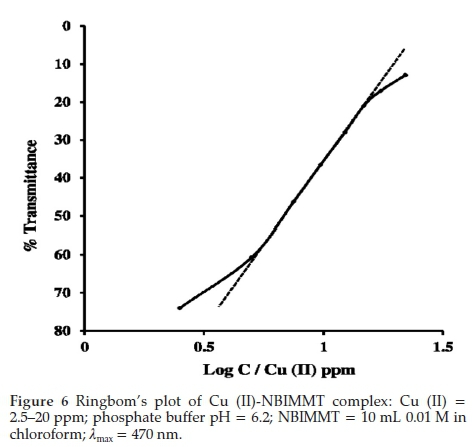
The system adheres to Beer's law in range 4.75 to 16.13 ppm (Fig. 5) of Cu (II) with optimum concentration range 5.0 to 17.5 ppm of the metal as evaluated from a Ringbom's curve, a plot of log [Cu (II)] versus % T (Fig. 6). The plot shows sigmoid curve. The steepest portion of the curve indicates the optimum concentration range where error is minimal.46-47 The molar absorptivity calculated from Beer's law over the range studied was 2.825 x 10³ Lmol-1 cm-1 and Sandell's sensitivity was 0.02247µgcm-2. These molar absorptivity and Sandell's sensitivity values indicate that the method is moderately sensitive.48
3.7. Stoichiometry of the Complex
The stoichiometry of Cu (II)-NBIMMT complex was confirmed by Job's continuous variation, mole ratio and log-log plot methods.
3.7.1. Job's Continuous Variation Method
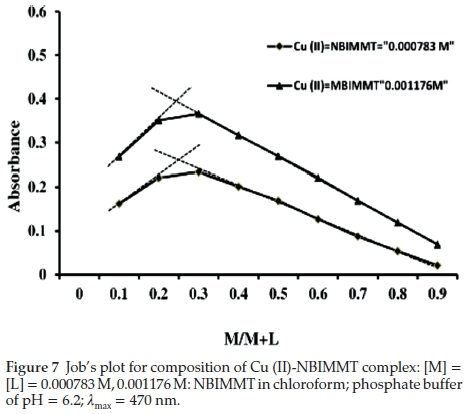
Equimolar solutions of Cu (II) and NBIMMT in chloroform were used. Cu (II) solution was adjusted to pH 6.2 with phosphate buffer solution in a total volume of 25 mL and transferred to 125 mL separating funnel. NBIMMT was mixed in complementary proportions containing varying amount of reagent in 10 mL chloroform. The absorbance of an organic extract was measured at 470 nm against the reagent blank prepared in similar way without taking Cu (II). The plot of absorbance versus mole fraction (M/M+L) indicates that the formation of complex of Cu (II) with NBIMMT in the ratio of 1:2 (Fig. 7).
3.7.2. Mole Ratio Method
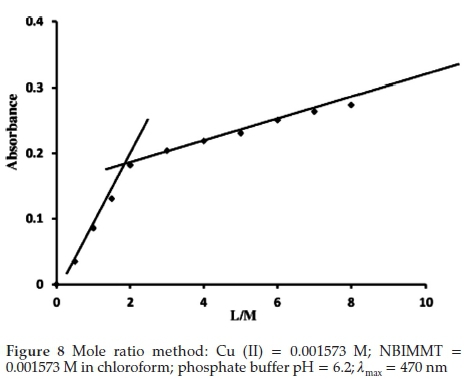
Equimolar solution of Cu (II) and NBIMMT were used. A series of solutions were prepared by keeping the concentration of Cu (II) constant (0.001573 M, 1 mL). The volume of solution was adjusted to 25 mL by phosphate buffer of pH 6.2 and varying amount of reagent in chloroform(0.001573 M, 0.5-5.0 mL) were used for extraction of Cu (II)-NBIMMT complex by adjusting total volume 10 mL with chloroform. The absorbance was measured at 470 nm against corresponding reagent blank. The graph of absorbance versus the molar ratio (L/M) was plotted and a break was observed where the Cu (II) to NBIMMT ratio was 1:2 (Fig. 8).
3.7.3. Log-Log Plot
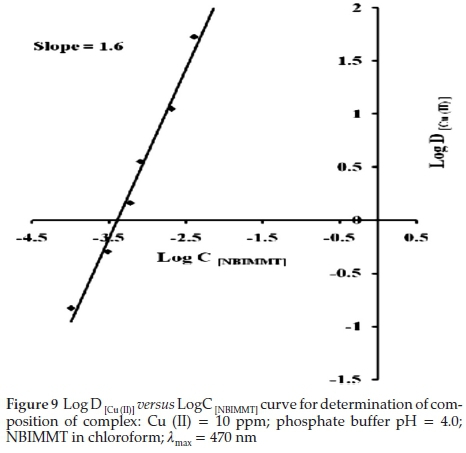
In this method, concentration of Cu (II) was kept constant and buffer of pH 4.0 was added to make volume 25 mL. The NBIMMT of various concentrations was added and finally the volume of organic phase was made up to 10 mL. The absorbance of coloured organic phases was recorded at 470 nm against respective reagent blank. The nature of extracted Cu(II)-NBIMMT complex was asserted by plotting graph of Log D[Cu (II) against Log C(NBIMMT). The plot is linear having slope 1.6 (Fig. 9).
Therefore the composition of extracted species was found to be 1:2, Cu (II): NBIMMT. Scheme 2 shows the probable extracted species of Cu (II) with NBIMMT.
3.8. Effect of Foreign Ions
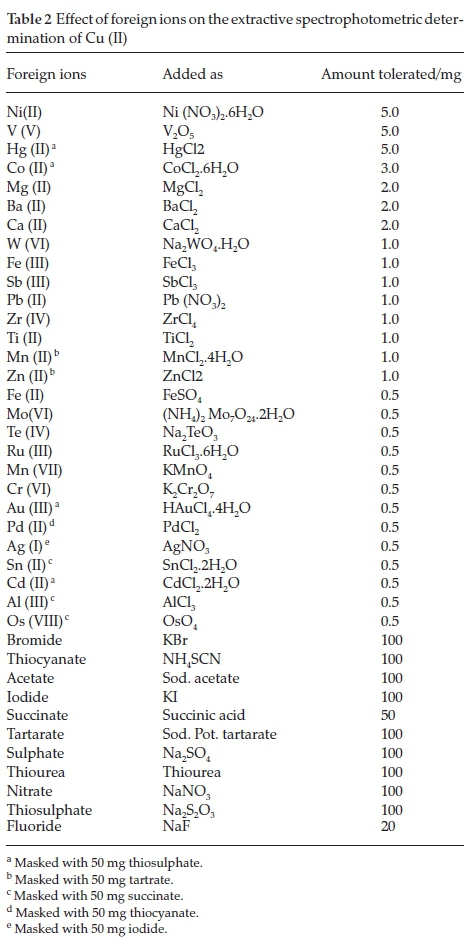
To find selectivity of proposed method, the study was carried out for the determination of Cu (II) in presence of higher concentration of foreign ion. The tolerance limit of the ions shows minimum deviation (±2 %) in absorbance. The interference of various cations was removed by using suitable masking agents (Table 2).
4. Applications
4.1. Determination of Cu (II) in Synthetic Mixtures
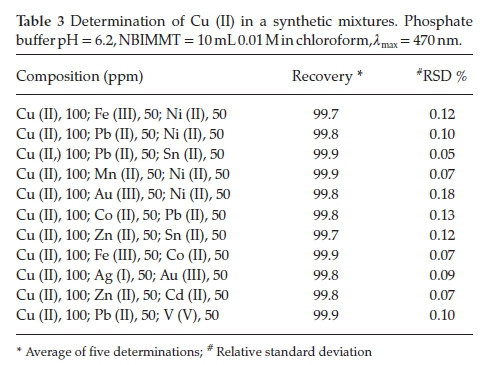
The synthetic mixtures of definite compositions were prepared by taking 100 ppm Cu (II) and associated metal ions of known concentrations.44 The present method was applied for determination of Cu (II) in these synthetic mixtures by employing the recommended procedure. The results obtained were in conformity with amount of Cu (II) taken (Table 3).
4.2. Determination of Cu (II) from Alloys
In order to check the analytical applicability of present method, Cu (II) was determined from standard alloy samples. Alloy 100 mg was dissolved in aquaregia (5 mL), heated on hotplate to almost moist dryness and the nitrate was removed by using concentrated HCl. Residue was filtered and filtrate was made up to 100 mL with doubly distilled water. Suitable aliquot of diluted solutions were taken and determined by present method. The results obtained by present method were consistent with that of AAS (Table 4).
4.3. Determination of Cu (II) from Pharmaceutical Samples
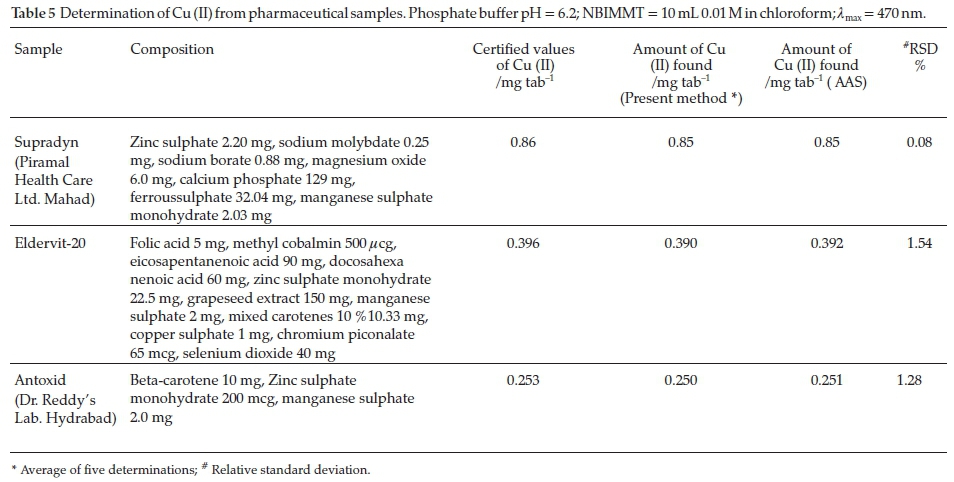
The pharmaceutical samples such as Supradyn, Eldervit 20 and Antoxid were selected for determination of Cu (II). A known weight of sample was dissolved in 5 mL aquaregia and evaporated to moist dryness on hot plate. The residue was dissolved in 2 mL 1:1 HCl and filtered through Whatman filter paper No. 1. The filtrate was diluted with water up to 10 mL in volumetric flask. The analysis of Cu (II) was carried out by recommended procedure and results were compared with result obtained by atomic absorption spectrophotometer (Table 5).
5. Conclusion
The 4-(4'-nitrobezylideneimino)-3-methyl-5-mercapto-1,2,4-triazole was synthesized and an extractive spectrophotometric method was developed for determination of Cu (II) at microgram level by using phosphate buffer solution. Equilibration time is very less; method is rapid, selective, reproducible and reliable. The method is applicable for determination of Cu (II) from synthetic mixtures, pharmaceutical samples and alloys. The results obtained are in good agreement with the certified values and comparable to those obtained by known methods.
The method is eco-friendly, as extraction is carried out in pH medium and has good potential for its use in the determination of Cu (II) after extraction in organic phase at microgram level.
Acknowledgements
One of the authors (A.B.S.) thanks the University Grants Commission, New Delhi, for awarding Fellowship under FIP. The authors are also thankful to Dr. T. N. Lokhande for valuable suggestions regarding this work.
References
1 B. Sarkar, Copper, in Metals in Clinical and Analytical Chemistry, (H.G. Sailer, A. Sigel and H. Sigel, eds.), Marcel Dekker, New York, 1994. [ Links ]
2 I. Scheiber, R. Dringen and J.F.B. Mercer, Effects of Deficiency and Overload, Chapter 11, Copper, Springer, New York, 2013. [ Links ]
3 T.W. Johnson, Mom's low copper could harm newborn, Agric. Res. Mag., 1999, 3, 47. [ Links ]
4 A, Ralf and H.J. McArdle, Copper Metabolism and Requirements in the Pregnant mother, her Fetus and Children, International Copper Association, New York, 2001. [ Links ]
5 P.A. Walravens, Nutritional importance of copper and zinc in neonates and infants, Clin. Chem., 1980, 26,185-189. [ Links ]
6 B.C. Blake-Coleman, Copper Wire and Electrical Conductors - The Shaping of a Technology, Harwood Academic Publishers, Chur, Switzerland, 1992, 13. [ Links ]
7 M. Soylak, Determination of trace amounts of copper in high purity aluminium samples after preconcentration on an activated carbon column, Fresenius Environ. Bull., 1998, 7, 383-385. [ Links ]
8 N. Pourreza and K. Ghanemi, Determination of copper by flame atomic absorption spectrometry after solid-phase extraction, Spectroscopy Lett, 2006, 39,127-134. [ Links ]
9 M.A. Taher, S.Z. Moberakeh and A.R. Mohamdesi, Determination of trace copper by FAAS after solid phase extraction and preconcentration on 2-amberlite XAD-2 loaded with nitroso salt, Turk. J. Chem., 2005, 29, 17-26. [ Links ]
10 V.K. Jain, S.S. Sait, P. Shrivastav and Y.K. Agrawal, Application of chelate forming resin amberlite XAD-2-o-vanillin thiosemicarbazone to the separation and preconcentration of copper (II), zinc (II) and lead (II), Talanta, 1997,45, 397-399. [ Links ]
11 G.L. Moore, Introduction to Inductively Coupled Plasma Atomic Emission Spectrometry, Elsevier, New York, 1989, 3,209-217. [ Links ]
12 Y. Guo, B. Din, Y. Liu, X-Chang S. Meng and J. Liu, Preconcentration and determination of trace elements with 2-aminoacetylthiophenol functionalized Amberlite XAD-2 by inductively coupled plasma-atomic emission spectrometry, Talanta, 2004, 62, 207-213. [ Links ]
13 Y. Liu, P. Liangand L. Guo, Nanometer titanium dioxide immobilized on silica gel as sorbent for preconcentration of metal ions prior to their determination by inductively coupled plasma atomic emission spectrometry, Talanta, 2005, 68, 25-30. [ Links ]
14 A. Ramesh, K. Ramamohan, K. Seshiah and N.D. Kumar, Determination of trace elements by inductively coupled plasma-atomic emission spectrometry (ICP-AES) after preconcentration on a support impregnated with piperidine dithiocarbazone, Anal. Lett., 2001,34(2), 219-229. [ Links ]
15 K.E. Jarvis, A.L. Gray and R.S.Houk, eds., Handbook of Inductively Coupled Plasma Mass Spectrometry, Chapman and Hall, New York, 1992. [ Links ]
16 M. Ince, O. Kaplan and M. Yaman, Solid-phase extraction and pre-concentration of copper in mineral waters with 4-(2-pyridyl-azo) res-orcinol-loaded amberlite XAD-7 and flame atomic absorption spectrometry, Water Environ. Res., 2008, 80 (11), 2104-2110. [ Links ]
17 M.H. Ramsey, A. Argyraki and M. Thompson, Estimation of sampling bias between different sampling protocols on contaminated land, Analyst, 1995, 120, 1353-1356. [ Links ]
18 D.V. Khasnis and V.M. Shinde, Determination of copper in steel, brass, gun metal, nickel, silver and aluminum alloy by extraction with phenanthraquinone mono thiosemicarbazone, J. Indian Chem. Soc., 1982, 59, 812-814. [ Links ]
19 K.N. Thimmaiah, H.S. Sanke Gowda and M. Ahemed, Spectrophotometric determination of palladium (II) and copper (II) with p-anis-aldehyde thiosemicarbazone: analysis of alloys and minerals, Indian J. Chem., 1983, 22, 690-699. [ Links ]
20 V.A. Jadhav and A.G. Vandre, 8-Methoxy-2-chloroquinoline-3-carbaldehyde thiosemi carbazone as an analytical reagent for cobalt (II) and copper (II), J. Indian Chem. Soc., 1995, 72, 747-748. [ Links ]
21 M. Tongsen, L. Menf, H. Cengde, L. Kuaizhi, L. Zhenghao and Z. Paxuesuebav, Spectrophotometric study on copper (II) with pyruv-aldehyde (NN'-dibutyl) bis-thiosemicarbazone, Ziar, Keruebau, 1999, 31, 70-72. [ Links ]
22 P. Lopez-de-Alba, L. Loper-Martiney and J. Amador-Hernandez, Spectrophotometric determination of copper in medical formulation: wheat bran and drinking water, Bol. Soc. Chil. Quim., 1999, 44, 469-477. [ Links ]
23 K. Janardhan Reddy, J. Rajesh Kumar, S. Lakshmi Narayana, C. Ramachandraiah, T. Thriveni and A. Varada Reddy, N-ethyl-3-carbazolecarboxaldehyde-3-thiosemicarbazone: a new extractive spectrophotometric reagent for the determination of copper(II) in environmental and pharmaceutical samples, Environ. Monit. Assess., 2007, 124, 309-320. [ Links ]
24 R.S. Lokhande, S.V. Poman and H.R. Kapadi, Extractive spectrophotometric determination of Cu (II) with 4-chloro-iso-nitrosoaceto-phenone thiosemicarbazone, Asian J. Chem., 2001,13,1222-1224. [ Links ]
25 M. Sayaji Rao, N.B. Prasad, L. Husain and K. Reddy, Spectrophotometric determination of Cu (II) in alloys and edible oils using 2-acetylthiophenone thiosemicarbazone, Indian J. Chem., 2006, 45A, 1659-1662. [ Links ]
26 B.K. Reddy, J.R. Kumar, K.J. Reddy, L.S. Sharma and A.V. Reddy, Rapid and sensitive extractive spectrophotometric determination of copper (II) in pharmaceutical and environmental sample using benzyl-a-monoxime thiosemicarbazone, Anal. Sci.,2003,19,423-28. [ Links ]
27 G.S. Kamble, S.S. Kolekar and M.A. Anuse, Synergistic extraction and spectrophotometric determination of copper (II) using 1-(2',4'- dinitroaminophenyl)-4,4,6-trimethyl-1,4-dihydropyrimidine-2-thiol: analysis of alloys, pharmaceuticals and biological samples, Spectrochim. Acta Part A: Mol. Biomol. Spectrosc., 2011, 78,1455-1466. [ Links ]
28 A. Kumar, P. Sharma, L.K. Chandel, B.K. Kala and S.J. Kunsogi-Mate, Synergistic solvent extraction of copper, cobalt, rhodium and iridium into 1, 2-dichloroethane at trace level by newly synthesized 25,26,27,28, tetrahydroxy-5,11,17,23-tetra-[4-(N-hydroxyl-3-phenyl-prop-2-enimidamido) phenylazo] calyx[4] arene, J. Incl. Phenom. Macrocycl. Chem., 2008, 62,285-292. [ Links ]
29 V. Kaur, A.K. Malik and N. Verma, Derivative spectrophotometric determination of copper and palladium simultaneously by using MDTC as a reagent, Anal. Lett., 2007, 40,2360-2373. [ Links ]
30 P. Tekale, S. Tekale, S. Lingayat and P. Pabrekar, Extractive spectrophotometric determination of copper (II) using 1-phenyl-1-hydra-zonyl-2-oximinopropane-1,2-dione, Science Research Reporter, 2011,2, 83-87. [ Links ]
31 S. Padmanabha and V. Suryanarayana Rao, Spectrophotometric determination of trace copper in industrial water after preconcentration with 4-hydroxybenzaldehyde thiosemicarbazone, Water Research and Development, 2011, 1, 63-66. [ Links ]
32 R.A. Nazareth, B. Narayana and N. Shreekumar, Spectrophotometric determination of copper (II) using 4-vanillideneamino-3-methyl-5- mercapto-1,2,4-triazole, Indian J. Chem, 2001, 40A, 1016-1018. [ Links ]
33 C. Park, H.-S. Kim and K.-W. Cha, Spectrophotometric determination of copper after selective extraction with a-(2-benzimidazolyl)-a', a"-(N-5-nitro-2-pyridylhydrazone) C toluene in presence of Brij 58, Bull. Korean Chem. Soc., 1999, 20, 352-354. [ Links ]
34 S. Meng, Z. Jia, K. Wang, Y. Fan and Y. Guo, Spectrophotometric determination of trace copper (II) in biological samples with 2,4-bis(4-phenylazophenylaminodiazo) phenol, J. Ana. Chem., 2014, 60, 357-361. [ Links ]
35 A.S. Aswar and M.D. Joshi, Solvent extraction and spectrophotometric determination of copper (II) with 2-hydroxy-5-methylaceto-phenoneisonicotinoylhydrazone, Indian J. Chem. Tech., 2008, 15, 79-81. [ Links ]
36 D. Rekha, K. Suvardhan, K. Sureshkumar, P. Reddyprasad, B. Jayraj and P. Chirangeevi, Extractive spectrophotometric determination of copper (II) in water and alloy sample with 3-methoxy-4-hydroxy-benzaldehyde-4-bromophenylhydrazone, J. Serb. Chem. Soc., 2007, 72, 299-310. [ Links ]
37 R.S. Lokhande, R.P. Sonawane and U. Chavan, Development of method for extractive spectrophotometric determination of copper (II) with of hydrazine carboxamide-2-[(-2-hydroxy-l-naphthalenyl) methylene] as an analytical reagent, Int. J. Chem. Sci., 2011,9,503-509. [ Links ]
38 A.R. Kocharekar and N.V Thakkar, Extractive spectrophotometric determination of copper (II) and its applications in pharmaceuticals samples and alloys, J. Sci. Ind. Res., 2004, 63, 283-286. [ Links ]
39 S. K. Jawad, S. K. Ali and S. M. Hammed, Spectrophotometric determination of micro amount of copper (II) in different environmental and vital sample by new organic reagent, Iraqi National J. Chem, 2011, 43, 299-309. [ Links ]
40 R.S. Lokhande, S.P. Janwadkar, S. Kulkarni and S. Patil, Solvent extraction and spectrophotometric determination of copper (II) by using acetophenone-2', 5'- dihydroxy semicarbazone as an analytical reagent, International J. Pharma Biosci., 2011, 2, 315-319. [ Links ]
41 R.A. Nalawade, A.M. Nalawade, G.S. Kamble and M.A. Anuse, Rapid, synergistic extractive spectrophotometric determination of copper(II) by using sensitive chromogenic reagent N",N"'-bis[(E)- (4-fluorophenyl) methylidene]thiocarbonohydrazide, Spectrochim. Acta Part A: Mol. Biomol. Spectrosc, 2015,146, 297-306. [ Links ]
42 K.S. Dhaka, J. Mohan, V.K. Chadha and H.K. Pujari, Heterocyclic systems containing bridge head nitrogen atom: Part XVI - synthesis of s-triazolo [3,4-b][1,3,4] thiadiazines related heterocycles, Indian J. Chem., 1974,12, 288-290. [ Links ]
43 A.I. Vogel, A Text Book of Quantitative Inorganic Analysis, 3rd edn., Longmans, London, 1975. [ Links ]
44 Z. Marczneko, Spectrophotometric Determination of Elements, Ellis Horwood Limited, Chichester, 1976, 125. [ Links ]
45 R.A. Robinson and R.H. Stokes, Electrolyte Solutions, 2nd edn., rev., Butterworth, London, 1988, 371. [ Links ]
46 G.H. Ayers, Evaluation of accuracy in photometric analysis, Anal. Chem., 1949, 21(6), 652-657. [ Links ]
47 A. Ringbom, Z. Anal. Chem., 939, 115, 332. [ Links ]
48 E.B. Sandell, Colorimetric Determination of Traces ofMetals, 3rd edn., Interscience, New York , 1959, 97. [ Links ]
Received 16 May 2016
Revised 21 June 2016
Accepted 29 June 2016
* To whom correspondence should be addressed. E-mail: rasayanshg1@gmail.com

