


Serviços Personalizados
Artigo
 Inglês (pdf)
 Artigo em XML
 Referências do artigo
Indicadores

Links relacionados
-
 Citado por Google
 -
 Similares em Google
Compartilhar

 Permalink
South African Journal of Chemistry
versão On-line ISSN 1996-840X
versão impressa ISSN 0379-4350
S.Afr.j.chem. (Online) vol.69 Durban 2016
http://dx.doi.org/10.17159/0379-4350/2016/v69a13
RESEARCH ARTICLE
Graphene Oxide/zinc oxide nanocomposite: A superior adsorbent for removal of methylene blue - statistical analysis by response surface methodology (RSM)
Seyed A. Hosseini*; Sepideh Mashaykhi; Shabnam Babaei
Department of Applied Chemistry, Faculty of Chemistry, Urmia University, Urmia, Iran
ABSTRACT
Graphene oxide (GO) was synthesized from natural graphite using the Hummers method. Graphene oxide/zinc oxide nano composite were synthesized by mixing of GO and ZnO solutions and then freeze drying. The adsorptive performance of the nano composite was investigated in the removal of methylene blue. The statistical study of the adsorption process was carried out by response surface methodology (RSM). Experimental variables such as sample pH, adsorption time, dye concentration and adsorbent dosage were considered for the optimization process. The process was optimized by response surface methodology (RSM) through Box-Benhken method. The optimum conditions, predicted by the RSM were obtained at pH, contact time, initial dye concentration and adsorbent dosage of 6,8.5 min, 5 ppm, 0.02 g, respectively. The removal of methylene blue under optimum conditions was predicted to be 98.17 % and resulted in 97 % in practice. The Pareto analysis suggested that order of relative importance of the factors were as follows: adsorbent dosage > dye concentration > adsorption time > pH. Under optimized conditions, GO/ZnO nano composite showed a higher capacity than GO, carbon nanotube (CNT), ZnO and ZnO/CNT for adsorption of methylene blue. The study revealed that GO/ZnO could be a promising adsorbent for removal of industrial dyes from wastewaters.
Keywords: Adsorption, graphene oxide, nano composite, methylene blue, response surface design.
1. Introduction
The problem of water pollution becomes even more serious with the development of industry and population expansion.1-3It is estimated that the amount of dyes produced annually exceeds 700 000 tons, and that 10-15% are being discharged through wastewater.4-7 Dyes are widely used in textile, paper, rubber, plastic, leather, cosmetic, pharmaceutical and food industries. Most of the used dyes are toxic, some of them are even carcinogenic, and so their discharge into the water could cause environmental pollution.8 Physical, chemical and biological processes are the principle methods used in treating dyes in effluent wastewater.9 However, these technologies generally have the same disadvantages towards dye removal, such as expense, secondary pollution, unrecoverable and less adaptable to a wide range of dye wastewater.10-11 Adsorption is the most versatile and widely used method of water treatment because of its low cost, ease of operation and relative efficiency in treatment.12 Up to now, various adsorbents have been tested for removal of methylene blue by researchers; such as, bentonite,13cedar sawdust, rushed brick,14 Platanus orientalis leaf powder15, Date palm leaves,16 spinel magnesium alumínate nanoparticles17and many other materials. Graphene, a new class of carbon nanomaterial, has recently sparked much interest due to its unique strict two-dimensional nanostructure.18-20 Graphene possesses extraordinary electronic, thermal and mechanical properties, such as ultrahigh specific surface area, good thermal conductivity, fast mobility of charge carriers, high values of Young's modulus and fracture strength.21-24 Graphene oxide (GO), a precursor of chemically converted graphene, has many oxygen atoms in the basal plane and the edge of the sheets in the form of epoxy, hydroxyl, and carboxyl groups.25 These oxygen groups can bind metal ions,26-27 and positively charged organic compounds,28 through coordination and electrostatic interaction. ZnO semiconductor with different morphologies has several favourable properties, including good transparency, high electron mobility, wide band gap, and room-temperature luminescence. Loading of the ZnO nanoparticles on the graphene oxide sheets can consequently provide a higher available surface area and enhancement of adsorption capacity.
The aim of this work was to synthesize and study the adsorptive performance of GO/ZnO in the removal of dye from water. In order to save time and costs with the study, the minimum number of experiments were designed by response surface methodology (RSM). A mathematical model was developed and the optimum conditions were predicted. Under optimum conditions, the performance of GO/ZnO nano composite was tested and compared with that of GO, carbon nanotube (CNT), ZnO and ZnO/CNT in the removal of methylene blue (MB) from wastewaters.
2. Experimental
2.1. Materials
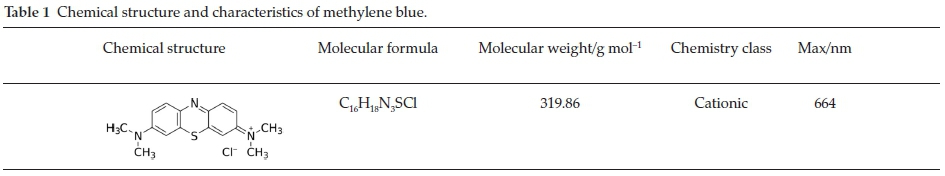
The natural mineral graphite powder was obtained from the brain of old batteries. All the materials were purchased from the Merck Company (Germany). The chemical structure and characteristics of methylene blue (MB) are given in Table 1.
2.2. Preparation of Graphene Oxide (GO)
The graphene oxide was prepared from graphite powder by a modified Hummers method.29 Briefly, 1 g graphite powder, 6 g KMnO4 and 1 g NaNO3 were mixed with 46 mL concentrated sulphuric acid (97%). The mixture was stirred for 3 h within an ice-bath. After having been removed from the ice-bath, 280 mL deionized water was added and stirred at room temperature for 2 h. Then the sample was stirred at 89 °C for 2 h, followed by 6 mL H2O2 which was added dropwise until the colour of the solution turned from dark brown to yellow. The solid product was separated by centrifugation and washed several times with distilled water until the pH of the solution became neutral. The residue was dried at 60 °C overnight. The resulting graphene oxide was suspended in water and exfoliated through sonication for3hto obtain GO nano sheets.
2.3. Preparation of Zinc Oxide
For the ZnO, 2g ZnSO4 was dissolved in sodium hydroxide solution and stirred for 12 h. The obtained white product was washed several times with distilled water and was collected by filtration. Finally, it was dried under vacuum to get zinc nano oxide.
2.4. Preparation of GO/ZnO Hybrid
For the composite, 5g graphene oxide was dissolved in 20 mL ethanol and kept under ultrasonication for 2 h; it was denoted as GO solution. The as-prepared ZnO nanoparticles (5 g) were dissolved into the mixture of 18 mL methanol and 2mL chloroform and kept under ultrasonication for 2 h; it was denoted as ZnO solution. The GO solution and the ZnO solution were mixed and kept under constant stirring for 24 h. The collected precipitate was obtained by centrifugation and washed with methanol several times. The product was freeze-dried overnight and denoted as GO-ZnO nano composites. The ZnO/CNT composite was synthesized in the same way in order to compare its adsorption performs with GO/ZnO composite.
2.5. Characterization of the Nano Composite
The structure and crystal phase of adsorbent was investigated by a powder X-ray diffraction system (XRD6000, Shimadzu) equipped with Cu Ka radiation with a 2 θ scanning range of 5-40°. Fourier transform infrared (FT-IR) spectra of samples were recorded by Bruker 27 in the range 400-4000 cm-1. The morphology of the adsorbents was investigated with a scanning electron microscope (model EQ-C1-1).
2.6. Determination of pHPZC of the Adsorbents
The point of zero charge (pHPZC values) is the point at which the net charge on the adsorbent surface is zero. The pHPZC values of GO and GO/ZnO was determined by pH drift method.30Briefly, several solutions containing 0.01 M NaCl were supplied. The initial pH (pHi) of the solutions was adjusted to a value between 2 and 11 using 0.1 M HCl or 0.1 M NaOH. 0.02 g adsorbent was added to the solution. The electrolyte solution with adsorbent was equilibrated for 24 h. After equilibrium, the final pH (pHf) was recorded. The pHf was plotted against the initial pH (pHi) values. The pH at which pHi crossovered the (pHf) was referred to as the pHPZC. The pHPZC of GO and GO/ZnO was determined 7.5 and 8.2, respectively.
2.7. Adsorption Experiments
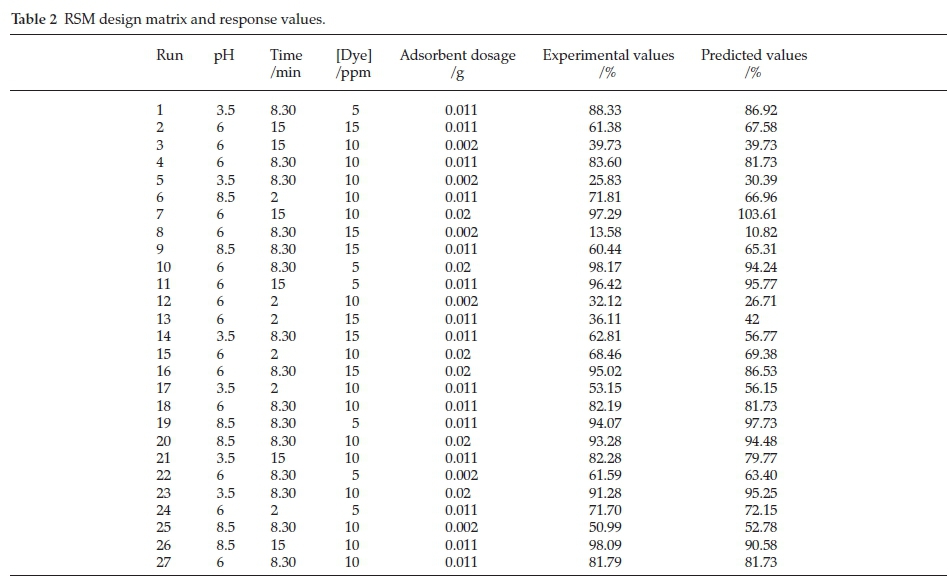
A stock solution of dye was prepared by dissolving 0.03 g of MB in distilled water to obtain a concentration of 30 mg L-1 (main solution). Different concentrations of MB were obtained by diluting the main solution. The pH of the dye solution was adjusted with 0.1 M HCl or 0.1 M NaOH. Experiments were performed according to RSM design matrix given in Table 2. The range of pH, time, dye concentration and adsorbent dosage were 3.5-8.5, 2-15 min, 5-15 ppm and 0.002-0.02 g, respectively. Dye concentration was determined using UV-Vis spectrophotometer (Shimadzu UV 1600, Japan) at λmax = 665 nm. In the range of dye concentration, there was a linear relationship between absorbance and concentrations according to Beer-Lambert law. The response (MB removal percentage) was expressed as percentage of MB removal calculated by Equation 1:

where A0 and A are the absorbencies of MB in the absence and presence of the adsorbent, respectively.
2.8. Experimental Design, Statistical Analysis and Optimization by RSM
Response surface methodology (RSM) is essentially a particular set of mathematical and statistical tools for designing experiments, building models, evaluating the effects of the operating conditions, and most importantly, for researching the optimal values of factor to predict target responses.31-32 We considered the most important factors in the removal of MB including: pH (X1), contact time (X2), initial dye concentration (X3) and adsorbent dosage (X4) to investigate their effect on dye removal. Tewntyseven-experiments were designed and optimized based on Box-Behnken method of RSM. Each experiment was tested twice and the average response was considered. The removal percentage for each experiment was reported with a precision of ±1 %. The following second-order polynomial response model was used to explain the behaviour of the system (Equation 2).
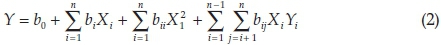
where Y is the dye removal, X and X¡ are coded factors (terms of the model), and B0, B0, Bi and Bi¡ represent, the constant term, linear, quadratic and interaction effect. Results were interpreted by the analysis of variance (ANOVA) using Minitab version 16 software.
3. Results and Discussion
3.1. Characterization of the Hybrids
The FTIR spectra of GO, ZnO, and GO/ZnO are shown in Fig. 1a. In the FTIR spectrum of GO, the peaks at 1054.10 and 1315.99 cm-1 are assigned to the C-O stretching vibration and C-O-H deformation vibration, respectively. The peaks at 1627.10 and 3430.85 cm-1 correspond to the stretching vibrations of C=O and hydroxyl groups, respectively.

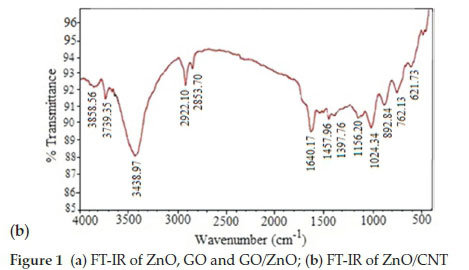
In the spectrum of ZnO, the strong peak at 425.93 cm-1 is due to stretching vibrations of Zn-O. The peak around 3432.49 cm-1corresponds to stretching vibrations of hydroxyl groups. The FT-IR spectrum of the GO/ZnO shows all of peaks appeared at the spectra of ZnO and GO, just the intensity of peaks was relatively low. The results are in agreement with the results of Wang et al.33
Figure 1b shows the FTIR spectrum of ZnO/CNT. The peaks at 1457 and 1640.37 cm-1 are attributed to CNT vibrational modes. The peaks between 2851-2925 cm-1 are consistent with C-Hx stretching vibrations of chemisorbed hydrogen of various types presents in all carbon films. The peaks around 3438.97 cm-1 correspond to O-H groups.
The XRD patterns of ZnO are shown in Fig. 2a. The diffraction peaks located at 31.84 °,34.52 °and36.33 ° have been indexed as a hexagonal Wurtzite phase of ZnO according to the standardized JPCDS card number: 36-1451.34,35In the XRD pattern of GO/ZnO, a relatively low peak at 2 θ = 10.5 corresponds to the diffraction of the (0 0 2) graphite oxide plane. The peaks of ZnO appear in the XRD pattern of GO/ZnO. The average crystallite size of ZnO and GO/ZnO samples were calculated from the Debye-Scherrer equation (Equation 3).
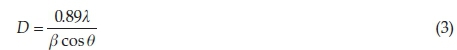
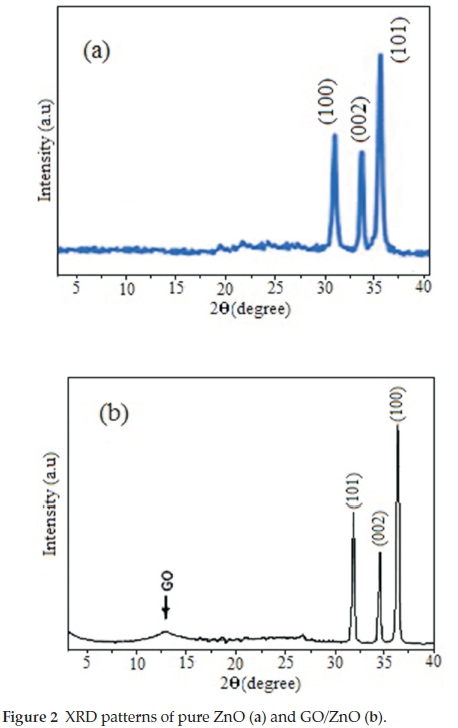
where λ = 0.15418 nm, β is the full width at half-maximum (FWHM) of the sharpest diffraction peak and θ is the diffraction angle.
According to Scherrer equation the mean crystallite size of ZnO and GO/ZnO were estimated to be 50 and 70 nm, respectively.
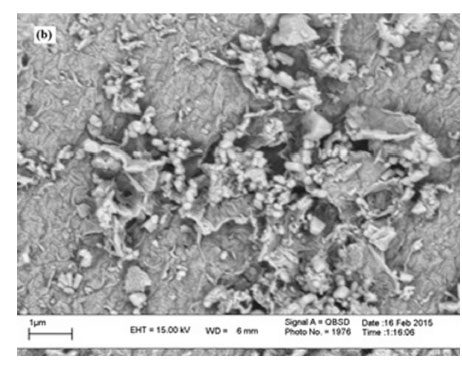
The morphology and particle size of ZnO, GO, and GO/ZnO nano composite were investigated by SEM. Fig. 3 shows the SEM images of ZnO, GO, and ZnO/GO samples. Fig. 3a shows the SEM image of ZnO. The ZnO sample comprised of particles in the range 30-90 nm, whereas Fig. 3b shows the sandwich-structure stacks of GO. In Fig. 3c, the white particles dispersed on the GO sheets are ascribed to ZnO nanoparticles. The images indicate the nanostructure of the ZnO, GO, and GO/ZnO composite.


3.2. Results of Response Surface Methodology (RSM)
Response surface methodology (RSM) was applied to design the experiment and statistical analysis of the process. Following quadratic response surface model (Equation 4), the best fit of the experimental results among different evaluated models was as follows:
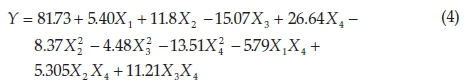
Among terms of singular factor, X1, X2 and X4 have a synergistic effect on the response, whereas X3 (MB concentration) has an antagonistic effect on the response, meaning that an increase in MB concentration decreases the removal percentage of methy-lene blue. Among singular terms, X1 (pH) with the smallest coefficient has the minimum impact on the response (methylene blue removal).
The results of analysis of variance (ANOVA) for the model are presented in Table 3. ANOVA is a statistical technique that subdivides the total variation in a set of data into component parts associated with specific sources of variation for the purpose of testing hypotheses on the parameters of the model.36
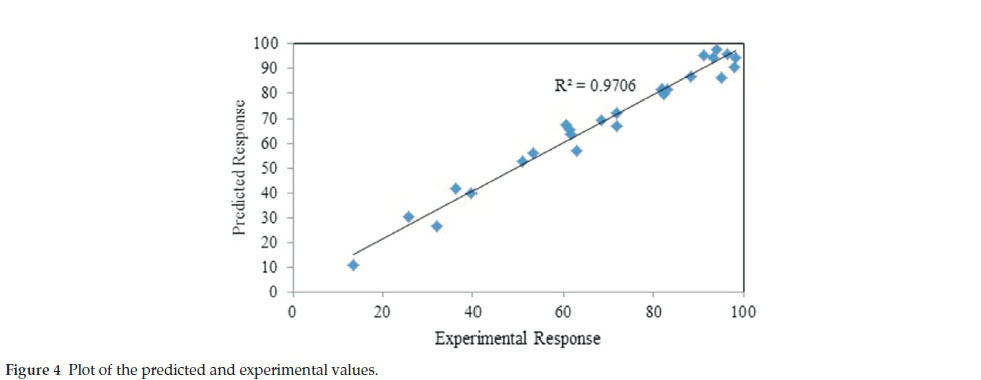
The Fisher's F-test was used to verify the statistical significance of the model. It is concluded from the results of F-test that the established model is statistically significant (i.e. ratio of mean square regression to mean square residual) with F-value of 52.89. In addition, the significance of the model was evaluated by the determination coefficient (R2). The R2value means an acceptable agreement between the experimental and predicted values of the fitted data. Fig. 4 shows the predicted response by the model versus experimental responses. Close fit of the data and high value of the determination coefficient (R2= 0.97) shows the validity of the model. This means that model predicted values are in good agreement with the experimental values. The predicted determination coefficient of the model (R2pred) was 0.8953, indicating that 89.53 % of the response variation is attributed to the four independent factors. The adjusted R2(R2adj) = 0.9523 was also of statistical significance and dictates the correlation applicability of the model. The difference of R2adj and R2pred value was less than 0.2 (20 %), indicating the significance of the model.
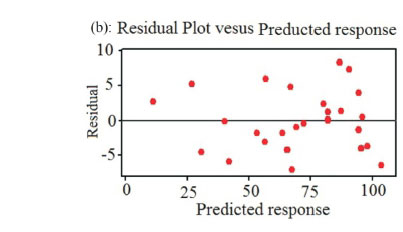
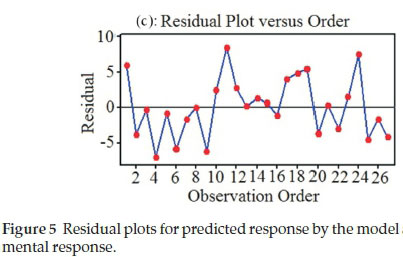
Moreover, the adequacy and the significance of the model were evaluated by the residuals (difference between the experimental and the predicted response value). The residuals can be considered as the variation unexplained by the fitted model and it is expected that they have a normal distribution.37 Normal probability plots are a suitable graphical method for judging the normality of the residuals. The Normal probability plot in Fig. 5a shows the values of predicted response against the residual values, given by a normal distribution. A graph of the residual versus the predicted response shows random behaviour without a tendency towards residuals for experimental values (Fig. 5b). Fig. 5c shows the plot of residuals versus order of data and shows random scattering and consequently the residual plots prove the adequacy of the model.

On the other hand, the significance of the regression coefficient of the model terms was investigated by P-value. In addition, the Student's t-test was used to determine the significance of the regression coefficient of the model terms, testing whether the true parameter is zero or not. The P-value and t-value of each term of the model are presented in Table 4.
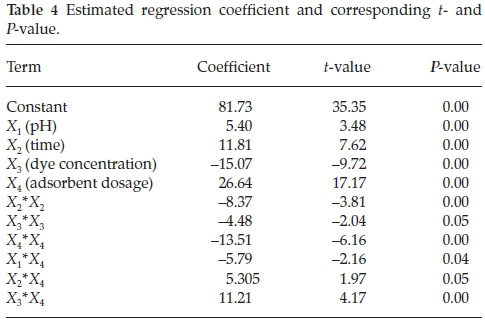
Conventionally, the larger the t-value and smaller the P-value (P < 0.05) indicate the higher significance of the corresponding coefficient. The coefficients of the linear effect of time, dye concentration, adsorbent dosage with P-value of zero were significant. In the case of quadratic effects of (Xi2), all effects except those of pH-pH (X12) were significant at the confidence level of 95 % and the term X12 was removed from the model. In the case of binary terms, the interactions of X1X4, X2X4 and X3X4 were significant at a confidence level of 95 % (P-value < 0.05), just the interaction of pH and dye concentration (X1X3) was not significant and thus the term X1X3 was removed from the model.
Pareto analysis is applied to determine the relative importance of each term of the model. Pareto analysis calculates the percentage effect of each term on the response, according to Equation 5 and gives some information on the interpretation of the results.
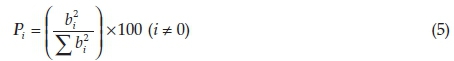
The results of Pareto analysis are shown in Fig. 6. The results suggest that the adsorbent dosage (X4) with relative importance of 42.48 % has the most important impact amongst the various factors in the removal of methylene blue. The Pareto analysis suggested that the order of relative importance of the factors is as follows: adsorbent dosage > dye concentration > adsorption time > pH.
According to the above regression model equation and Pareto chart (Fig. 6), it was found that the adsorbent dosage and concentration of methylene blue have maximum impact on the response (MB removal percentage) whereas the pH exhibit the least impact on the response. It is pointed out that the concentration has a negative effect on the response. Deng and co-workers reported that the pH of aqueous solutions had little effect on the adsorption capacity of sulphuric acid treated cotton stalk (SCS) in the removal of methylene blue.38
The three-dimensional (3D) response surface plots as presented in Fig. 7 are graphical representations of the established regression equation (Equation 4). These are used to achieve a better understanding of the interactions between factors, and to determine the optimum level of each factor for maximum removal of methylene blue. The three-dimensional (3D) surface plots of the dependent factor (response of the model) as a function of two independent factors, and maintaining all other factors at fixed levels can provide information on their relationships. This can be helpful in understanding both the main and the other interaction effects of these two independent factors.38-39 2D contour plot is the projection of 3D surface plot on a two-dimensional page. Fig. 7 illustrates 3D surface and 2D contour plots for the combined interaction of adsorbent dosage and dye concentration on the adsorption capacity of methylene blue. From this figure, it is evident that MB concentration has positive synergistic effects when coupled with adsorbent dosage (X4). This was evidenced from the positive terms in Equation 4 and also the convex response surfaces that indicate well-defined optimum variables. However, it must be emphasized that the singular effect of MB concentration on its removal percentage has a negative impact as observed in Equation 4. The increase of the adsorbent dosage and the decrease of dye concentration lead to a decrease in the formation of a boundary layer around the adsorbent, so the rate of dye removal increases rapidly. The statistical results are consistent with the literature and demonstrate the ability of the response surface methodology at prediction of the experimental results.40,41
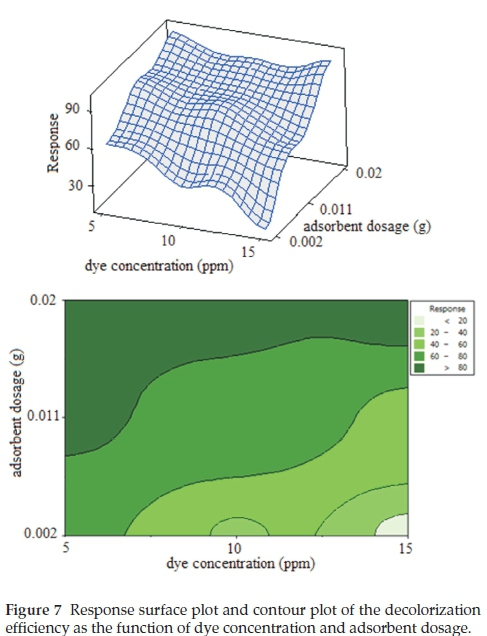
Figure 8 shows the surface and contour plots for the combined interaction of pH and adsorbent dosage on the MB removal percentage. The contour and surface plots in Fig. 8 indicate that at both lower and higher pH, relatively high removal of MB was achieved. According to Equation 4, the combined interaction of pH and adsorbent dosage (X1X4) has a negative impact on MB removal. So we expected the decrease of the MB removal percentage at higher pH. Because the surface area of the adsorbent should be more protonated and competitive adsorption occurred between H+ and MB anions and OH- towards the fixation sites. Therefore, H+ ions react with anionic functional groups on the surface of the adsorbent and results in restriction of the number of binding sites favourable for the removal of MB. But this expectation did not occur. The higher removal percentage of methylene blue at both low and high pH can be explained by pHPZC of the GO/ZnO nano composite. The pHPZC of the GO/ZnO was determined to be 8.2.
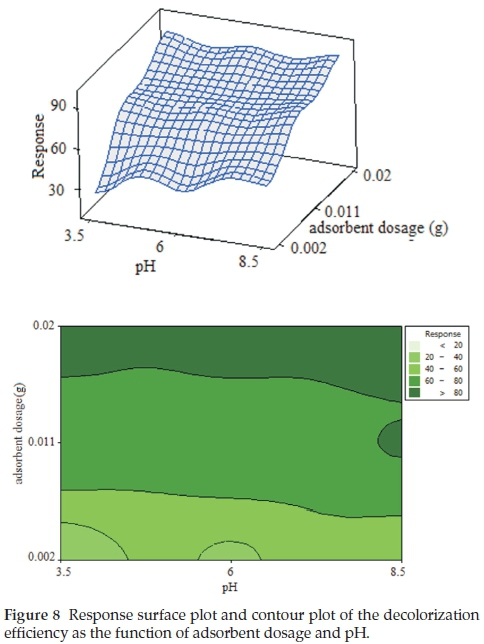
According to Al-Degs et al.42,pHPZC can be used as an index of the ability of the surface to become either positively or negatively charged. At pH below pHPZC, the adsorbent has a positively charged surface and at pH above pHPZC, the surface is negative. Thus at the pH range under study, the surface charge of GO/ZnO nano composite is positive and the electrostatic attraction between the positive charge of the GO/ZnO nano composite and negative charge of methylene blue led to an increase in the adsorption rate of the methylene blue. The result is in agreement with that reported in the literature.43, 44
Furthermore, the optimal conditions for the process of removal of methylene blue by GO/ZnO nanocomposite were predicted by RSM. The optimum conditions of the adsorption process were predicted to be at pH, time, dye concentration and adsorbent dosage of 6, 8.5 min, 5 ppm and 0.02 g, respectively. Under these conditions, the removal percentage of methylene blue was predicted to be 98.17 %. The running of the process, under predicted optimum conditions resulted in 97 % removal of methylene blue. Using the same conditions, the removal percentage of methylene blue by ZnO, GO, pure CNT, ZnO/CNT and GO/ZnO nano composite was 5.165, 78.82, 95.42, 17.13 and 97 %, respectively. The study revealed higher adsorptive performance of GO/ZnO nano composite.
4. Conclusions
The GO/ZnO was successfully synthesized and its performance in the adsorption of methylene blue was studied. Response surface methodology allowed for the study of the adsorption process with a minimum number of experiments and savings on the overall cost and time. In addition, it provided for the development of a model for the process in order to predict the removal percentage of methylene blue at different values of pH, time, adsorbent dosage and dye concentration. Analysis of variance of the model showed a high value for the determination coefficient (R2 = 0.97), thus ensuring a satisfactory adjustment of the second-order regression model with the experimental data. The Pareto analysis suggested that order of relative importance of the factors were as follows: adsorbent dosage > dye concentration > adsorption time > pH. Under optimum conditions, GO/ZnO nano composite exhibited superior adsorption activity, which was even better than CNT and ZnO/CNT. The study revealed that GO/ZnO nano composite could be a promising adsorbent for removal of industrial dyes from wastewaters.
Acknowledgements
The authors thank Iran Nanotechnology Initiative Council for the financial and other supports.
References
1 S. Papeo, N. Koprivanac, A.L.Boize and A. M, Metes, Removal of some reactive dyes from synthetic wastewater by combined Al (III) coagulation/carbon adsorption process, Dyes Pigm., 2004,62,291-298 [ Links ]
2 G. Mezohegyi, F.P. Zee, J. Font, A. Fortuny and A. Fabregat, Towards advanced aqueous dye removal processes: a short review on the versatile role of activated carbon, Environ. Manage., 2012,102, 148-164 [ Links ]
3 A.A. Jalil, S. Triwahyono, S.H. Adam, N.D. Rahim, M.A.A. Aziz, N.H.H. Hairom, N.A.M. Razali, M.A.Z. Abidin and M.K.A. Mohamadiah, Adsorption of methyl orange from aqueous solution onto calcined Lapindo volcanic mud, J. Hazard. Mater., 2010, 181, 755-762 [ Links ]
4 K. Hunger, Industrial Dyes: Chemistry, Properties, Applications, Wiley-VCH, Weinheim, Germany, 2003 [ Links ]
5 R.M. Christie, Environmental Aspects of Textile Dyeing, Woodhead Publishing, Great Abington, Cambridge, England, 2007 [ Links ]
6 F. I. Hai, K. Yamamoto and K. Fukushi, Hybrid treatment systems for dye wastewater. Crit. Rev. Environ. Sci. Technol., 2007, 37, 315-377 [ Links ]
7 Q. Husain, Potential applications of the oxidoreductive enzymes in the decolorization and detoxification of textile and other synthetic dyes from polluted water: a review. Crit. Rev. Biotechnol., 2006, 26, 201-221 [ Links ]
8 R.D. Ambashta and M. Sillanpaa, Water purification using magnetic assistance: a review, J. Hazard. Mater., 2010, 180, 38-49 [ Links ]
9 B.E. Barragán, C. Costa and M.C. Marquez, Biodegradation of azo dyes by bacteria inoculated on solid media. Dyes Pigments, 2007, 75, 73-81 [ Links ]
10 N. Sakkayawong P. Thiravetyan and W. Nakbanpote, Adsorption mechanism of synthetic reactive dye wastewater by chitosan, J. Colloid Interf. Sci., 2005, 286, 36-42 [ Links ]
11 M. Amini, M. Arami, N.M. Mahmoodi and A. Akbari, Dye removal from colored textile wastewater using acrylic grafted nanomembrane, Desalination, 2011, 267, 107-113 [ Links ]
12 F. Najafi, M. Norouzi, K. Zare and A. Fakhri, Removal of ethidium bromide by carbon nanotube in aqueous solution: isotherms, equilibrium mechanism studies, and its comparison with nanoscale of zero valent iron as adsorbent, J. Nanostruct. Chem., 2013, 3, 60-66 [ Links ]
13 M. Ozacar and I.A. Sengil, A two stage batch adsorber design for methylene blue removal to minimize contact time, J. Environ. Manage., 2006, 80, 372-379 [ Links ]
14 O. Hamdaoui, Batch study of liquid-phase adsorption of methylene blue using cedar sawdust and crushed brick, J. Hazard Mater., 2006, 135, 264-273 [ Links ]
15 M. Peydayesh and A. Rahbar-Kelishami, Adsorption of methylene blue onto Platanus orientalis leaf powder: kinetic, equilibrium and thermodynamic studies, J. Ind. Eng. Chem., 2015, 21 ,1014-1019 [ Links ]
16 M. Gouamid, M.R. Ouahrani and M.B. Bensaci, Adsorption equilibrium, kinetics and thermodynamics of methylene blue from aqueous solutions using date palm leaves, Eng. Proceed., 2013, 36, 898-907 [ Links ]
17 B. Ismail, S.T. Hussain and S. Akram, Adsorption of methylene blue onto spinel magnesium aluminate nanoparticles: adsorption isotherms, kinetic and thermodynamic studies, Chem. Eng. J., 2013, 219, 395-402 [ Links ]
18 K.S. Novoselov, A.K. Geim, S.V. Morozov, D. Jiang, Y. Zhang, S.V Dubonos, I.V. Grigorieva and A.A. Firsov, Electric field effect in atomically thin carbon films, Sci, 2004, 306, 666-669 [ Links ]
19 A.K. Geim and K.S. Novoselov, The rise of graphene, Nat. Mater, 2007, 6,183-191 [ Links ]
20 K. Geim, Graphene: status and prospects, Sci., 2009, 324, 1530-1534 [ Links ]
21 M.D. Stoller, S.J. Park, Y.W. Zhu, J.H. An and R.S. Ruoff, Graphene-based ultracapacitors, Nano Lett.. 2008, 8, 3498-3502 [ Links ]
22 C. Lee, X.D. Wei, J.W. Kysar and J. Hone, Measurement of the elastic properties and intrinsic strength of monolayer graphene, Sci, 2008, 321, 385-388 [ Links ]
23 A.A. Balandin, S. Ghosh, W.Z. Bao, I. Calizo, D. Teweldebrhan, F. Miao and C.N. Lau, Superior thermal conductivity of single-layer graphene, Nano Lett., 2008, 8, 902-907 [ Links ]
24 K.I. Bolotin, K.J. Sikes, Z. Jiang, M. Klima, G. Fudenberg, J. Hone, P. Kim and H.L. Stormer, Ultrahigh electron mobility in suspended graphene, Solid State Commun., 2008, 146, 351-355 [ Links ]
25 D. R. Dreyer, S. Park, C. W. Bielawski and R. S. Ruoff, The chemistry of graphene oxide, Chem. Soc. Rev., 2010, 39, 228-240 [ Links ]
26 S. Park, K.S. Lee, G. Bozoklu, W. Cai, S. T. Nguyen and R. S. Ruoff, Graphene oxide papers modified by divalent ions-enhancing mechanical properties via chemical cross-linking, ACS Nano, 2008, 2, 572-578 [ Links ]
27 H. Bai, X. L. Wang, C. Li and G.Q. Shi, On the gelation of graphene oxide, J. Phys. Chem. C, 2011,115, 5545-5551 [ Links ]
28 Y. X. Xu, Q. Wu, Y. Q. Sun, H. Bai and G.Q. Shi, Three-dimensional self-assembly of graphene oxide and DNA into multifunctional hydrogels, ACS Nano, 2010, 4, 7358-7362 [ Links ]
29 W. Hummers and R. Offeman, Preparation of graphitic oxide, J. Am. Chem. Soc., 1958, 80, 1339-1339. [ Links ]
30 M.M. Rahman, M. Adil, A.M. Yusof, Y.B. Kamaruzzaman and R.H. Ansary, Removal of heavy metal ions with acid activated carbons derived from oil palm and coconut shells, Mater., 2014, 7, 3634-3650 [ Links ]
31 J. Virkutyte, E. Rokhina and V. Jegatheesan, Optimization of electro-Fenton denitrification of a model wastewater using a response surface methodology, Bioresour. Technol., 2010, 101, 1440-1446 [ Links ]
32 M. Zabeti, W.M.A.W. Daud and M.K. Aroua, Optimization of the activity of CaO/Al2O3 catalyst for biodiesel production using response surface methodology, Appl. Catal. A, 2009, 366, 154-159 [ Links ]
33 Y. Wang, J. Liu, L. Liu and D. Sun, Enhancing stability and photocatalytic activity of ZnO nanoparticles by surface modification of graphene oxide, J. Nanosci. Nanotechnol., 2012, 12, 1-7. [ Links ]
34 C. He, T. Sasaki, Y. Shimizu and N. Koshizaki, Synthesis of ZnO nanoparticles using nanosecond pulsed laser ablation in aqueous media and their self-assembly towards spindle-like ZnO aggregates, Appl. Surf. Sci., 2008, 254, 2196-2202 [ Links ]
35 C. Chen, B. Yu, P Liu, J Liu and L. Wang, Investigation of nano-sized ZnO particles fabricated by various synthesis routes, J. Ceram. Process. Res. 2011, 12, 420-25. [ Links ]
36 A.R. Khataee, M. Safarpour, A. Naseri and M. Zarei, Photoelectro-Fenton/nanophotocatalysis decolorization of three textile dyes mixture: response surface modeling and multivariate calibration procedure for simultaneous determination, J. Electroanal. Chem., 2012, 672, 53-62 [ Links ]
37 D. Wu, J. Zhou and Y. Li, Effect of the sulfidation process on the mechanical properties of a CoMoP/Al2O3 hydrotreating catalyst, Chem. Eng. Sci, 2009, 64,198-206 [ Links ]
38 H. Deng, J. Lu, G. Li, G. Zhanga and X. Wang, Adsorption of methy-lene blue on adsorbent materials produced from cotton stalk, Chem. Eng. J., 2011, 172, 326-334 [ Links ]
39 K. Adinarayana and P. Ellaiah, Response surface optimization of the critical medium components for the production of alkaline protease by a newly isolated Bacillus sp., J. Pharmaceut. Sci., 2002, 5, 272-278. [ Links ]
40 N. Taha and S. Samaka, Natural Iraqi palygorskite clay as low cost adsorbent for the treatment of dye containing industrial wastewater, J. Oleo. Sci. 2012, 61, 729-736. [ Links ]
41 A.F Shojaei, AR Tabari and M.H Loghmani, Normal spinel CoCr2O4 and CoCr2O,/TiO2 nanocomposite as novel photocatalysts, for degradation of dyes, Micro Nano Lett., 2013, 8, 426-431. [ Links ]
42 Y.S. Al-Degs, M.A. Khraisheh, S. Allen and M.N. Ahmad, Adsorption of Remazol reactive black B on different types of activated carbon: adsorption on H and L carbon, Adv. Env. Res., 1999, 3, 132-138. [ Links ]
43 C.H. Lai and C.Y. Chen, Removal of metal ions and humic acid from water by iron-coated filter media, Chemosphere, 2001, 44, 1177-1184. [ Links ]
44 J.P. Chen and M. Lin, Equilibrium and kinetics of metal ion adsorption onto a commercial H-type granular activated carbon: experimental and modeling studies, Water Res. 2001, 35, 2385-2394. [ Links ]
Received 27 May 2016
Revised 27 March 2016
Accepted 8 April 2016
* To whom correspondence should be addressed. E-mail: s_ali_hosseini@yahoo.com

