


Servicios Personalizados
Articulo
 Inglés (pdf)
 Articulo en XML
 Referencias del artículo
Indicadores

Links relacionados
-
 Citado por Google
 -
 Similares en Google
Compartir

 Permalink
South African Journal of Chemistry
versión On-line ISSN 1996-840X
versión impresa ISSN 0379-4350
S.Afr.j.chem. (Online) vol.68 Durban 2015
http://dx.doi.org/10.17159/0379-4350/2015/v68a25
RESEARCH ARTICLE
Plume characterization of a typical South African braai
A.D. VenterI; K. JaarsI; W. BooyensI; J.P. BeukesI; P.G. van ZylI, *; M. JosipovicI; J. Hendriks" V. VakkariII, III; H. HellénIII; H. HakolaIII; H. AaltonenIII; J. Ruiz-JimenezIV; M-L. RiekkolaIV; L. LaaksoI, III
IUnit for Environmental Sciences and Management, North-West University, Potchefstroom, South Africa
IIDepartment of Physics, P.O. Box 64, FIN-00014, University of Helsinki, Finland
IIIFinnish Meteorological Institute, Helsinki, Finland
IVDepartment of Chemistry, P.O. Box 55, FIN-00014, University of Helsinki, Finland
ABSTRACT
To braai is part of the South African heritage that transcends ethnic barriers and socio-economic groups. In this paper, a comprehensive analysis of atmospheric gaseous and aerosol species within a plume originating from a typical South African braai is presented. Braai experiments were conducted at Welgegund - a comprehensively equipped regional background atmospheric air quality and climate change monitoring station. Five distinct phases were identified during the braai. Sulphur dioxide (SO2), nitrogen oxides (NOx) and carbon monoxide (CO) increased significantly, while ozone (O3) did not increase notably. Aromatic and alkane volatile organic compounds were determined, with benzene exceeding the 2015 South African one-year ambient air quality limit. A comparison of atmospheric PM10 (particulate matter of an aerodynamic diameter <10μm) concentrations with the 24-hour ambient limit indicated that PM10 is problematic during the meat grilling phase. From a climatic point of view, relatively high single scattering albedo (ωo) indicated a cooling aerosol direct effect, while periods with lower ωocoincided with peak black carbon (BC) emissions. The highest trace metal concentrations were associated with species typically present in ash. The lead (Pb) concentration was higher than the annual ambient air quality limit. Sulphate (SO42--), calcium (Ca2+) and magnesium (Mg2+) were the dominant water-soluble species present in the aerosols. The largest number of organic aerosol compounds was in the PM25-1 fraction, which also had the highest semi-quantified concentration. The results indicated that a recreational braai does not pose significant health risks. However, the longer exposure periods that are experienced by occupational vendors, will significantly increase health risks.
Keywords: Braai (barbeque), atmospheric gaseous species, aerosols, atmospheric organic compounds, optical properties, chemicalproperties
1. Introduction
A braai (plural braais) is the practice by which wood or charcoal is burned in an open fire to grill meat. The word braai is an Afrikaans word for barbecue or grill. Although the term originated from Afrikaans-speaking people, it was adopted by South Africans of many ethnic backgrounds. The application of braai transcends ethnic barriers and is practised by people of all socio-economic groups in South Africa. This form of cooking is not just a means to an end, but is an important social activity that strengthens the inter- and intra-relations of communities. It is common practice to include this type of cooking in casual family time, formal team-building events, meetings and business entertainment.1 In describing the essentials needed at the ideal campsite (stand), a portable braai is listed among other fundamentals such as electrical outlets and water points.2 It has been stated that a braai started at lunchtime could last the entire afternoon and well into the evening.3
Braai meat is also sold by many vendors on street markets in formal, semi-formal and informal settlements in South Africa. In addition, wood and charcoal are commonly burned in many households for cooking and space heating, especially in semiformal and informal settlements, which significantly contributes to poor air quality.4,5 Alternative, cleaner burning fuels have been suggested to replace wood-fired braais used by meat traders and households.6
Historically, wood was the most widely used braai fuel. However, in modern times, the use of charcoal or charcoal-related products, such as briquettes, has increased due to the availability and competitive price thereof. A charcoal fire also emits less smoke and particulate matter compared to a wood fire.7 Although wood and charcoal are not the primary energy source in most developed countries, it is currently one of the most commonly used fuels for cooking.8 The population growth in the developing world, with its associated increasing demand in oil- and gas-based energy, may in future promote the increased use of wood and charcoal for cooking.
Although wood- and charcoal-based cooking is currently not treated as a significant source of airborne pollution compared to other well-known sources, e.g. motor vehicles, industries, coal-fired power plants and biomass burning, cooking emissions and its associated adverse impacts on human health and the environment should not be neglected.9 Typical emissions usually associated with biomass burning (veld fires and household combustion) that could be similar to emissions from a typical braai include nitrogen oxides (NOx), carbon monoxide (CO), volatile organic compounds (VOCs), black carbon (BC), as well as particulate inorganic and organic compounds. Gases and particulate species also have a significant impact on climate change. Particulate species, for instance, have a cooling or warming effect (direct and indirect) on the atmosphere, depending on their chemical and physical properties. Gaseous species could also react to form particulates through gas-to-particle transformations.10
Few studies have been published that characterize airborne species emitted from braais to determine the associated pollu-tion11 and impacts on climate change. Therefore, in this paper, a comprehensive analysis of atmospheric species within a plume originating from a typical South African braai is presented.
2. Site Description
Measurements were conducted at Welgegund (www.welge-gund.org) located on a grazed grassland savanna approximately 100 km west of Johannesburg in the North West Province of South Africa. There are no major mining and/or industrial activities within the vicinity of the site. The nearest surroundings included grazed fields and farmland used in maize cultivation. Additionally, the entire western sector (from north to southeast) contains no major point sources. This sector is therefore representative of the regional background of the interior of South Africa and to some extent of southern Africa. However, the site is also frequently impacted by air masses that have passed over various source regions, which include petrochemical industries, coal-fired power stations, the Johannesburg-Pretoria megacity conurbation and the Bushveld Igneous Complex that contains various pyrometallurgic operations.12 A detailed description of the location and instrumentation of the Welgegund monitoring stations was presented by Beukes el al.12Currently, this measurement station is one of the most comprehensively equipped in South Africa to measure air quality and climate change-relevant parameters.12-16
3. Materials and Methods
3.1. Materials
During each braai experiment, four bags of 4 kg Weber™ briquettes purchased from a local supermarket were used. Two briquettes were removed from each bag for subsequent material characterization. Blitz™ firelighters were used to light the braais.
Lamb chops and beef sausages were purchased from a local supermarket for each braai experiment. Eight lamb chops weighing 796 ±2gand eight beef sausages weighing 804 ±5g were placed on each braai used in the experiments. One lamb chop and one beef sausage were randomly selected and analyzed in order to characterize the raw meat utilized. Although other types of meat are also used for a braai, lamb chops and beef sausages are often used. It can be expected that different types of meat will result in different atmospheric emissions.17 However, it was not the aim of this study to determine emissions associated with different meat types. The aim was to determine air quality impacts and aerosol direct effects associated with a typical braai. Therefore, the emission measurements obtained with meat used in this study can be considered to be representative.
3.2. Material Characterization
Similar to the procedures described by Kleynhans el al., randomly selected charcoal briquettes were pulverized to obtain a homogeneous composition for subsequent material characterization (based on ISO 13909-4:2001).18 Proximate analysis (air-dried basis) was performed to obtain moisture (SANS 5925:2007), ash (ISO 1171:2010) and volatile matter contents (ISO 562:2010), while ultimate analysis determined the total carbon (C), hydrogen (H), nitrogen (N), oxygen (O) (ISO 29541:2010) and sulphur (S) contents (ISO 19579:2006).
Representative samples of raw meat, i.e. one lamb chop and one beef sausage, were chemically analyzed according to the guidelines of the association of official analytical chemists (AOAC) to determine the moisture (AOAC 950.46), ash (AOAC 923.03), total fat (AOAC 996.06), protein (Dumas Combustion Method), N (Dumas Combustion Method) and sodium (Na) (AOAC Method 984.27) contents.
3.3. Braai Setup
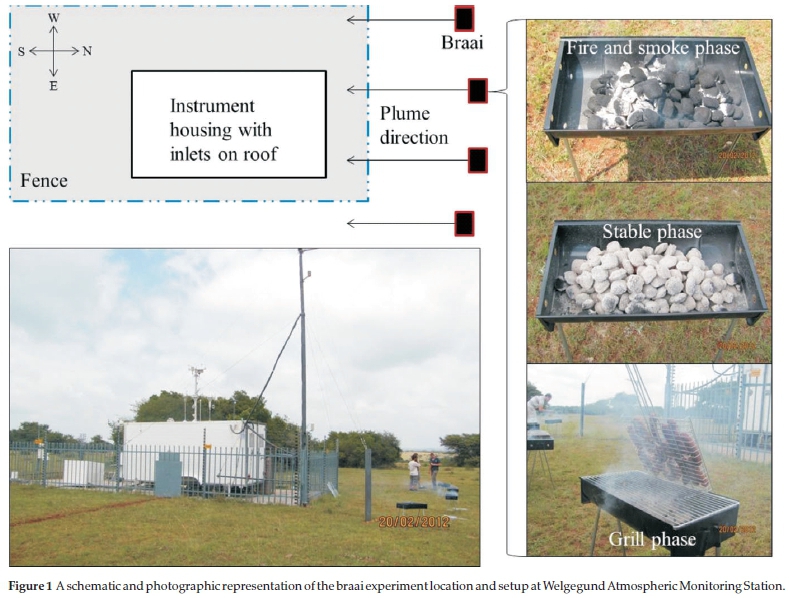
The first braai experiment was conducted on 20 February 2012 and the second experiment on 29 January 2013. Participants in the experiments arrived at the Welgegund site at 09:55 for the first braai experiment and 09:45 for the second braai experiment. Vehicles were parked at least 100 m from the site to ensure that exhaust fumes did not bias the baseline measurements prior to the commencement of the braai experiments. For both experi-ments,4.0 ± 0.1 kg charcoal briquettes were placed in each of the four identical braais and each braai was lit using 28 ± 0.6 g firelighters. During the first braai experiment, the firelighters were lit at approximately 10:13, while firelighters were lit at approximately 10:20 during the second experiment. In order to ensure that the plumes originating from the braais reached all the instrument inlets, the four identical braais were strategically placed upwind of the monitoring station at a distance of 5.4 m from the inlets during both experiments. Figure 1 indicates a schematic illustration and photographs of the braai experimental setup, as well as the general plume direction.
For each braai experiment, the concentrations of all atmospheric gaseous species and aerosols measured are presented in time series graphs from 09:00 to 13:00. Five different phases were defined during the braai experiment, i.e. prior to the braai (prior phase), the phase when the braai is ignited, followed by the presence of fire and smoke (fire and smoke phase), a stable period during which all the charcoal briquettes were glowing (stable phase), grilling the meat stage (grill phase) and a phase after the meat is cooked and removed from the braai (postphase). The fire and smoke, stable and grill phases are also presented in Fig. 1. The charcoal was allowed to burn for one hour after it was lit (fire and smoke phase) in order to achieve peak combustion. At that stage, smoke emanating from the burning charcoal briquettes had totally subsided and all briquettes glowed red. This stable phase was allowed to continue for 18 minutes during the first experiment and 15 minutes during the second experiment in order to clearly differentiate between the stable phase and the grill phase. Grilling of the meat (grill phase) started at 11:40 during the first experiment and at 11:30 during the second experiment. The meat was grilled until it was well done. The grilled meat was removed at 12:10 and 12:00 during the first and second braai experiments, respectively. Thereafter, the braais from which the meat had been removed were left as is until 12:40 during the first experiment and 12:28 during the second experiment. This allowed the embers to cool down, while post-grilling atmospheric measurements were obtained.
3.4. Sampling Methods
Most of the measurement instruments were housed inside an Eurowagon 4500u trailer. Detailed descriptions of the measurement station, as well as procedures for quality assurance, maintenance and data analysis were presented in previous papers.4, 12-14, 19
Various continuous measurements of atmospheric gaseous species and aerosols are performed at the Welgegund station. Atmospheric gaseous species, i.e. sulphur dioxide (SO2), nitrogen oxide and (NO) nitrogen dioxide (NO2), ozone (O3) and CO were measured with the following instruments: a Thermo-Electron 43S SO2 analyzer (Thermo Fisher Scientific Inc., Yokohama-shi, Japan), a Teledyne 200AU NO/NOx analyzer (Advanced Pollution Instrumentation Inc., San Diego, Cam USA), an Environment SA 41M O3 analyzer (Environment SA, Poissy, France) and a Horiba APMA-360 CO analyzer (Horiba, Kyoto, Japan). The atmospheric aerosol measurement instrumentation were equipped with PM10 (particulate matter with aerodynamic diameter <10 μm) inlets. A synchronized hybrid ambient real-time particulate (SHARP) monitor (model 5030, Thermo Fisher Scientific Inc.) was used to determine the total mass of atmospheric PM10 particles. A multi-angle absorption photometer (MAAP) (model 5012 Thermo Fisher Scientific Inc.) was used to determine the aerosol absorption at 637 nm and atmospheric black carbon (BC) concentrations. No filter change artefact20 occurred in the MAAP measurements during the experiment. An Aurora 3000 three-wave length nephelometer (Ecotech Inc., Knoxfield, VIC, Australia) was used to determine light scattering of aerosols at three wavelengths, i.e. 450, 525 and 635 nm. A custom-built differential mobility particle sizer (DMPS) equipped with a TSI condensation particle counter (CPC) (model 3010, TSI Inc., Shoreview, MN, USA) was used to determine the total number concentration of aerosols between 12 and 840 nm. All measurements were logged at one minute intervals, with the exception of the aerosol size distribution that was recorded every nine minutes. All permanently operating instruments at the Welgegund atmospheric research station had been running upon arrival, providing a sufficient baseline before the braai experiments.
Absorption measurements are not presented separately in this paper, because BC concentrations are derived from absorption measured at 637 nm and would mimic BC results.21 The single scattering albedo (wo) was calculated as

where σapis the aerosol absorption determined with the MAAP (637 nm) and σspis the aerosol scattering at 637 nm; Ssp is extrapolated from aerosol scattering measurements using Angström exponents, cf. Laakso et al.22
VOCs were collected on 20 stainless steel adsorbent tubes (6.3 mm ED x 90 mm, 5.5 mm ID, Tenax-TA packing material) during the different phases of the first braai experiment. Duplicate VOC samples were collected for 10 minutes during the different phases of the braai, i.e. four times during the fire and smoke phase, once during the stable phase, twice during the grill phase and three times after the meat was removed from the grill. The first 1.25 m of the adsorbent tube inlet (made from stainless steel) was heated to 120 °C to remove O3 that leads to sample degradation.23 A constant flow-type automated programmable pump sampler was used at a flow rate of 10 mL min-1 After sampling, the tubes were removed and closed with Swagelok® caps. Each tube was separately wrapped in aluminium foil and transported to the laboratory, where it was stored in a freezer. The analysis was performed with a thermal desorption (TD) system (Perkin-Elmer TurboMatrix™ 650, Waltham, USA) coupled to a gas chromatograph (GC) (Perkin-Elmer® Clarus® 600, Waltham, USA) with a mass spectrometer (MS) detector (Perkin-Elmer® Clarus® 600T, Waltham, USA). Quality assurance of the data was performed as previously described.13,23
A Dekati (Dekati Ltd., Finland) PM10 cascade impactor (ISO23210) was used to collect PM10-25 (particulate matter with aerodynamic diameter 2.5 >10 μm), PM2,5-1 (particulate matter with aerodynamic diameter 1 μm < 2.5 μm) and PMj (particulate matter with aerodynamic diameter < μm) at a flow rate of 30 L min-1. Teflon® filters were used to collect the water-soluble anion and cation species, as well as trace metals. All collected filters were divided into two equal parts with a fit-for-purpose stainless steel punch. One part was used to determine water-soluble anion and cation content, while the second part was used for trace metal analysis. For water-soluble anion and cation analysis, each sample was leached in 5 mL deionized water (18.2 ΜΩ) and subsequently analyzed on an ion chromatograph (IC) with conductivity detector (Dionex ICS-3000). The particulates collected on the second half of the Teflon® filters were extracted by means of hot acid leaching (20 mL HNO3 and 5 mL HCl) and diluted in deionized water to 100 mL for subsequent trace metal analysis with an inductively coupled plasma mass spectrometer (ICP-MS) Agilent 7500c).24,25
A second Dekati PM10 cascade impactor (ISO23210) equipped with quartz filters was used to collect particulates at the same flow rate and in the same size ranges (PM10-2.5,PM2.5-1 and PM1)as mentioned above. After sampling, the filters were kept in a freezer until analysis. These filters were used to characterize and semi-quantify organic compounds. Each filter was extracted with a 1:1 mixture of methanol and acetone by utilizing dynamic ultrasonic assisted extraction for 40 min as described by Booyens et al.15The analysis was performed with comprehensive two-dimensional gas chromatography coupled with a time-of-flight mass spectrometer (GCxGC-TOFMS). A LECO Pegasus 4D GCxGC-TOFMS system equipped with an Agilent 7890 A GC and an Agilent 7683 B auto sampler was used. The organic compounds were identified with LECO ChromaTOF and Guineu software according to mass spectral matches (similarity fits 700/1000) and retention indices confidence intervals fewer than 150 units). More restrictive characterization parameters could have been applied, which would have resulted in the more accurate characterization of organic compounds. Additionally, identified organic species could also be verified and supported by the analysis of standards. However, this was not applied in this study. Therefore, the compounds characterized in this paper are considered to be pre-identified organic species. Thereafter, the compounds were categorized according to their functional groups, i.e. hydrocarbons (alkanes, alkenes, alkynes, aromatics), oxygenated species (alcohols, ethers, aldehydes, ketones, carboxylic acids, esters), halogenated compounds (chloride (Cl), bromide (Br), iodine (I), fluorine (F)), as well as N-and S-containing organic compounds. The organic compounds were sem-quantified, which is an approximation of the concentration of the organic compounds. In this study, 1-1'binaphthyl was used as an internal standard and the relative concentrations of the organic compounds were expressed as the sum of the normalized response factors (SNRF), which is a measure of the detector response of an analyte compared to the internal standard. The calculation of these SNRF values is described in Booyens et al.15
In addition to the atmospheric measurements, a thermocouple was also used to determine the temperature in the centre of the briquettes during the different braai phases previously indicated, i.e. fire and smoke, stable, grill and post.
4. Results
All measurements were logged at one-minute intervals, with the exception of the aerosol size distribution that was recorded every nine minutes. Twenty VOC's samples were taken, each after 10 minutes of sampling. The filters used for trace metal, anion, cation and organic analysis sampled for the duration of the experiment. Since the experiment is dependent on ambient conditions (e.g. wind direction, speed, turbulence and natural chemistry) it was repeated one year later. All permanently operating instruments at the Welgegund atmospheric research station had been running upon arrival, providing a sufficient baseline before the two braai experiments. The resemblances between the two experiments, (a) and (b), can be seen in each figure, where (a) is first and (b) second braai experiment, respectively.
4.1. Material Characterization
The characterization of the raw materials, viz. charcoal briquettes, beef sausage and lamb chops, utilized in the braai experiments is presented in Table 1. Proximate analysis of the charcoal briquettes indicated that the briquettes had a fixed carbon content of 41.70 %, ash content of 20.47 % and 32.20 % volatile matter. The use of a binding agent when the charcoal pulp was compressed into briquettes possibly contributed to the relatively high volatile content measured. The ultimate analysis revealed very low percentages of N and S present in the briquettes, with expected higher percentages of N, C and O.
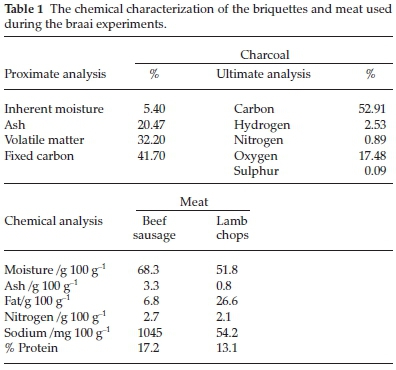
Analyses of the meat samples indicated that the beef sausages had higher ash content, moisture, protein, N and Na levels than the lamb chops did. The high Na concentration in the sausages can be expected, since it is a processed form of meat with table salt and other spices added according to a specific recipe. The lamb chops contained more fat than the beef sausages did, which was likely due to the fat layer attached to the chops. Beef sausages are usually prepared from specific recipes that require a certain amount of fat to be added.
4.2. Gaseous Species
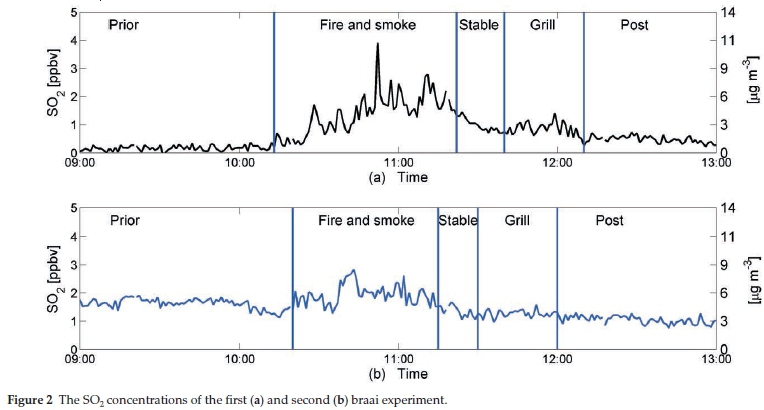
In Fig. 2, the SO2 concentrations for the two braai experiments are presented. It is evident that the SO2 concentrations were relatively low prior to the onset of the braai experiments. However, after the braai was ignited, SO2 concentrations started to increase and peaked during the fire and smoke phase. High temperature oxidation of S present in both the firelighters and charcoal (Table 1) is most likely the source of SO2 during this stage. A decrease in SO2 concentrations was observed as the charcoal briquettes started burning optimally (stable phase). When the meat was added and grilling started, SO2 concentrations increased slightly, returning to ambient levels as the grilled meat was removed from the braais. The minor increase in SO2 concentrations during the grill phase could be ascribed to possible low S concentrations in the meat and dripping fat (Table 1), which is oxidized and volatilized.
In order to contextualize the above-measured SO2 concentrations, the measurements were compared to relevant current and future air quality limits. In Table 2, the limits prescribed by the South African and European ambient air quality standards are listed. Throughout the braai experiments, SO2 concentrations remained well below the prescribed South African 10-minute ambient standard limit of 500μm-3.
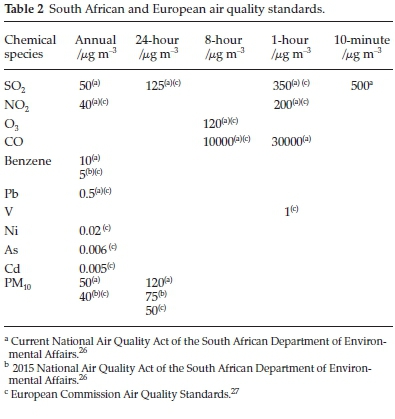
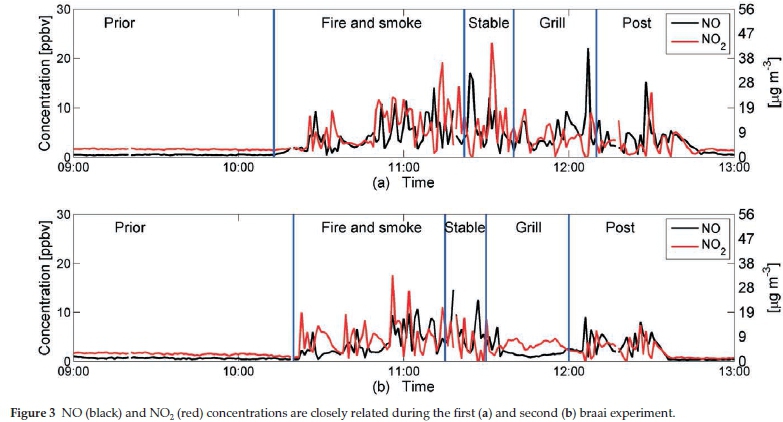
In Fig. 3, atmospheric concentrations of NO and NO2 are presented. Ambient NO and NO2 levels were constant and relatively low before the fires were lit. NO2 were also higher than NO, which is typical for ambient NOx since NO emitted into the atmosphere is oxidized to NO2. Concentrations of NO and NO2 increased significantly and remained elevated for the duration of both braai experiments. Additionally, no distinct trends in relation to the various braai phases were observed. In contrast to typical ambient conditions, NO and NO2 were also in the same concentration range, which is indicative of a fresh plume that has not been oxidized. NO and NO2 levels returned to ambient concentrations once the braais were removed. The possible sources of the enhanced NO and NO2 concentrations during the braai could be from the N present in the charcoal fuel and the meat (Table 1), as well as the thermal oxidation of N2. However, since a maximum temperature of 750 °C was measured in the glowing charcoal briquettes, it is unlikely that the contribution from the latter source would be significant. Thermal NOx formation usually occurs above 1600 °C when N2 and O2 in the combustion air disassociate into their atomic states.28 Therefore, the most likely source of NOx would be the oxidation of N present in the briquettes, with a possible smaller contribution from the meat. Notwithstanding the afore-mentioned relatively significant increases of NO and NO2 observed during both braai experiments, NO2 remained well below the prescribed one-hour standard limit of 200 m-3 indicated in Table 2.
Atmospheric O3 concentrations presented in Fig. 4 fluctuated more during the fire and smoke, and the grill phases compared to the typical diurnal O3 concentrations represented by the mean diurnal O3 levels calculated for the summer of 2012. However, no significant O3 increases were observed. In the first braai experiment, the O3 levels did not significantly exceed the summer mean values indicated in Fig. 4a. During the second braai experiment (Fig. 4b), the O3 concentrations exceeded the summer mean values, due to the background O3 concentrations (prior phase) being significantly higher than during the first experiment. Atmospheric O3 concentrations usually increase during daytime, since atmospheric O3 formation is dependent on solar radiation, which was still observed during the braai experiments. The lower than typical ambient O3 concentration that occurred during the various braai phases can possibly be ascribed to periods when titration of O3 occurred. However, the peaks that were observed during the braai experiments were unexpected and cannot be explained at this stage. The South African national ambient air quality standard limit and the European standard limit for O3 is an eight-hour moving average of 120 μg m-3 (Table 2). The duration of the braai experiments was ~2.5 hours and the levels can therefore not be directly compared to the eight-hour limit. However, O3 concentrations twice peaked above 120 μg m-3 during the second braai experiment. Although O3 levels were not significantly elevated in the fresh braai plume, it is expected that O3 levels could increase in the aging plume due to NOx and VOC (discussed later in the paper) emissions from the braai.13
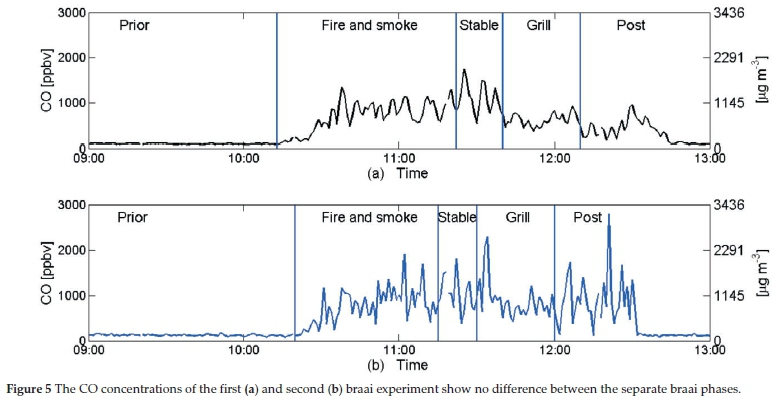
In Fig. 5, atmospheric CO concentrations are presented. CO levels sharply increased during the fire and smoke phase of the experiments shortly after the fires were lit. This was expected, since CO is a major product of incomplete combustion. CO concentrations remained elevated for the duration of both braai experiments. Similar to NOx concentrations, CO levels did not exhibit a clear trend in relation to the various braai phases and ambient CO concentrations were restored after removal of the braais. Notwithstanding the afore-mentioned elevated levels, concentrations remained below the prescribed one-hour South African ambient standard limit of 30 000 μg m-3 (Table 2).
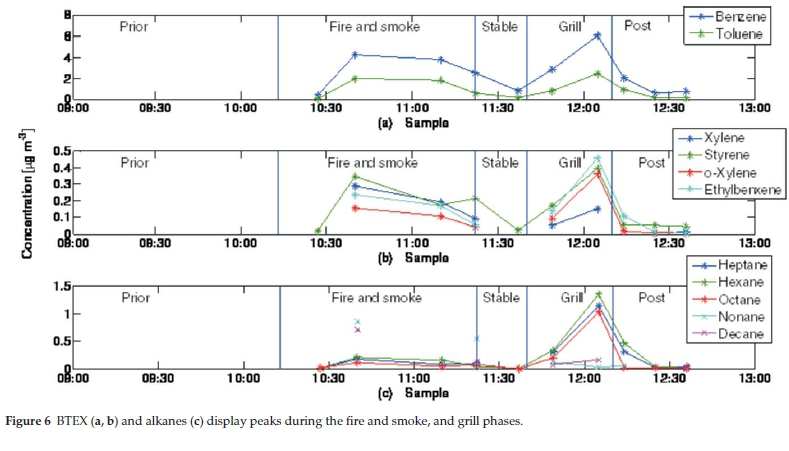
In Fig. 6, the concentrations of atmospheric VOCs measured during the first braai experiment are presented. These measurements were not conducted during the second experiment. The VOC species detected were primarily the aromatics (benzene, toluene, ethyl benzene, xylene and styrene) and alkanes (heptane, hexane, octane, nonane and decane). All other VOCs were below the detection limit of the analytical instrument. Nonane and decane were also not detected in all the phases of the braai, as indicated by missing data points for these compounds in Fig. 6. Benzene was the main VOC emitted, while toluene had the second highest concentrations. The concentrations of all the aromatics, as well as the longer chain alkanes, nonane and decane, were higher during the fire and smoke phase. This can most likely be attributed to the paraffin-like compounds in the firelighters, as well as the volatile matter present in the charcoal briquettes (Table 1) being released during combustion. The concentrations of the aromatics, as well as the shorter chain alkanes, hexane, heptane and octane, were elevated during the grill phase. The shorter chain alkanes were significantly higher during the grill phase, compared to their levels in the fire and smoke phase. The emissions of VOCs during the grill phase can be mainly attributed to fat dripping on the coals. Fat lipids range from four- to 24-carbon chain lengths. Burning fats could reduce the carbon chain length and contributed to the higher concentrations of the shorter carbon chain alkanes. Cross-bridging between the carbon chains that occurs due to the high temperatures could account for the formation of aromatics. Furthermore, the cooking process breaks cell membranes, as well as alters protein structure and fat composition, which can release various VOCs that are perceived by the smell (aroma) of certain aromatics.
Benzene is currently the only VOC that has a South African ambient air quality standard limit, i.e. a one-year standard of 10 μg m-3, which will change to 5 μg m-3 in 2015 (Table 2).
Benzene concentrations were higher than the 2015 one-year limit during the fire and smoke, and grill phases. However, it must be noted that the entire braai experiment was conducted in approximately 2.5 hours and these short-term levels can therefore not be used to quantify possible impacts on human health associated with atmospheric benzene exposure during a typical braai. However, it is evident that benzene and toluene levels were substantially elevated above ambient concentrations during the braai, since the maximum benzene and toluene concentrations during the grill phase were 50 and four times higher than the ambient measured annual median benzene (0.13 ppb) and toluene (0.63 ppb) levels at Welgegund, respectively.13
4.3. Aerosol Species
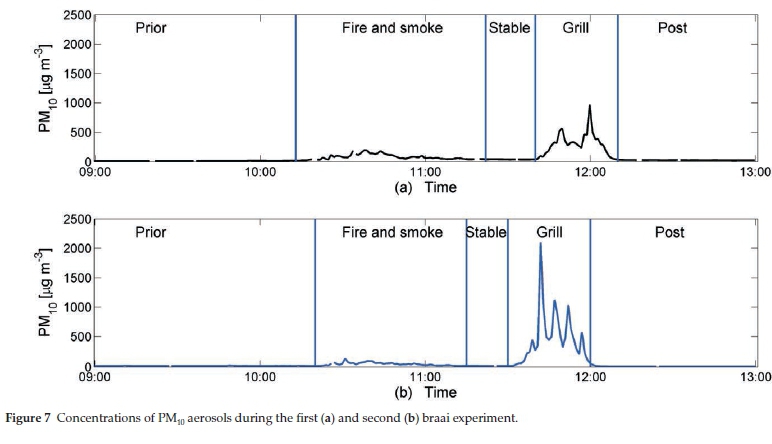
The PM10 mass presented in Fig. 7 indicates that PM10 concentrations increased above the background concentrations during the fire and smoke phase, and even more significantly during the grill phase. During the fire and smoke phase, this increase was approximately an order of magnitude, while the increase during the grill phase was up to two orders of magnitude. In contrast to most of the measurements discussed, the PM10 levels during the stable phase were similar to background concentrations. The higher PM10 concentrations measured during the fire and smoke phase and the grill phase can be attributed to primary aerosols emitted from the incomplete combustion of different fuels, i.e. firelighters and charcoal during the fire and smoke phase, and fat dripping on the charcoal during the grill phase. It is unlikely that a significant amount of secondary aerosol formation occurred, since the braais were in close proximity to the inlets. The chemical composition of these aerosols will be explored later in the paper when the GCxGC-TOFMS analyses are considered. The current 24-hour South African ambient standard limit for PM10 is 120 μg m-3, which will be revised in 2015 to 75 μg m-3 (Table 2). The duration of the braai experiments was ~2.5 hours and PM10 concentrations can therefore not be compared directly to the 24-hour limits. However, concentrations during the fire and smoke phase occasionally exceeded the current concentration limit, while the future limit was exceeded several times. During the entire grill phase, the current and future limits were significantly exceeded. The prevalence of high PM10 levels from charcoal combustion has previously been identified as a concern.29
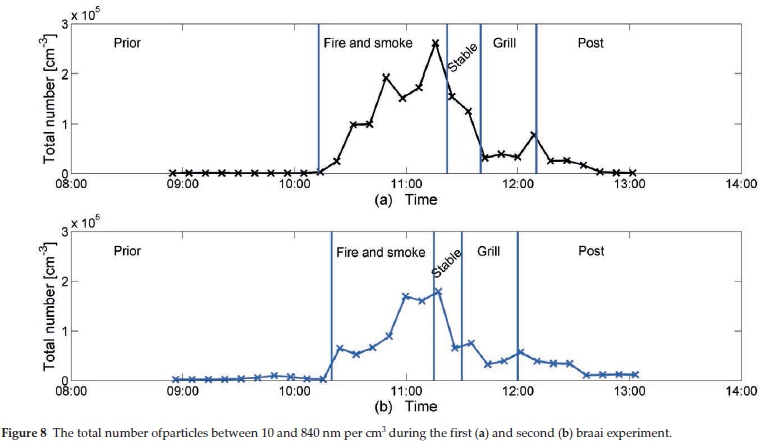
The total number of sub-micron particles ranging between 12 and 840 nm measured during the braais, as presented in Fig. 8, increased after the firelighters were lit and reached a maximum at the end of the fire and smoke phase. During the first braai experiment, the sub-micron total number concentration reached 250 000 cm-3, which is two orders of magnitude above the baseline measurements during the prior phase. However, the ~9 min scanning time of the DMPS negatively influence the resolution of the measurements and it can therefore not be stated with absolute certainty when peak number concentrations occurred. The total number of submicron particles decreased during the stable phase, remaining relatively stable during the grill phase and only returning to background concentrations after the braais were removed.
A comparison of the PM10 mass concentration (Fig. 7) and the submicron particle number concentration (Fig. 8) clearly indicates that smaller particles are emitted during the fire and smoke phase, while larger particles are mainly emitted during the grill phase. In addition, air ion spectrometer (AS) measurements of the 10-1:0 nm negative ion concentrations indicated that the negative ion levels during the fire and smoke phase were 10 to 20 times higher than during the prior phase. Furthermore, negative ion concentrations were twice as high during the fire and smoke phase compared to negative ion levels during the grill phase, which indicates higher ultrafine particle concentrations during the fire and smoke phase. The lower number of fine particulates observed during the grill phase could also be attributed to the high conversational sink of other species during this phase, e.g. by lower SO2 emissions during the grill phase compared to the fire and smoke phase. The potential health risks associated with exposure to ultrafine particles released during charcoal-based cooking may be higher than acceptable30, especially when this method of cooking is conducted in a confined space, e.g. household combustion. A typical South African braai, however, usually takes place outdoors or in a well-ventilated area.
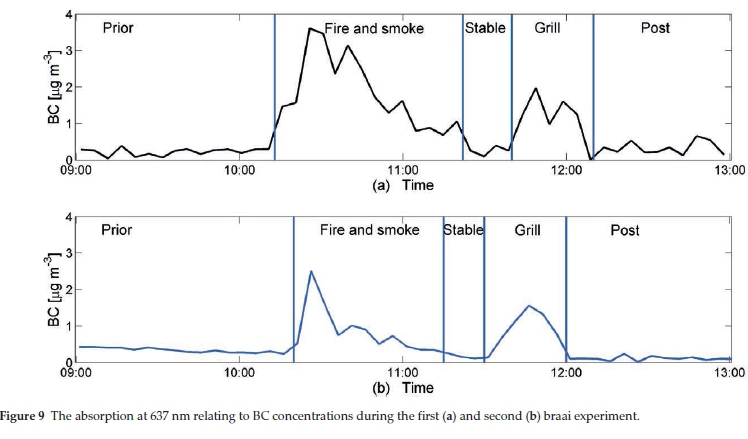
In Fig. 9, the five-minute means for BC concentrations are presented. BC mass increased directly after igniting the firelighters up to a maximum during the fire and smoke phase due the liberation of BC particles from the charcoal and possible incomplete combustion. As the braai reaches the stable phase, BC levels decreased and returned to background levels. BC concentrations again increased when the meat was placed on the grill. This could be attributed to two possible release mechanisms, i.e. BC particles can be liberated from the charcoal by the dripping action of the hot fat on the briquettes, as well as incomplete combustion of the dripping fat in the flames. After the meat was removed from the braai, background BC levels were again observed.
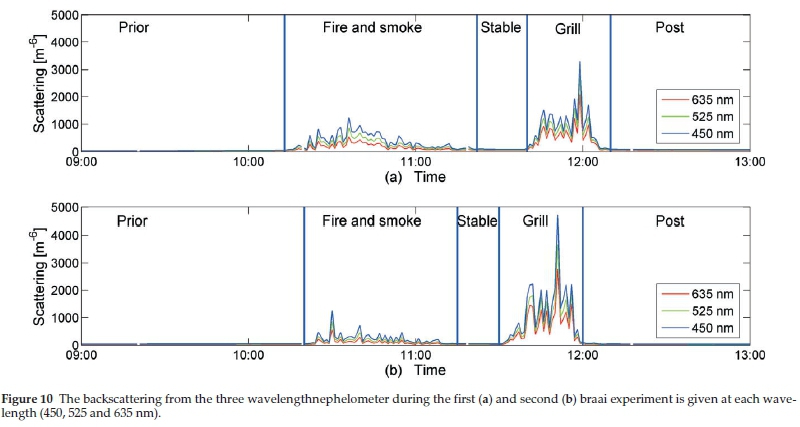
The intensity of light scattering measured by the three-wavelength nephelometer is presented in Fig. 10. From these data, it is evident that light scattering was elevated during the fire and smoke phase and reached its maximum during the grill phase, while it was similar to background levels during the other phases. A similar trend was observed for PM10 concentrations (Fig. 7). A comparison of these two measurements, i.e. scattering and PM10, indicated that PM10 observed during the braai is more scattering than absorbing. This will be explored in the next paragraph where single scattering albedo (wo) is considered.
In Fig. 11, the five-minute averages of the calculated wo are presented. Depending on the surface albedo, wo can be used to estimate whether the aerosol direct effect is heating or cooling. Over grassland, for instance, the wo threshold between heating and cooling is approximately 0.75, i.e. wo> 0.75 indicates a cooling aerosol direct effect. Laakso et al. presented a campaign average of 0.84 and summer-time average of 0.89 for measurements conducted at Elandsfontein in the Mpumalanga High-veld.22 Beukes et al. reported a median wo of 0.89 for the relatively clean background sector at Welgegund.12 From the comparison of the braai plume wo with the afore-mentioned literature data it is evident that aerosols for the entire measurement period were very reflective. Initially, during the fire and smoke phase, somewhat lower wo values were observed, which correlated with the peak release of BC (Fig. 9). Thereafter, the wo was similar to background levels, with the exception of the grill phase when very high wo was observed. This can most likely be attributed to fat dripping on the coals during the grill phase, increasing the emissions of organic aerosols, which is mostly reflective. This is supported by the increase in VOC emissions observed during this phase. During the fire and smoke phase, the mean wo was 0.94, while the grill phase had a mean of 0.98. The mean wo for the entire braai experiment was 0.96. These values are extremely high and indicate that aerosols emanating from a braai are very reflective resulting in a cooling aerosol direct effect on the atmosphere.
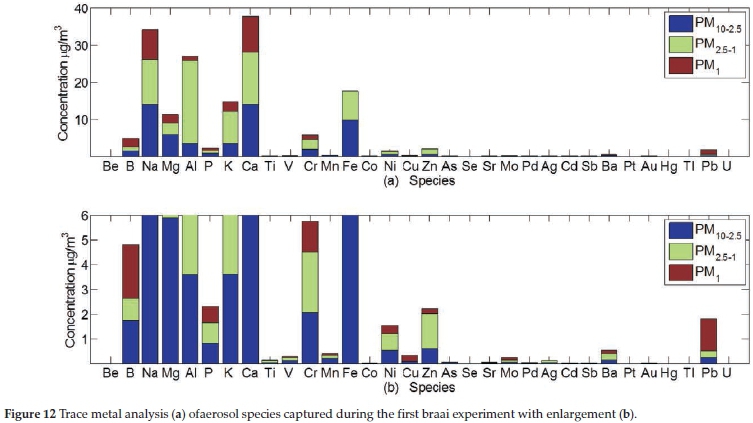
Barbecue charcoal combustion can be an important source of trace metal emissions to the atmosphere.31 Therefore, the trace metal content of the aerosols from the braai was also quantified. In contrast to most of the other measurements, no prior and post-phase concentrations were determined. Therefore, trace metal concentrations cannot be contextualized in relation to background levels at Welgegund. In total, 32 trace elements could be detected, which included beryllium (Be), boron (B), Na, magnesium (Mg), aluminium (Al), phosphorus (P), potassium (K), calcium (Ca), titanium (Ti), vanadium (V), chromium (Cr), manganese (Mn), iron (Fe), cobalt (Co), nickel (Ni), copper (Cu), zinc (Zn), arsenic (As), selenium (Se), strontium (Sr), molybdenum (Mo), palladium (Pa), silver (Ag), cadmium (Cd), antimony (Sb), barium (Ba), platinum (Pt), gold (Au), mercury (Hg) thallium (Tl), lead (Pb) and uranium (U). The concentrations of these trace elements measured in the different size fractions are presented in Fig. 12. Be, Se and Pt were below the detection limit of the analytical technique applied. Mo and Hg were below the detection limit in the PM2.5-1 fraction, while Fe, Co, Ag and Hg were below the detection limit in the PM1 fraction. The highest trace metal concentrations were measured for Ca, Na, Al, Fe, K, Mg, Cr, and B, which contributed 21.3,19.3,15.2, 9.9,8.3, 6.4, 3.3 and 2.7 %,respectively, to the total concentration. These species are typical ash components. The other trace metals contributed only 13.6 % of the total trace metal concentration. The size distribution results indicated that 46 % of the total trace metal mass was in the PM2.5-1 size range. Trace metal concentrations determined by Van Zyl el al. in the highly industrialized western Bushveld Igneous Complex (BIC) in South Africa indicated that atmospheric Fe and Mg were the most abundant atmospheric metal species, while Na, B and Al also had relatively high atmospheric concentrations.24
Pb is the only metal species that has a limit prescribed by the South African ambient air quality standards, while limits also exist for V, Ni, As, Cd and Pb in Europe. The total Pb, V, Ni, As and Cd concentrations were 1.798, 0.301, 1.532, 0.068 and 0.007 m-3, respectively. Pb exceeded the South African and European annual ambient air quality limit, while V, Ni, As and Cd exceeded European annual ambient air quality limits. These exceedences of the one-year standard limits of these metals cannot, however, be used to quantify the possible negative effects on human health exposure for the duration of a braai. The annual average concentrations of Pb, V and Ni in the western BIC determined by Van Zyl el al. were 0.08,0.04 and 0.33 μg m-3, while As and Cd were not detected.24 The annual average concentration of 0.33 m-3 measured for Ni exceeded the standard limit value by an order of magnitude, which was attributed to base metal refining in the western BIC. The Ni concentrations measured during the braai experiment were similar than the annual average Ni levels measured at the western BIC.
Water-soluble anion and cations were also quantified. As is evident from the results indicated in Fig. 13, sulphate (SO42-) was the dominant anionic species, while calcium (Ca2+) and magnesium (Mg2+) were the dominant cationic species. It was also obvious that most of the water-soluble species occurred in the PM1 fraction, while the concentrations of the cations and anions decreased with an increase in particle size. This can be attributed to the freshness of the plume emanating from the braais.
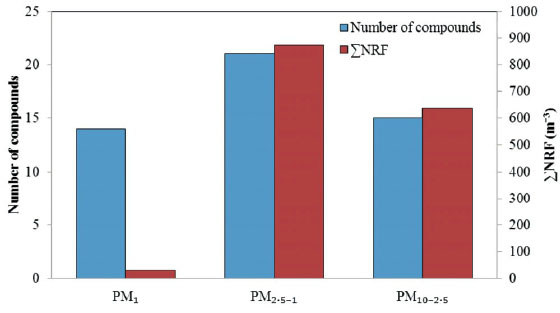
As previously mentioned, aerosols were also collected on quartz filters during the first braai experiment in order to identify organic compounds with GCxGC-TOFMS. Similar to trace metal measurements, aerosol samples were not collected prior to and after the braai experiment for organic compound characterization. The results can, however, be compared to a one-year samplingcampaign conducted by Booyens el al. at Welgegund.15 In Fig. 14a, the total number of compounds pre-identified in each of the size fractions and their corresponding SNRF are presented. A significant smaller number of compounds were pre-identified for the braai experiment, i.e. 50, compared to the 1056 organic compounds pre-identified by Booyens el al.15This can be attributed to the difference in sampling periods, i.e. Booyens el al.15collected 24-hour samples, while aerosol samples were only collected for ~2 hours. In addition, the number of organic compounds presented by Booyens el al.15was the combined number of organic compounds pre-identified for the entire one-year sampling campaign. It is also not possible to completely ascertain whether organic compounds pre-identi-fied were exclusively from the braai experiment. The largest number of compounds pre-identified was in the PM2.5-1 fraction, which also had the highest SNRF. Booyens el al. also indicated that the largest number of compounds and highest SNRF were in the PM2M fraction.15 However, blow-off of semi-VOCs is likely to occur for the PM1 fraction that can contribute to an underestimation of the number of compounds and SNRF of species in this fraction.32 The higher SNRF determined for particulates smaller than 2.5 μm indicate that these organic compounds can potentially be more harmful to human health compared to larger particles.
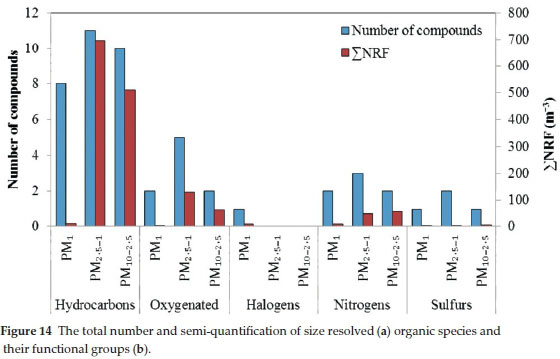
In Fig. 14b, the number of compounds and the SNRF of the different classes of organic functional groups are presented. The largest number of compounds detected was hydrocarbons in all the size fractions, while the second, third and fourth largest numbers of species were oxygenated, N- and S-containing compounds, respectively. Very few halogen-containing species were detected. The highest accumulated SNRF were determined for hydrocarbon species in the PM2.5-1 and PM10-2.5 fractions, while oxygenated and N-containing species were the second most abundant with similar SNRFs in the PM25-1 and PM10-2.5 fraction. In the study conducted by Booyens et al., the largest number of organic compounds determined with the highest SNRF was oxygenated species that were indicative of aged air masses.15 The higher occurrence of hydrocarbon species is expected for primary aerosols emitted from a fresh burning plume. The main organic compound contributing to the relatively high accumulated concentration of the hydrocarbon species in the PM2.5-1 and PM10-2.5 fraction was accession the predominant oxygenated and N-containing species contributing to the SNRFs were diisooctyl phthalate and 4H-1,2,4-triazol-4-amine, respectively. Oxidative decomposition of the fatty acids, especially unsaturated species, can be considered to be a source for many organic compound groups, including hydrocarbons, aldehydes, ketones, alcohols, esters, furans and lactones.17
5. Conclusions
According to the knowledge of the authors, this is the most comprehensive investigation of atmospheric species in a typical South African braai plume. Both air quality and climatically important aspects were considered.
Compared to background concentrations, SO2, NO and NO2, and CO increased significantly during the braai experiment, although they remained well below the ambient air quality limits. O3 concentrations did not increase notably during the braai, although O3 levels fluctuated more than usual. The predominant VOC species detected were aromatics and alkanes, with elevated levels observed during the fire and smoke, as well as grill phases. Benzene was higher than the proposed future South African one-year ambient air quality limit during the fire and smoke, and grill phases. These short-term elevated levels duringa typicalbraaicantherefore notbe used to quantifypossible negative impacts on human health.
The PM10 mass concentrations increased during the fire and smoke phase, and even more significantly during the grill phase. Elevated PM10 levels during the fire and smoke phase, and grill phase were attributed to emissions of primary aerosols associated with the incomplete combustion of charcoal and dripping fat, respectively. A comparison of PM10 with the 24-hour ambient standard limits indicated that PM10 is, especially, problematic during the grill phase. However, due to the relatively short duration of a typical braai, PM10 concentrations cannot be compared directly to standard limit values. The total number of sub-micron particles increased after the firelighters were lit and reached a maximum of 250 000 cm-3 at the end of the fire and smoke phase. A comparison of PM10 and submicron particle number concentrations indicates that smaller particles are emitted during the fire and smoke phase, while larger particles are mainly emitted during the grill phase.
wo was calculated from scattering and absorption measure ments. The wo was relatively close to one during all phases of the braai with the exception of the initial period of the fire and smoke phase that had somewhat lower wo values. These lower wo values coincided with the peak BC emissions. The results indicate that aerosols emanating from a braai are reflective and have a cooling aerosol direct effect. Particulates emitted from braai could also act as cloud condensation nuclei, which, through the indirect effect, can have a net cooling effect.
In total, 32 trace elements were analyzed for. The highest trace metal concentrations were associated with trace elements typically present in ash. 46 % of the total trace metal mass percentage could be attributed to the PM25-1 size range. The Pb concentration was higher than the South African and European annual ambient air quality limit, while V, Ni, As and Cd exceeded European annual ambient air quality limits. However, the ~2.5-hour duration of the braai cannot be compared directly to these annual limits. SO42- was the dominant anionic, while Ca2+ and Mg2+ were the dominant cationic water-soluble species present in the braai aerosols. The PM1 size fraction also had the largest water-soluble cation and anion load.
The largest number of organic compounds pre-identified from GCxGC-TOFMS analysis was in the PM2.5-1 fraction that also had the highest concentration, although blow-off of VOCS is likely to occur for the PM1 fraction. The largest number of compounds detected was hydrocarbon species in all the size fractions. Few oxygenated, N- and S- containing species were detected. Hydrocarbon species in the PM2.5-1 fraction had the highest accumulated SNRF. The main organic compounds that contributed to the relatively high accumulated concentration of the hydrocarbon species in PM2.5-1 and PM10-2.5 fraction were icosane. The dominant oxygenated and N-containing species were diisooctyl phthalate and 4H-1,2,4-triazol-4-amine, respectively.
In general, the results indicated that for a recreational braai no significant health-related risks occur due to the relatively short exposure period. However, if these short-term results are extrapolated to longer exposure periods that are experienced by occupational vendors on a daily basis, it is evident that health-related risks significantly increase. In addition, semi-formal and informal cooking practices also expose large numbers of people to both indoor and outdoor emissions that would be expected to be similar to the results presented here. Although some negative aspects might be associated with long-term exposure to braai plumes, the net climatic aerosol direct effect seems to be cooling. However, the climatic effects of long- and short-lived greenhouse gases (GHGs) were not evaluated in this study.
Our final conclusion and recommendation is: Braai our beloved country!
References
1 G. King, The Hansie Cronjé Story: An Authorized Biography, Global Creative Studios, Brackenfell, 2005. [ Links ]
2 C.H. Van Heerden, An exploratory analysis of leisure caravanning in the Kruger National Park in South Africa. Innovative Marketing, 2010, 6(1), 66-72. [ Links ]
3 T. Morrison and W.A. Conaway, Kiss, Bow, or Shake Hands: the Bestselling Guide to Doing Business in More than 60 Countries, 2nd edn., Adams Media, Massachusetts, 2006. [ Links ]
4 A.D. Venter, V. Vakkari, J.P. Beukes, P.G. van Zyl, H. Laakso, D. Mabaso, et al., An air quality assessment in the industrialized western Bushveld Igneous Complex, South Africa, S. Afr. J. Sci., 2012, 108(9/10), 1-10,Art. #1059,10pages,doi: 10.4102/sajs.v108i9/10.1059 [ Links ]
5 P. Maritz, J.P. Beukes, P.G. van Zyl, E.H. Conradie, C. Liousse, C. Galy-Lacaux, et al., Spatial and temporal assessment oforganic and black carbon at four sites in the interior of South Africa, Clean Air J., 2015, 25, 20-33. [ Links ]
6 E. Muchapondwa, A cost-effectiveness analysis of options for reducing pollution in Khayelitsha township, South Africa, J. Transdisciplinary Res. Southern Afr, 2010, 6(2), 333-358. [ Links ]
7 P. Harris, On charcoal, Interdisciplinary Sci. Rev., 1999, 24(4), 301-306, doi: http://dx.doi.org/10.1179/030801899678966 [ Links ]
8 M. Rahman and K. Kim, Release of offensive odorants from the combustion ofbarbecue charcoals, J. Hazard. Mat. ,2012,215-216,233-242. http://dx.doi.org/10.1016/j.jhazmat.2012.02.055 [ Links ]
9 E. Kabir, K.H. Kim and H.O. Yoon, Trace metal contents in barbeque (BBQ) charcoal products, J. Hazard. Mat., 2011, 185(2-3), 1418-1424, http://dx.doi.org/10.1016/j.jhazmat.2010.10.064 [ Links ]
10 U. Pöscle, Atmospheric aerosols: composition, transformation, climate and health effects. Angewandte Chemie, 2005,44, 7520-7540, doi:10.1002/anie.200501122 [ Links ]
11 E. Kabira, K. Kima, J. Ahna, O. Honga and J.R. Sohnb, Barbecue charcoal combustion as a potential source of aromatic volatile organic compounds and carbonyls, J. Hazard. Mat., 2009,174(2010), 492-499, http://dx.doi.org/10.1016/j.jhazmat.2009.09.079 [ Links ]
12 J.P. Beukes, V. Vakkari, P.G. van Zyl, A.D. Venter, M. Josipovic, K. Jaars, et al., Source region plume characterization of the interior of South Africa, as observed at Welgegund, Clean Air J., 2013, 23, 7-10. [ Links ]
13 K. Jaars, J.P. Beukes, P.G. Van Zyl, A.D. Venter, M. Josipovic, J.J. Pienaar, et al., Ambient aromatic hydrocarbon measurements at Welgegund, South Africa, Atmos. Chem. Phys., 2014, 14, 7075-7089, doi:10.5194/acp-14-7075-2014. [ Links ]
14 P. Tiitta, V Vakkari, M. Josipovic, P. Croteau, J.P. Beukes, P.G. Van Zyl, et al., Chemical composition, main sources and temporal variability of PM1 aerosols in southern African grassland, Atmos. Chem. Phys., 2014, 14, 1909-1927, doi:10.5194/acp-14-1909-2014 [ Links ]
15 W. Booyens, P.G. van Zyl, J.P. Beukes, J. Ruiz-Jimenez, M. Kopperi, M. Riekkola, et al., Size-resolved characterization of organic compounds in atmospheric aerosols collected at Welgegund, South Africa, J. Atmos. Chem.,2014,72,43-64,doi:10.1007/s10874-015-9304-6 [ Links ]
16 V. Vakkari, V.M. Kerminen, J.P. Beukes, P. Tiitta, P.G. van Zyl, M. Josipovic, et al., Rapid changes in biomass burning aerosols by atmospheric oxidation, Geophys. Res. Lett., 2014, 41: 2644-2651. doi:10.1002/2014GL059396 [ Links ]
17 W.F. Rogge, L.M. Hildemann, M.A. Mazurek, G.R. Cass and B.R.T. Simoneit, Sources of fine organic aerosol. 1. Charbroilers and meat cooking operations, Environ. Sci. Technol., 1991, 25, 1112-1125, doi: 10.1021/es00018a015 [ Links ]
18 E. Kleynhans, J.P. Beukes, P.G. van Zyl, P. Kestens and J. Langa, Unique challenges of clay binders in a pelletized chromite pre-reduction process, Miner. Eng., 2012, 34, 55-62, http://dx.doi.org/10.1016/j.mineng.2012.03.021 [ Links ]
19 T. Petäjä, V. Vakkari, T. Pohja, T. Nieminen, H. Laakso, P.P. Aalto, et al., Transportable aerosol characterization trailer with trace gas chemistry: design, instruments and verification. Aerosol Air Quality Res., 2013, 13, 421-435, doi: 10.4209/aaqr.2012.08.0207 [ Links ]
20 A.P. Hyvärinen, V. Vakkari, L. Laakso, R.K. Hooda, V.P. Sharma, T.S. Panwar, et al., Correction for a measurement artifact of the Multi-Angle Absorption Photometer (MAAP) at high black carbon mass concentration levels, Atmos. Meas. Tech., 2013, 6, 81-90, doi: 10.5194/amt-6-81-2013 [ Links ]
21 A. Petzold and M. Schonlinner, Multi-angle absorption photometry a new method for the measurement of aerosol light absorption and atmospheric black carbon. J. Aerosol Sci., 2004, 23, 421-441, http://dx.doi.org/10.1016/j.jaerosci.2003.09.005 [ Links ]
22 L. Laakso, V. Vakkari, H. Laakso, A. Virkkula, M. Kulmala, J.P. Beukes, et al., South African EUCAARI measurements: seasonal variation of trace gases and aerosol optical properties, Atmos. Chem. Phys., 2012, 12, 1847-1864, doi:10.5194/acp-12-1847-2012 [ Links ]
23 H. Hellen, P. Kuronen and H. Hakola, Heated stainless steel tube for ozone removal in the ambient air measurements of mono- and sesquiterpenes. Atmos. Environ., 2012, doi:10.1016/j.atmosenv.2012. 04.019 [ Links ]
24 P.G. van Zyl, J.P. Beukes, G. Du Toit, D. Mabaso, J. Hendriks, V. Vakkari, et al., Assessment of atmospheric trace metals in the western Bushveld Igneous Complex, South Africa. S. Afr. J. Sci., 2014,3/4(110), Art. # 2013-0280,11 pages, http://dx.doi.org/10.1590/sajs.2014/20130-280 [ Links ]
25 P.C. Mouli, S.V. Mohan, V. Balaram, M.P. Kumar and S.J. Reddy, A study on trace elemental composition of atmospheric aerosols at a semi-arid urban site using ICP-MS technique. Atmos. Environ. 2006, 40, 136-146, http://dx.doi.org/10.1016/j.atmosenv.2005.09.028 [ Links ]
26 DEA, Department of Environmental Affairs, National Environmental Management: Air Quality Act (Act No. 39 of 2004), Government Gazette, 2009, 6-9. [ Links ]
27 EU, European Commission, Air Quality Standards, Updated April 22, 2015. http://ec.europa.eu/environment/air/quality/standards.htm (accessed July 22, 2015) [ Links ]
28 M.R. Beychok, NOX emission from fuel combustion controlled, Oil Gas J., 1973, 53-56. [ Links ]
29 C.A. Pope and D.W Dockery, Health effects of particulate air pollution: lines that connect, Air Waste Management Assoc. 2006, 56, 709-742, doi:10.1080/10473289.2006.10464485 [ Links ]
30 S. Taner, B. Pekey and H. Pekey, Fine particulate matter in the indoor air of barbeque restaurants: elemental compositions, sources and health risks, Sci. Total Environ., 2013,454-455,79-87. http://dx.doi.org/10.1016/j.scitotenv.2013.03.018 [ Links ]
31 J. Susayaa, K. Kima, J. Ahna, M. Junga and C. Kangb, BBQ charcoal combustion as an important source of trace metal exposure to humans, J. Hazard. Mat., 2010, 176(1-3), 932-937. http://dx.doi.org/10.1016/j.jhazmat.2009.11.129 [ Links ]
32 P.B.C. Forbes, E.W. Karg, G.N.S.A. Geldenhuys, R. Zimmerman and E.R. Rohwer, Characterization of atmospheric semi-volitile organic compounds, in IUAPPA World Clean AIR Congress, Cape Town, 2013, p. 96. [ Links ]
Received 30 March 2015
Revised 26 June 2015
Accepted 1 July 2015
* To whom correspondence should be addressed. E-mail: pieter.vanzyl@nwu.ac.za

