


Services on Demand
Article
 English (pdf)
 Article in xml format
 Article references
Indicators

Related links
-
 Cited by Google
 -
 Similars in Google
Share

 Permalink
South African Journal of Chemistry
On-line version ISSN 1996-840X
Print version ISSN 0379-4350
S.Afr.j.chem. (Online) vol.68 Durban 2015
http://dx.doi.org/10.17159/0379-4350/2015/V68A17
RESEARCH ARTICLE
Adsorption of Rhodamine B dye from aqueous solution on Irvingia gabonensis biomass: Kinetics and thermodynamics studies
Adejumoke A. InyinborI, II, *; Folahan A. AdekolaII; Gabriel A. OlatunjiII
IDepartment of Physical Sciences, Landmark University, P.M.B. 1001, Omu Aran, Nigeria
IIDepartment of Industrial Chemistry, University of Ilorin, P.M.B. 1515, Ilorin, Nigeria
ABSTRACT
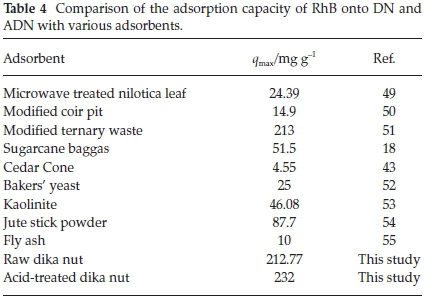
Raw Irvingia gabonenses (dika nut) (DN) and its acid-treated form (ADN) were used for the uptake of rhodamine B (RhB) dye from aqueous solution. The adsorbents were characterized by Fourier transform infrared (FTIR) spectroscopy, Brunauer-Emmett-Teller (BET) surface area analysis and scanning electron microscopy (SEM). The adsorbents were found to have characteristic functional groups such as -OH, C-N and C=O. SEM revealed that acid treatment resulted in the development of several pore sizes. Sorption data fitted the Freundlich adsorption isotherm better than the Langmuir isotherm. The maximum sorption capacities, qmax, obtained from the Langmuir adsorption isotherm were 212.77 and 232 mg g-1 for DN and ADN, respectively. The pseudo-second-order kinetics model was observed to fit the adsorption data. Solution pH and temperature significantly influenced the adsorption process and negative values of DG° suggest that the sorption process was spontaneous and feasible. Intraparticle diffusion mainly controlled the uptake of RhB onto DN and ADN; however, boundary layer diffusion also occurred in the RhB-ADN system. The desorption efficiency of RhB from the adsorbents was tested with a number of eluents. The eluents were found to follow the order: H2O>CH3COOH>HCl and CH3COOH>HCl>H2O for DN and ADN, respectively.
Keywords: Irvingia gabonenses, adsorption, rhodamine B, thermodynamics, kinetics, biomass.
1. Introduction
Textile industries use large volumes of water in their operations and thus release large amounts of waste water. Waste waters from textile industries are unique in their composition;they are usually released containing various dyes and heavy metals.1 In particular, the dyes tend to be reactive dyes since these have such qualities that make them a preferred option in textile industries. However, they have been reported to be the most problematic of all dyes used in these industries.2,3 Their high solubility makes their treatment by conventional methods difficult.2,3 The effects of dyes in the water body are not limited to toxicity, but also include reduction in dissolved oxygen and interruption of photosynthetic processes. Most of the reactive dyes, including rhodamine B, used in the textile and allied industries are known to be carcinogenic.4,5
Among the various conventional methods of waste water treatment, adsorption has been found to combine economic advantage, design and operational simplicity, and with the uptake of very low concentration of toxicants.6 Activated carbons have been employed in effluent treatment over the years and have been found to exhibit great affinity for organic compounds.7 However, due to the precursors used for the preparation of commercial activated carbons, it has been found to be economically unviable and therefore other precursors are being sought.1,8,9
Agricultural wastes and other waste materials, such as coconut husk and bunch waste,8,10 date stone,11 jujuba seed,12 peanut hulls and its immobilized form,13 cocoa pod husk,14 cashew nut shell,15 periwinkle shell,16 garlic peel,17 sugar cane bagasse,18 calcined egg shell,19 bagasse pith,20 olive waste cake,21 apple wastes,22 Bengal gram seed husk,23 oil palm fruit waste,24 castor bean cake,25 maize stem tissue26 and lignite27 have been utilized as cheap alternatives for activated carbon preparation as well as low cost adsorbents in the uptake of dyes.
Irvingia gabonensis (sweet bush mango, also known as Dika nut) is common in the southwestern part of Nigeria. It is a drupe with a thin epicarp, a soft fleshy thick mesocarp and a hard endocarp encasing a soft dicotyledonous kernel.28,29 Sweet bush mango in all its part serves as food for humans with the exception of its endocarp; the mesocarp and the epicarp can be eaten fresh while the cotyledon encased in the endocarp serves as an ingredient for soup. The endocarp, however, is a waste and its use as an adsorbent will result in waste reduction and economic advantages. The characteristics of adsorbents generally depend on the type of treatment employed in theirpreparation;chemical treatments such as acid treatment usually result in large pores which are suitable for the removal of large molecules such as dyes.30
Hence, the focus of this work was to investigate the potential of raw Irvingia gabonensis waste and its acid-treated form for the uptake of a cationic dye (rhodamine B). To the best of our knowledge, this biomass has not been given much attention in relation to its application in environmental remediation operations. Operational parameters, kinetics, isothermal and thermodynamic studies governing the adsorption process were investigated.
2. Materials and Methods
2.1. Preparation of Adsorbents
2.1.1. Preparation of Raw Dika Nut (DN)
Endocarps of Irvingia gabonensis were collected from farmers in Omu Aran, Kwara State of Nigeria. The biomass was thoroughly washed to remove dirt and dried in an oven operated at 105 °C overnight. It was then pulverized and screened into a particle size of 150-250 before it was stored in an airtight container for subsequent use.
2.1.2. Preparation of Acid-treated Dika Nut (ADN)
An equal volume to mass ratio of concentrated sulphuric acid and the biomaterials was thoroughly mixed in a clean beaker and was subjected to thermal treatment (200 °C) for 2 h with continuous agitation for one hour. About 10 cm3 of deionized water was injected into the carbon material, the carbon material obtained was allowed to cool to room temperature, washed to neutrality, soaked in8MKOHand heated at 200 °C for another one hour. It was then washed thoroughly with deionized water to neutrality, dried in the oven at 105 °C and stored in a tightly sealed container for subsequent use.
2.2. Adsorbent Characterization
2.2.1. Surface Area and Average Pore Diameter
BET surface area and average pore diameter were determined by using a Micromeritrics Tristar II surface area and porosity analyzer. Samples were degassed under vacuum at 90 °C for 1 h and subsequently the temperature was further increased to 200 °C overnight.
2.2.2. Surface Morphology and Elemental Composition
Surface morphology and elemental composition were determined by using a FEIESEM Quanta 200 for SEM and EDX.
2.2.3. Functional Group Analysis
Functional groups were determined with a Bruker Alpha FTIR spectrometer.Discs were prepared byfirst mixing 1 mg of each of the dried samples with 500 mg of KBr (Merck, for spectros-copy) in an agate mortar and the resulting mixture was subsequently pressed at 10 tonnes cm-2 for 15 min under vacuum.
2.2.4. pH point of Zero Charge (pHpzc)
The pH point of zero charge determination (pHpzc)of the adsorbents was carried out bycontacting 0.1 g of each adsorbent with 50 cm3 of 0.1 M NaCl whose initial pH had previously been adjusted between pH 2 and 10 with either NaOH or HCl. The containers were sealed and placed on a shaker for 24 h after which the final pH values were measured. The difference between the initial and final pH was calculated and plotted against the initial pH. The point of intersection of the resulting curve with vertical axis gave the pHpzc.12
2.2.5. pH Determination
The standard test method for determination of activated carbon pH ASTMD 3838-80 was used. About 1.0 g of the prepared adsorbent was weighed and transferred into a beaker; 100 cm3 of distilled water was added and the mixture was stirred for 1 h. The suspension was allowed to equilibrate and the pH was measured thereafter with a pH meter (model pHS-25).
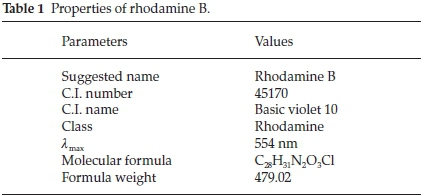
2.3. Adsorbate Preparation
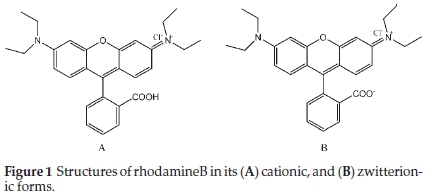
Rhodamine B (RhB) supplied by BDH was used to investigate the adsorptive properties of the adsorbents prepared. Table 1 shows the properties of rhodamine B and Fig. 1 shows the structures of rhodamine B in its cationic and zwitterionic forms. A parent solution of 1000 mg L-1 of RhB was prepared by dissolving 1 g of RhB in 1000 cm3 of deionized water. Subsequently, all other working solutions with lower concentrations were prepared there from by serial dilution.
2.4. Batch Adsorption Studies
Batch adsorption studies with respect to influence of initial pH, initial dye concentration, adsorbent dosage and temperature were carried out.
2.4.1. Effect of Solution pH
The pH of a solution is an important parameter in adsorption studies; it determines the charge on the adsorbent surface as well as the form the adsorbate will exist in solution.The initial pH of the adsorbate solution was adjusted between 2 and 10 by using HCl and NaOH (0.1 M). Other conditions such as adsorbent dose, agitation speed, temperature, contact time and initial adsorbate concentration were maintained at 1 gL-1, 130 rpm, 26 ± 2 °C, 120 min and 100 mg L-1, respectively. The percentage removal of adsorbent was then calculated according to Equation 1. The optimum pH obtained was used in subsequent adsorption studies,
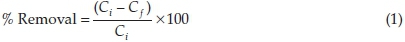
where Ciand Ci are concentrations of RhB in solution at the start and end of the experiment, respectively.
2.4.2. Effects of Initial Adsorbate Concentration and Contact Time
Adsorption processes were carried out by agitating a givendose (0.1 g) of the adsorbent with 100 mL of RhB solution of desired concentration in different 250 cm3 flasks in a temperature controlled water bath shaker. A shaking speed of 130 rpm was maintained throughout the experiments to achieve equilibrium. Samples were withdrawn at different time intervals (0-36 h depending on the adsorbent), centrifuged and the supernatant was analyzed for the change in the dye concentration by using a UV-visible spectrophotometer (Beckman Coulter Du 730 UV/Vis spectrophotometer). The absorbance measurements were made at the λmax of RhB that was determined to be 554 nm. The quantity of dye adsorbed at a given time qt(mg g-1) was calculated with Equation 2:

where Ciand Ct are the concentrations (mg L-1) of RhB in solution initially and at time t, V is the volume in litres and M is the mass of the adsorbent in g.
2.4.3. Effect of Adsorbent Dosage
The adsorbent dosage was varied between1gL-1 and5gL-1 for each adsorbent used while other conditions such as agitation speed, temperature, contact time and initial adsorbate concentration were maintained at 130 rpm, 26 ± 2 °C, 240 min and 100 mg L-1, respectively.
2.5. Adsorption Isotherms
Adsorption data werefitted to the Langmuir, Freundlich, Temkin and Dubinin-Radushkevich (D-R) isotherm models, and the isotherm parameters were calculated and reported accordingly.
2.5.1. Langmuir Isotherm Model
The linearized Langmuir adsorption model is expressed by Equation 3:31
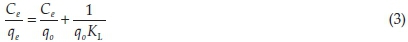
where Ceis the concentrationofRhB dye inthe solution at equilibrium (mg L-1), qeis the concentration of RhB dye on the adsorbent at equilibrium (mg g-1), qe is the monolayer adsorption capacity of adsorbent (mg g-1) and Klis the Langmuir adsorption constant (L mg-1). The plot of Ce/qe versus Ceshould give a straight line with a slope 1/qo and an intercept of 1/qoKL. The favourability of the adsorption process was also confirmed by calculating the dimensionless equilibrium parameter (Rl) expressed by Equation (4):
where C0 is the highest initial dye concentration in solution. The adsorption process is said to be favourable if RL value falls between 0 and 1, i.e (0 < Rl <1), linear when Rl = 1, irreversible when Rl = 0 and unfavourable when Rl > 1.26
2.5.2. Freundlich Isotherm Model
The linearized form of the Freundlich isotherm model is expressed according to Equation 5:32

where qeis the amount of RhB dye adsorbed at equilibrium (mg g-1), Ce is the equilibrium concentration of the adsorbate (mg L-1); Kf and n are constants incorporating the factors affecting the adsorption capacity and the degree of non-linearity between the solute concentration in the solution and the amount adsorbed at equilibrium, respectively. The plots oflog qe against log Ce should give a linear graph where the values of n and Kf can be obtained from the slope and intercept of the graph, respectively.
2.5.3. Temkin Isotherm Model
The Temkin isotherm, which can be expressed by Equation (6), contains a factor that takes into account the adsorbent-adsorbate interactions33.

where qeis the amount of adsorbate adsorbed at equilibrium (mg g-1), Ceis equilibrium concentration of adsorbate (mg L-1), B is a constant related to the heat of absorption given as B = RT/b, b is the Temkin constant (J mol-1), T is the absolute temperature (K), R is the gas constant (8.314 J mol-1 K-1), and A is the Temkin isotherm constant (L g-1). B and A can be calculated from the slope (B) and intercept (B ln A) of the plot of qe against ln Ce.
2.5.4. Dubinin-Radushkevich Isotherm Model
The Dubinin-Radushkevich (D-R) model is a more general model that does not assume a homogenous surface or constant adsorption potential. The D-R model gives information about the sorption mechanism, whether chemisorption or physisorption,34 and it is expressed by Equation 7:

where qe is the amount of RhB ions adsorbed per unit mass of adsorbent (mg g-1), qo is the maximum sorption capacity, b is the activity coefficient related to the mean sorption energy E (kJ mol-1) and e is the Polanyi potential. e is expressed by Equation 8:
where R is the gas constant (J mol-1 K-1) and T is the temperature (K). β(mol2 J2) and qocan be obtained from the slope and the intercept of the plot of lnqeagainst ε2, respectively.
2.6. Adsorption Kinetics
Adsorption data were tested by using the pseudo-first-order, pseudo-second-order and the intraparticle diffusion models.
2.6.1. Pseudo-first-order Kinetics Model
The pseudo-first-order kinetics model of Lagergren is given by Equation 9:35

where qe and qt are the quantity absorbed at equilibrium and at time t, respectively (mg g-1), and ki is the rate constant for the pseudo-first-order sorption (min-1). A plot of ln (qe - qt) against t for ADN and DN at different concentrations should give linear graphs with negative slopes from which ki and calculated quantity adsorbed at equilibrium (qe,cal) can be obtained from the slope and intercept, respectively.
2.6.2. Pseudo-second-order Kinetics Model
The pseudo-second-order kinetics model is given by Equation 10:36

where k2is the rate constant of the pseudo-second-order equation in g mg-1 min-1, qeis the maximum sorption capacity in mg g-1 and qt (mg g-1) is the amount sorbedat time t. Integration and rearrangement of Equation 10 above will give a linear form:

A plot of t/qtagainst t should give a linear graph from which qeand k2can be calculated from the slope and intercept.
2.6.3. Validity of Kinetics Models
The normalized standard deviation, ∆qe(%) which is expressed by Equation 12 was used to verify the kinetics model used to describe the adsorption process.
where N is the number of data points, and qe, exp and qe, cal (mg g-1) are the experimental and calculated values of the quantity adsorbed at equilibrium, respectively. A lower value of ∆qeindicates a good fit between the experimental and calculated data.
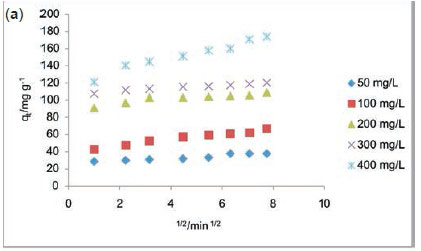
2.6.4. Intraparticle Diffusion Model The intraparticle diffusion model is given by the equation:37

where qt (mg g-1) is the amount of RhB dye sorbed at time t and Kdiff (mgg-1 min-172) is the rate constant for intraparticle diffusion. The value of C explains the thickness of the boundary layer, the larger the intercept the greater the boundary layer effect. Aplot of qt versus t05 should give a linear graph if intraparticle diffusion is involved in the sorption process and if the plot passes through the origin then intraparticle diffusion is said to be the sole rate-limiting step. However, qtversus t0.5could give a multilinear plot which suggests that two or more steps govern the sorption process.38
2.7. Adsorption Thermodynamics
The adsorption of RhB onto DN and ADN was investigated as a function of temperature and the thermodynamic parameters ∆G°, ∆Η° and ∆S°, which are important in determining the feasibility, spontaneity and the nature of adsorbate-adsorbent interactions, can be obtained by using the following mathematical relations:
where Kois given as qe/Ce, T is the temperature in Kelvin and R is the gas constant. A plot of lnKo versus 1/T should give a linear plot and ΔΗ° and ΔS° can be calculated from the slope and intercept, respectively.
2.8. Desorption of RhB from DN and ADN
Desorption experiments were performed to better understand the mechanisms of biosorption involved on the surface of the adsorbent and the possibility of regeneration of the adsorbent. The ability of a particular eluent to strip the adsorbate depends on the adsorbate-adsorbent interaction, namely, the effects of the eluent on the bond formed. If desorption can be achieved by using neutral pH water, then the dye is weakly attached to the adsorbent, if sulphuric acid or alkaline water desorb the dye, then the adsorption is by ion exchange, and if desorption of dye from the surface of the adsorbent is achieved with an organic acid, such as acetic acid, then the dye is chemisorbed to the adsorbent.39 In order to investigate the leaching/desorption of RhB from DN and ADN, deionized water, 0.1 M HCl and 0.1 M CH3COOH were used as desorbing agents. A mass of 0.1 g of fresh adsorbent was added to 100 mL of 100 mg L-1 RhB solution at pH 3.0 and shaken for 1 h and 24 h for DN and ADN, respectively. The RhB-loaded sorbents were separated by centri-fugation and the residual RhB concentration was determined by spectrophotometry as described. The RhB-loaded sorbents were washed gently with water to remove any unadsorbed dye and dried. The desorption process was carried out by mixing 100 mL of each desorbing agent with the dried sorbent and shaken for a predetermined time. The desorbed RhB was determined spec-trophotometrically. The desorbing efficiency was then calculated by using Equation (16):
Desorption efficiency 
where qdeis the quantity desorbed by each eluent and qad is the quantity adsorbed by the adsorbent during loading.
3. Results and Discussion
3.1. Characterization of Adsorbents
Surface morphology, surface area and surface chemistry are pointers to the efficacy of adsorbent(s) in contaminant(s) uptake. These characteristics are discussed in this section.
3.1.1. Surface Area and Pore Characteristics
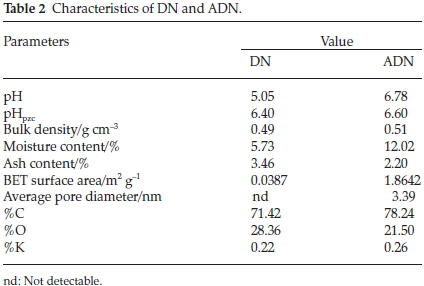
Table 2 depicts the characteristics of DN and ADN. The values of Brunauer, Emmett and Teller (BET) surface area of the adsorbents are low: 0.0387 m2 g-1 and 1.8642 m2 g-1 for DN and ADN, respectively. The low surface area of these adsorbents suggests that DN and ADN do not possess the microporous characteristics of an activated carbon and therefore dye uptake is likely to be via functional group interaction, pores and available surface. Low surface area is a characteristic of agro-waste and this has been previously reported.18,40 The increase in surface area after acid treatment can be attributed to the cleaning of the cell walls by acid which resulted in the removal of some polar functional groups on the surface of the biomaterial. The KOH treatment also contributes to the increase in the surface area of ADN.41 Elemental analysis revealed an increase in the carbon content and a decrease in the oxygen content of ADN suggesting the extraction of hemicellulose and lignin via alkaline treatment.47
3.1.2. Functional Groups
The FTIR spectra obtained for the two materials are presented in Figs 2 and 3. DN shows strong absorption bands at 1023.96 cm-1, which corresponds to C-N stretching, 1229.23 cm-1 (C-OH stretching), 1369.41 cm-1 (CH3 bending), 1506.72 -1597.24 cm-1 (C=O of amide), 1732.64 cm-1 (C=O of ester), 2923.36 cm-1 (-C-H stretching) and 3338.60 cm-1 (-OH) (Fig. 2a). However, after sorption there was a shift and intensity decrease in the bands of -OH, C=O of amide, C=O of ester and C-OH to 3421.83 cm-1,1508.38-1593.25 cm-1,2937.68 cm-1 and 1269.20 cm-1, respectively (Fig. 2b). Various functional groups available on the surface of DN have been reported to be suitable in dye uptake, the band shift and decrease in band intensities suggests that these functional groups were utilized for sorption.42 New peaks appeared at 1647.26 and between 617.24-898.86 cm-1, which correspond to carboxylate ions and aromatic vibrations, respectively (Fig. 2b). For ADN, the -OH band appeared at 3389.32 cm-1. Other characteristic functional group bands such as 1036.58 cm-1 (C-N stretching), 1211.54 cm-1 (C-OH stretching), 1361.59 cm-1 (CH3 bending), 1569.02 cm-1 (C=O of amide) are also present (Fig. 3a). After sorption, there is a shift in the -OH, C=O of amide and C-OH bands to 3443.05 cm-1, 1589.40 cm-1 and 1379.15 c-1, respectively (Fig. 3b).
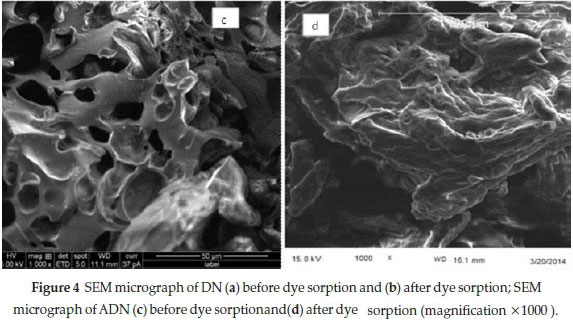
3.1.3. Surface Morphology
Figure 4 shows the scanning electron micrographs of DN and ADN. The surface of DN is rough with no visible openings and has a fibre-like structure which is a characteristic of agro-waste (Fig. 4a). However, ADN has openings of different sizes (Fig. 4c). These pores are as a result of acid and KOH treatment and these openings could act as transport pores for the dye molecules. After adsorption, the pores earlier observed on the surface of ADN have been covered by the adsorbate molecules (Fig. 4d).

3.2. Batch Adsorption Studies
3.2.1. Effect of Solution pH on the Uptake of RhB onto DN and ADN The pH of the solution greatly influences the adsorption process. The nature of the adsorbate in solution as well as the charge on the surface of the adsorbent is pH dependent. The effects of solution pH on the adsorption of RhB onto DN and ADN were investigated within the pH range of 2-10, the pH of the solution was adjusted by using either 0.1 M HCl or 0.1 M NaOH and the resultsare presented in Fig. 5.
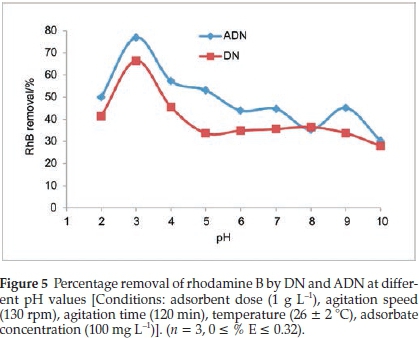
Maximum adsorption was recorded at pH 3, where the uptake of RhB onto ADN and DN were 77 % and 66.52 %, respectively, while minimum adsorption occurred at pH 10, i.e. 30.3 % and 27.91 % for ADN and DN, respectively. The high adsorption at pH 3 can be attributed to the change in the nature of RhB in the different solution media. The change in pH results in the formation of different ionic species and of notable importance is the zwitterionic form (Fig. 1b) which occurs at pH > 3.7 (pKa = 3.7). At pH > 3.7, the attractions between the carboxyl and xanthene groups of RhB monomers result in the formation of dimers of RhB hence absorption of RhB becomes difficult resulting in a decrease in the sorption capacity. Maximum sorption of RhB at a pH between 3 and 4 has been previously reported.43,44
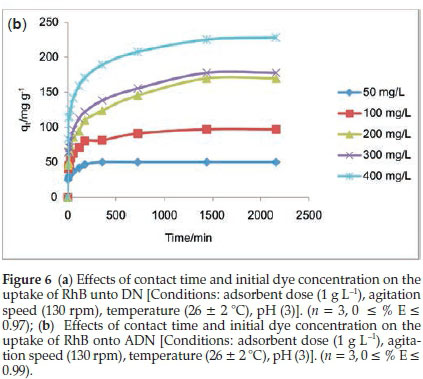
3.2.2. Effect of Contact Time and Initial Dye Concentration on the Uptake of RhB onto DN and ADN
Figures 6a and 6b depict the adsorbate-adsorbent interactions as a function of time and concentration (50-400 mgL-1). The uptake of RhB by DN (Fig. 6a) was observed to be rapid; the quantity adsorbed at a given time t (qt) increased with increase in initial dye concentration, equilibrium was attained at 60 min for initial RhB concentrations between 50 and 300 mg L-1. However, for an initial dye concentration of 400 mg L-1 equilibrium was attained after 60 min. The amount adsorbed at equilibrium increased from 37.73 mg g-1 for an initial dye concentration of 50 mg L-1 to 176.22 mg L-1 for an initial dye concentration of 400 mg L-1. The adsorption of RhB onto ADN increased gradually; for the lowest concentration (50 mg L-1) of RhB considered, equilibrium was attained at about 6 h (360 min). However, equilibrium was attained in 24 h and after 24 h for an initial RhB concentration between 100 and 300 mg L-1, and 400 mg L-1, respectively. The amount adsorbed at equilibrium increased from 96.96 mg g-1 for an initial dye concentration of 100 mg L-1to 228.15 mg g-1 for an initial dye concentration of 400 mg L-1.A higher initial dye concentration enhances the sorption processes as the initial concentration provides an important driving force to overcome mass transfer resistance of RhB between the aqueous and solid phases. Acid treatment greatly enhanced the sorption capacity with about 97 % removal of RhB for 100 mg L-1. Acid treatment usually improves the development of pores in carbon materials and hence increases the sorption capacity; similar trends have been previously reported.45

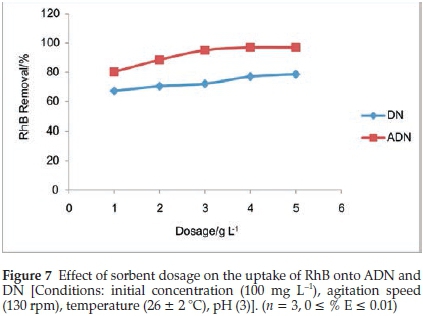
3.2.3. Effect of Adsorbent Dosage on the Uptake of RhB onto DN and ADN
The percentage removal for DN was observed to increase as the sorbent dosage increased over the range of sorbent dosage studied; the percentage removal increased from 67.2 % to 78.69 %. However, for ADN, the percentage sorption increased from 80.33 % to 95.08 % for sorbent dosages of 1 to3gL-and gradually attained equilibrium. The highest percentage removal for DN was 97.05 % (Fig. 7). Additional surfaces are available as a result of the increase in sorbent dose, this must have accounted for the increase in the percentage of RhB dye removal.
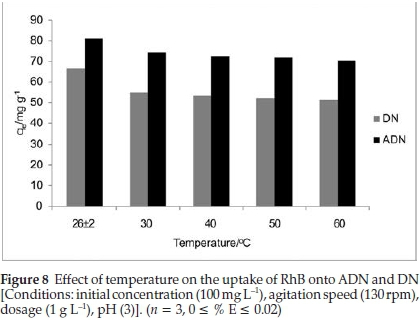
3.2.4. Effect of Temperature on the Uptake of RhB onto DN and ADN The sorption of RhB onto DN and ADN was investigated as a function of temperature with an initial dye concentration of 100 mg L-1. The uptake of RhB was observed to decrease slightly as temperature increased (Fig. 8). As the temperature increased from 303 to 333 K, the uptake of RhB was observed to decrease from 54.86 to 51.23 mg g-1 and from 74.36 to 70.43 mg g-1 for DN and ADN, respectively. The decrease in the percentage adsorbed with increasing temperature suggests that the adsorption process is exothermic in nature; the decrease was found to be gradual for both adsorbents. Weakly bonded molecules are likely to detach from the surface of the adsorbent at high temperature.46,47,48
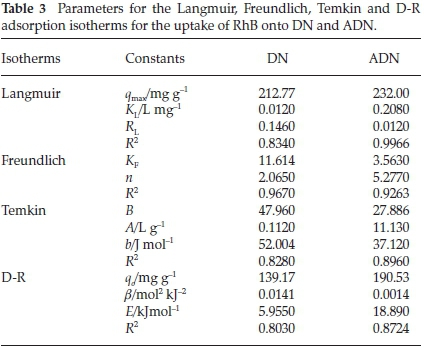
3.2.5. Adsorption Isotherms
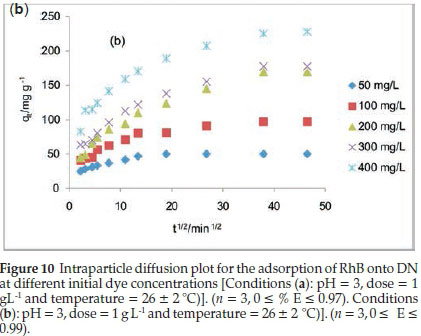
Figure 9 shows the plots of the Langmuir, Freundlich, Temkin and D-R isotherms for the uptake of RhB onto DN and ADN and Table 3 lists the various isotherm parameters as calculated from the slopes and intercepts of the plots. By comparing the R2 values of the four isotherms used, the adsorption data fitted best into the Freundlich adsorption isotherm for DN with a correlation value of 0.967, and the Langmuir isotherm model for ADN with a correlation value of 0.9966. However, the adsorption process is said to be favourable if the RLvalue obtained from the Langmuir isotherm falls between 0 and 1, i.e. 0 <RL< 1, linear when RL=1, irreversible when RL= 0 and unfavourable when RL> 1. In the present study, the values of RLobtained for both DN and ADN (Table 3) are between 0 and 1 which suggests the favourability of the sorption process. The maximum monolayer adsorption capacity (qmax) values obtained for the adsorption of RhB onto DN and ADN were compared with those obtained by using other adsorbents (Table 4) and both DN and ADN exhibited higher performance. Forthe Freundlich isotherm, Kf and n were calculated and the values of n were observed to be greater than 1 which suggests that the adsorption process is favourable. The Temkin constants A, B and b are as listed in Table 3; the R2 for DN and ADN are quite low 0.828 and 0.8957, respectively. The adsorption energy (E) obtained from the D-R isotherm for the adsorption of RhB onto DN and ADN was 5.955 and 18.89 kJ mol-1, respectively. This suggests that while the uptake of RhB onto DN was physical in nature, on the other hand, the adsorption of RhB onto ADN was chemical in nature.41
3.2.6. Kinetics Studies
Table 5 lists the kinetics parameters as obtained from the pseudo-first and pseudo-second-order plots. Apart from the closeness of the qcal values of the pseudo second order with the qexp, the correlation coefficient (R2) for the pseudo second order was found to be generally high ranging from 0.9957to 1 at all RhB dye concentrations studied. The ∆qe was found to be generally low. This suggests that the pseudo-second-order kinetics model describes the adsorption process better. For the intraparticle diffusion model, the uptake of RhB onto ADN at various initial dye concentrations (Fig. 10b) showed a multilinear profile indicating that the sorption process occurred in two phases. The first and steeper portion can be attributed to the boundary layer diffusion of the RhB dye molecule while the second linear portion corresponds to the gradual sorption stage where intraparticle diffusion was the rate limiting step. Ki2, C2 and R2are the slope, intercept and the square of regression of the second linear portion of the plot. Since values for Kil are greater than the observed values for Ki2 (Table 5), this suggests that intraparticle diffusion mainly controls the sorption rate. However, a single linear plot was obtained for the sorption of RhB onto DN (Fig. 10a) and the values of R2range from 0.85 to 0.973 (Table 5) suggesting that the sorption of RhB onto DN may be controlled by the intraparticle diffusion model. A multilinear profile was previously reported for the uptake of Congo red dye onto ackee apple seed.56
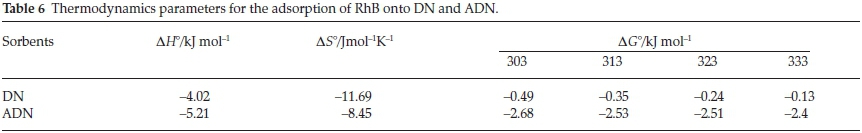
3.2.7. Adsorption Thermodynamics
Thermodynamic parameters obtained for the adsorption process are reported in Table 6. ∆H° and ∆S° were calculated from the slope and intercept of the Van't Hoff plot (Table 6, figures not shown). The negative enthalpy (∆H°) values obtained for the uptake of RhB onto DN and ADN indicate that the sorption process is exothermic in nature. The negative values of DS° (Table 6) indicate a decrease in the randomness at the solid-liquid interface during the sorption of RhB onto DN and ADN. The higher negative value of DS° for the uptake of RhB onto DN suggests that RhB was more stable on the DN surface.57 The negative values of ∆G° suggest that the sorption process was spontaneous; higher negative values at lower temperature suggest that the sorption process at lower temperature was more spontaneous. Similar trends have been previously reported.58
3.2.8. Desorption of RhB from DN and ADN
The desorption efficiency was found to be generally less than 25 %. Water only desorbed 1.75 % of RhB from the loaded ADN while HCl and acetic acid desorbed 2.63 % and 19 %, respectively. The highest desorption efficiency (22.86 %) was recorded for water in the case of DN whereas HCl and acetic acid desorbed 15.24 % and 17.14 %, respectively. For DN, the desorption efficiency of the eluents follows the order: H2O>CH3COOH>HCl; this suggests that while some RhB is weakly attached to the adsorbent (DN) some also penetrates the pores. However, for ADN, chemisorption dominates the sorption mechanism. It has also been reported that a large nett adsorption energy can be established between large molecules and biosorbents due to several contact points; this in turn makes dye release from the surface of the adsorbent difficult.59
4. Conclusions
This study shows that optimum dye removal was at pH 3 for both DN and ADN. Dye removal efficiency was observed to be about 97.05 % and 78.69 % for ADN and DN at adsorbent doses of 4.0 and 5.0 g L-1, respectively. The adsorption process fits better into the pseudo-second-order kinetics for both DN-RhB and ADN-RhB systems. A multilinear profile was observed for the intraparticle diffusion studies of RhB uptake by ADN suggesting that uptake of RhB by ADN was in two phases. The sorption energy obtained from the D-R isotherm for the adsorption process was found to be less than 8 kJ mol-1 for the DN-RhB system and greater than 8 kJ mol-1 for the ADN-RhB system; these suggest that uptake of RhB onto DN was physical in nature while the uptake of RhB onto ADN was chemical in nature. Water was the best desorbing agent for the DN-RhB system while acetic acid desorbed more of RhB from ADN than the other eluents. ADN and DN were found to exhibit higher capacity for the uptake of RhB than many biomaterials reported in the literature.
References
1 B.R. Babu, A.K. Parande, S. Raghu and T.P. Kumar, Cotton textile processing: waste generation and effluent treatment, J. Cotton Sci., 2007,11,141-153. [ Links ]
2 S.W., Won, S.B. Choi, B.W Chung, D. Park, J.M. Park and Yun Y.-S, Biosorptive decolorization of Reactive Orange 16 using the waste biomass of Corynebacterium glutamicum, Ind. Eng. Chem. Res, 2004,43, 7865-7869. [ Links ]
3 Z. Carmen and S. Daniela (2012). Textile Organic Dyes - Characteristics, Polluting Effects and Separation/Elimination Procedures from Industrial Effluents - A Critical Overview, Organic Pollutants Ten Years After the Stockholm Convention - Environmental and Analytical Update, T. Puzyn (Ed.), ISBN: 978-953-307-917-2, InTech, Available from: http://www.intechopen.com/books/organic-pollutants-ten-yearsafter-the-stockholm-convention-environmental-and-analytical-update/textile-organic-dyes-characteristicspolluting-effects-and-separation-elimination-procedures-from-in. [ Links ]
4 S. Rangabhashiyam and N. Anu, Selvaraju, Sequestration of dye from textile industry wastewater using agricultural waste products as adsorbents, J. Environ.Chem. Eng., 2013,1, 629-641. [ Links ]
5 O.S. Bello, I.A. Bello and K.A. Adegoke, Adsorption of dyes using different types of sand: a review. S. Afr. J. Chem., 2013, 66,117-129. [ Links ]
6 K.Y. Foo and B.H. Hameed, A short review of activated carbon assisted electrosorption process: an overview, current stage and future prospects, J. Hazard. Mater., 2009,170, 552-559. [ Links ]
7 F.K. Yuen and B.H. Hameed, Recent developments in the preparation and regeneration of activated carbons by microwaves, Adv. Colloid Interface Sci, DOI: 10.1016/j.cis.2008.12.005 [ Links ]
8 I.A.W. Tan, A.L. Ahmad and B.H. Hameed, Preparation of activated carbon from coconut husk: optimization study on removal of 2,4,6-trichlorophenol using response surface methodology, J. Hazard. Mater., 2008,153, 709-717. [ Links ]
9 T. Santhi, S. Manonmani and T. Smitha, Kinetics and isotherm studies on cationic dyes adsorption onto Annona squmosa Seed Activated Carbon. Int. J. Eng. Sci. Technol, 2010, 2(3), 287-295. [ Links ]
10 B.H. Hameed, D.K. Mahmoud and A.L. Ahmad, Equilibrium modeling and kinetic studies on the adsorption of basic dye by a low-cost adsorbent: coconut (Cocos nucifera) bunch waste, J. Hazard. Mater., 2008, 158, 65-72. [ Links ]
11 M.J. Ahmed and S.K. Dhedan, Equilibrium isotherms and kinetics modeling of methylene blue adsorption on agricultural wastes-based activated carbons, Fluid Phase Equilibria, 2012, 317, 9-14. [ Links ]
12 M.C. Somasekhara Reddy, L. Sivaramakrishnab and A. Varada Reddy, The use of an agricultural waste material, jujuba seeds, for the removal of anionic dye (Congo red) from aqueous medium, J. Hazard. Mater., 2012, 203-204, 118-127. [ Links ]
13 S. Noreen, H.N. Bhatti, S. Nausheen, S. Sadaf and M. Ashfaq, Batch and fixed bed adsorption study for the removal of Drimarine Black CL-B dye from aqueous solution using a lignocellulosic waste: a cost affective adsorbent, Indust. Crops Products, 2013, 50, 568-579. [ Links ]
14 O.S. Bello and M.A. Ahmad, Adsorptive removal of a synthetic textile dye using cocoa pod husks, Toxicol. Environ. Chem., 2011, 93(7), 1298-1308. [ Links ]
15 P. Senthil Kumar, S. Ramalingam, C. Senthamarai, M. Niranjanaa, P. Vijayalakshmi and S. Sivanesan, Adsorption of dye from aqueous solution by cashew nut shell: studies on equilibrium isotherm, kinetics and thermodynamics of interactions, Desalination, 2010, 261, 52-60 [ Links ]
16 O.S. Bello and M.A. Ahmad, Removal of Remazol Brilliant Violet-5R dye using periwinkle shells, Chem. Ecol., 2011, 27(5), 481-492. [ Links ]
17 B.H. Hameed and A.A. Ahmad, Batch adsorption of methylene blue from aqueous solution by garlic peel, an agricultural waste biomass. J. Hazard. Mater., 2009,164, 870-875 [ Links ]
18 Z. Zhang, I.M. O'Hara, G.A. Kent and W.O.S. Doherty, Comparative study on adsorption of two cationic dyes by milled sugarcane bagasse, Indust. Crops Products, 2013, 42, 41^9. [ Links ]
19 R. Slimani, et al. Calcined eggshells as a new biosorbent to remove basic dye from aqueous solutions: thermodynamics, kinetics, isotherms and error analysis. J. Taiwan Inst. Chem. Eng., (2013), http://dx.doi.org/10.1016/j.jtice.2013.10.009 [ Links ]
20 H.M.H. Gad and A.A. El-Sayed, Activated carbon from agricultural by-products for the removal of Rhodamine-B from aqueous solution, J. Hazard. Mater, 2009, 168, 1070-1081. [ Links ]
21 R. Baccar, P. Blánquez, J. Bouzid, M. Feki, H. Attiya and M. Sarrá, Modeling of adsorption isotherms and kinetics of a tannery dye onto an activated carbon prepared from an agricultural by-product, Fuel Process. Technol, 2013,106, 408-415. [ Links ]
22 R.H. Hessa, A. Arami-Niya, W.M.A.W. Daud and J.N. Sahu, Preparation and characterization of activated carbon from apple waste by microwave-assisted phosphoric acid activation: application in methylene blue adsorption, BioResources, 2013, 8(2), 2950-2966. [ Links ]
23 M.C. Somasekhara Reddy, V. Nirmala and C. Ashwini, Bengal gram seed husk as an adsorbent for the removal of dyes from aqueous solutions - Batch studies, Arab. J. Chem., 2013, DOI: http://dx.doi.org/10.1016/j.arabjc.2013.09.029Links ] Arial, Helvetica, sans-serif" size="2">.
24 O.S. Bello, Adsorptive removal of malachite green using activated carbon prepared from oil palm fruit fibre by KOH activation and CO2 gasification, S. Afr. J. Chem., 2013, 66, 32-41. [ Links ]
25 Z.M. Magriotis, M.Z. Carvalho, P.F. de Sales, F.C. Alves, R.F. Resende and A.A. Saczk, Castor bean (Ricinus communis L.) presscake from biodiesel production: an efficient low cost adsorbent for removal of textile dyes, J. Environ. Chem. Eng., 2014, 2, 1731-1740. [ Links ]
26 V.M. Vućurović, R.N. Razmovski, U.D. Miljić and VS. Puškaš, Removal of cationic and anionic azo dyes from aqueous solutions by adsorption on maize stem tissue, J. Taiwan Inst. Chem. Eng., 2014,45, 1700-1708. [ Links ]
27 A. Gürses, A. Hassani, M. Kranşan,.Açişli and S. Karaca, Removal of methylene blue from aqueous solution usingby untreated lignite as potential low-cost adsorbent: kinetic, thermodynamic and equilibrium approach, J. Water Process Eng., 2014, 2, 10-21. [ Links ]
28 O. Fajimi, M.B. Sarumi, M.N. Olayode, E.O. Gamra and S.I. Sanusi, In vitro propagation of Irvingia gabonensis. Afr. J. Biotechnol., 2007,6(8), 976-978. [ Links ]
29. B.S. Ogunsina, O.A. Koya and O.O. Adeosun, Deformation and fracture of dika nut (Irvingia gabonensis) under uni-axial compressive loading. Int. Agrophysics, 2008, 22, 249-253. [ Links ]
30 L. Khezema, A. Quld-Dris and R. Capart, Activated carbon from thermo-compressed wood and other lignocellulosic precursors, BioResources, 2007, 2(2), 193-209. [ Links ]
31 I. Langmuir, The constitutional and fundamental properties of solids and liquids, J. Am. Chem. Soc., 1916, 38, 2221-2295. [ Links ]
32 H.M.F. Freundlich, Over the adsorption in solution. Z. Phys. Chem, 1906, 5, 385-470. [ Links ]
33 Temkin, M.I. and Pyzhev, V. Kinetics of ammonia synthesis on promoted iron catalyst. Acta Phys. Chim. USSR, 1940,12, 327-356. [ Links ]
34 M.M. Dubinin and L.V Radushkevich, Equation of the characteristic curve of activated charcoal. Proc. Acad. Sci. Phys. Chem. USSR, 1947, 55, 331-333. [ Links ]
35 S. Lagergren and B.K. Svenska, On the theory of so-called adsorption of materials, R. Swed. Acad. Sci. Doc., Band, 1898, 24, 1-13. [ Links ]
36 Y.S. Ho and G. McKay, Pseudo-second order model for sorption processes, Proc. BioChem, 1999, 34, 451-465. [ Links ]
37 W.J. Weber and J.C. Morris. Kinetics of adsorption on carbon from solution, J. Sanity Eng. Div. Am. Soc. Civil Eng., 1963, 89, 31-59. [ Links ]
38 H.K. Boparai, M. Joseph and D.M. O'Carroll, Kinetics and thermodynamics of cadmium ion removal by adsorption onto nanozerovalent iron particles, J. Hazard. Mater., 2011,186, 458-465 [ Links ]
39 O.S. Bello, I.A. Adeogun, J.C. Ajaelu and E.O. Fehintola. Adsorption of methylene blue onto activated carbon derived from periwinkle shells: kinetics and equilibrium studies, Chem. Ecol., 2008, 24(4), 285-295. [ Links ]
40 M.O. Omorogie et al., Efficient chromium abstraction from aqueous solution using a low-cost biosorbent: Nauclea diderrichii seed biomass waste. J. Saudi Chem. Soc. (2012), http://dx.doi.org/10.1016/j.jscs.2012.09.017. [ Links ]
41 M.A. Ahmad, N. Ahmad and O.S. Bello, Adsorption kinetic studies for the removal of synthetic dye using durian seed activated carbon, J. Dispersion Sci. Technol., 2014, DOI: 10.1080/01932691.2014.913983. [ Links ]
42 O.S. Bello and M.A. Ahmad, Coconut (Cocos nucifera). Shell based activated carbon for the removal of Malachite Green Dye from aqueous solutions, Separation Sci. Technol., 2012,47(6), 903-912. [ Links ]
43 M. Zamouche and O. Hamdaoui, Sorption of Rhodamine B by cedar cone: effect of pH and ionic strength, Energy Procedia, 2012, 18, 1228-1239. [ Links ]
44 P.P. Gan and S.F.Y. Li, Efficient removal of Rhodamine B using a rice hull-based silica supported iron catalyst by Fenton-like process, Chem. Eng. J., 2013, 229, 351-363. [ Links ]
45 M. Zamouche, S. Arris and M.B. Lecoine, Removal of Rhodamine B from water by cedar cone: effect of calcinations and chemical activation, Int. J. Hydrogen Energy, 2014, 39,1523-1531. [ Links ]
46 Z.M. Magriotis, M.Z. Carvalho, P.F. de Sales, F.C. Alves, R.F. Resende and A.A. Saczk, Castor bean (Ricinus communis L.) presscake from biodiesel production: an efficient low cost adsorbent for removal of textile dyes, J. Environ. Chem. Eng., 2014, 2, 1731-1740. [ Links ]
47 V.S. Mane and P.V. Vijay Babu, Studies on the adsorption of Brilliant Green dye from aqueous solution onto low-cost NaOH treated saw dust, Desalination, 2011, 273, 321-329. [ Links ]
48 Djilali, Y. et al., Alkaline treatment of timber sawdust: a straight forward route toward effective low-cost adsorbent for the enhanced removal of basic dyes from aqueous solutions. J. Saudi Chem. Soc.,2012, http://dx.doi.org/10.1016/j.jscs.2012.10.013 [ Links ]
49 T. Santhi, Ashly Leena Prasad and S. Manonmani, A comparative study of microwave and chemically treated Acacia nilotica leaf as an eco friendly adsorbent for the removal of rhodamine B dye from aqueous solution, Arab. J. Chem., 2011, DOI: 10.1016/j.arabjc.2010.11.008 [ Links ]
50 M.V. Sureshkumar and C. Namasivayam, Adsorption behavior of direct red 12B and Rhodamine B from water unto surfactant-modified coconut coir pith, Colloid Surfaces A: Physic. Chem. Eng. Aspects, 2008, 317(1-3), 277-283. [ Links ]
51 J. Anandkumar and B. Mandal, Adsorption of Chromium (VI) and Rhodamine B by surface modified tannery waste: kinetics, mechanistics and thermodynamics, J. Hazard. Mater., 2011,186(2-3): 1088-1096. [ Links ]
52 J. Yu, B. Li, X. Sun, Y. Jun and R. Chi, Adsorption of methylene blue and rhodamine B on baker's yeast and photocatalytic regeneration of the biosorbent, BioChem. Eng. J., 2009,45, 145-151. [ Links ]
53 T.A. Khan, S. Dahiya and I. Ali, Use of kaolinite as adsorbent: equilibrium, dynamics and thermodynamic studies on the adsorption of Rhodamine B from aqueous solution. Appl. Clay Sci., 2012,69,58-66 [ Links ]
54 G.C. Panda, S.K. Das and A.K. Guha, Jute stick powder as a potential biomass for the removal of congo red and rhodamine B from their aqueous solution, J. Hazard. Mater., 2009,164,374-379. [ Links ]
55 S. Chang, K. Wang, H. Li, M. Wey and J. Chou, Enhancement of Rhodamine B removal by low-cost fly ash sorption with Fenton pre-oxidation. J. Hazard. Mater, 2009, 172, 1131-1136. [ Links ]
56 Bello, O.S. Auta, M. and Ayodele, O.B, Ackee apple (Blighia sapida) seeds: a novel adsorbent for the removal of Congo red dye from aqueous solutions, Chem. Ecol., 2012, DOI: 10.1080/02757540.2012.686606. [ Links ]
57 L. Peng, P. Qin, M. Lei, Q. Zeng, H. Song, J. Yang, J. Shao, B. Liao and J. Gu, Modifying Fe3O4 nanoparticles with humic acid for removal of Rhodamine B in water, J. Hazard. Mater., 2012, 209-210, 193-198. [ Links ]
58 N. Gupta, A.K. Kushwaha and M.C. Chattopadhyay, Adsorption studies of cationic dyes onto Ashoka (Saracaasoca) leaf powder, J. Taiwan Inst. Chem. Eng. 2012, 43, 604-613. [ Links ]
59 M.E. Fernandez, G.V Nunell, P.R. Bonelli and A.L. Cukierman, Effectiveness of Cupressuss empervirens cones asbiosorbent for the removal of basic dyes from aqueous solutions in batch and dynamic modes. Bioresour. Technol, 2010, 101, 9500-9507. [ Links ]
Recieved 23 September 2014
Revised 13 March 2015
Accepted 17 April 2015
*Authors for correspondence. E-mail: inyinbor.adejumoke@landmarkuniversity.edu.ng / fadekola@unilorin.edu.ng

