


Servicios Personalizados
Articulo
 Inglés (pdf)
 Articulo en XML
 Referencias del artículo
Indicadores

Links relacionados
-
 Citado por Google
 -
 Similares en Google
Compartir

 Permalink
South African Journal of Chemistry
versión On-line ISSN 1996-840X
versión impresa ISSN 0379-4350
S.Afr.j.chem. (Online) vol.68 Durban 2015
http://dx.doi.org/10.17159/0379-4350/2015/v68a1
RESEARCH ARTICLE
http://dx.doi.org/10.17159 /0379-4350/2015/v68a1
A rapid and sensitive LC-MS/MS method for the determination of multi-class residues of antibiotics in chicken liver
Kwenga F. SichilongoI, *; Vallerie A. MuckoyaII; Mathew M. NindiIII
IDepartment of Chemistry, Faculty of Science, University of Botswana, PB UB00704, Gaborone, Botswana
IIGS Kenya, P.O Box 90264, Mombasa, 80100, Kenya
IIIDepartment of Chemistry, University of South Africa, P.O. Box 392, Pretoria, 0003 South Africa
ABSTRACT
A very sensitive, simple and cost-effective liquid chromatography-mass spectrometry/mass spectrometry (LC-MS/MS) method for the determination of multi-class antibiotics in chicken liver was developed. The drugs under consideration were sulfaguanidine and sulfamethazole, trimethoprim, tetracycline, chlortetracycline and tylosin. Linear calibrations were established for all the analytes and the R2 values ranged between 0.9990 and 0.9997. The limits of quantitation (LOQs) varied between 0.025 and 78.8 μg kg-1. The limit of detections (LODs) were better than those that have been reported for the same antibiotics in many instances in other studies and ranged between 0.010-31.5 μg kg-1 with the sulfonamides exhibiting lower sensitivity compared to others. This was attributed to poor response factors, low S/N ratios and matrix interferences. A contrast between the relative responses towards mass spectrometer and ultra-violate/visible (UV/VIS) detection of the analytes is also reported. Sulfonamides exhibited higher response factors towards UV/VIS than mass spectrometer detection and the opposite was true for the rest of the analytes.
Keywords: Quadrupole ion trap, LC-MS, sulfonamides, tetracycline, tylosin, antibiotics, chicken liver, LC-MS/MS.
1. Introduction
Several methods have been used in the analysis of veterinary drug residues in human food. The choice of method is dependent on the objective of the analysis, availability and cost of the equipment and the required sensitivity for that particular analysis. Even with these considerations, chromatographic methods coupled with mass spectrometric techniques have become very popular in recent years, most notably high performance liquid chromatography-mass spectrometry (HPLC-MS).1 HPLC-MS has become the method of choice for the analysis of veterinary drug residues in food-producing animals (FPAs) due to its robustness, high sensitivity, selectivity, and structural elucidation capabilities. It is also cost-effective and numerous analytes can be determined in a single run, thus satisfying one of the primary considerations for an analytical method. Most of the methods reported for multi-residue determination focus on closely related compounds usually those belonging to a single class of drugs. More recently, however, new methods have concentrated on multi-class analysis, e.g. veterinary drug residues in milk.2 Several other examples have been reported where LC-MS has been used to determine multi-class veterinary drug residues in complex matrices.3-8 Specifically LC-MS has been used to analyze chicken muscle wherein doxycycline, a tetracy-cline was detected in four chicken samples at concentrations ranging from 29 to greater than 150 μg kg-1.9 In this same study, oxytetracycline and chlortetracycline were detected in ovine samples at 15-51 μg kg-1 and 13-79 μg kg-1, respectively.
Sulfonamides (antibiotics) such as sulfaguanidine and sulfathiazole, which were included in this study, have been determined by HPLC-MS in honey with limits of detection (LODs) ranging between 10 and 50 μg kg-1.10-12 Using a C18 solid phase extraction cartridge for sample preparation and an ultra-triple quadrupole mass spectrometer, LODs as low as 0.06-0.18 μgkg-1 for sulfonamides in honey13 have been reported in the literature. Another study employing a triple quadrupole mass spectrometer14 demonstrated that the matrix influences the determination of sulfonamides. Tylosin A, B, C and D have been determined in bee larvae using a mass spectrometer detector (MSD) trap and the LODs ranged between 0.4 and 1.3 μg kg-1.15 Application of the method on real bee larvae samples yielded values that ranged between 116 and 904 ng g-1 of total tylosin, i.e. tylosin A, B, C and D. Using pressurized liquid extraction (PLE) and a C18 SPE cartridge for cleanup, LODs of 3 μg kg-1 have been reported for a range of sulfonamides including sulfathiazole.16 In another study, oxytetracycline, i.e. a tetracycline, was determined using LC-MS/MS in pork and beef at concentrations of 1010.2-1361.0 μg kg-1 and 1660.1-1080.0μg kg-1, respectively, in which the LODs for the determination of tetracycline and oxytetracycline were 6.0 and 10.0 μg kg-1.17 It is worth noting that several studies employed triple quadrupole mass spectrometers, which are more costly and difficult to operate and maintain than the quadrupole ion trap (QIT) mass spectrometer used in this study. This consideration added impetus to this study since it offered the prospective of a sensitive and rapid method at lower cost.
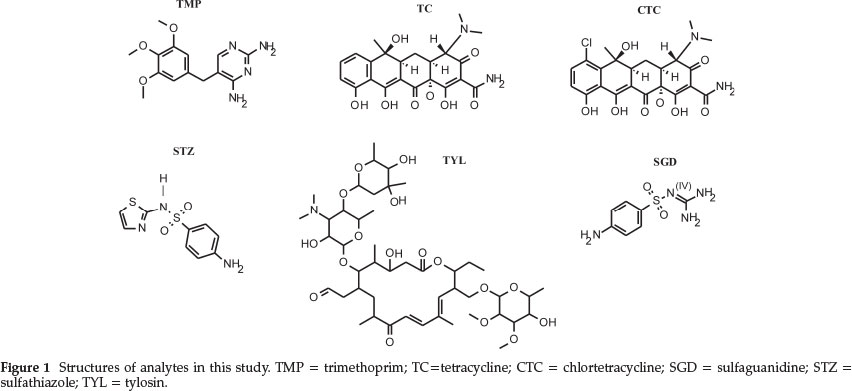
In this study, a QIT was used to develop a simple, highly sensitive multi-residue HPLC-MS/MS method for sulfonamides (sulfaguanidine and sulfamethazole), a pyrimidine (trimethoprim), tetracycline (tetracycline and chlortetracycline) and a macrolide (tylosin) all generally referred to as antibiotics18 shown in Fig. 1. Other interesting observations regarding the behavior of the analytes, when subjected to electrospray ioniza-tion, were also examined.
2. Experimental
2.1. Equipment and Reagents
An Agilent HP 1100 series high performance liquid chromato-graphic system (Agilent Technologies, Palo Alto, CA USA) equipped with an autosampler, automatic degasser, a quaternary pump, a column thermostat and a diode array detector (DAD) was used for all separations. This was coupled to a Thermo Scientific Finnigan LCQ DECA Quadrupole Ion Trap Mass Spectrometer with an electrospray ionization (ESI) ion source (Thermo Scientific, San Jose, CA, USA). The HPLC-MS system was operated using the XCalibur version 2.0 acquisition software (Thermo Scientific, San Jose, CA, USA). Ultrahigh purity nitrogen and helium from Afrox (Germiston, South Africa) were used as sheath/auxiliary and buffer gasses, respectively. An XTerra MS C18 column 5.0 μm 2.1 mm x 150 mm purchased from Waters (Milford MA, USA) was used throughout for separations. A Sartorius analytical balance (Goettingen, Germany) was used for weighing samples and reagent chemicals, while the Sartorius super-micro balance (Goettingen, Germany) was used for weighing analytical standards. The pH values of the mobile phases were measured using a Hanna instruments pH meter (Hanna instruments Inc., Cluj-Napoca Jud. Cluj. Romania). A Salton Elite blender (Johannesburg, South Africa) was used to homogenize the liver matrices. The SPE cartridges were used on a Vac Master SPE manifold from Biotage (Charlotte, NC, USA). Glass syringes together with Whatman 0.45 μm acrodisc syringe filters (Whatman International Ltd, Maidstone, UK) were used for filtering the sample extracts before HPLC-MS analysis
Disodium hydrogen phosphate dihydrate 99 % and EDTA disodium salt dihydrate were of analytical grade obtained from Saarchem (Pty) Ltd. (Krugersdorp, South Africa). Citric acid also of analytical grade, HPLC grade methanol and formic acid were purchased from Sigma-Aldrich, (Seelze, Germany). Analytical grade oxalic acid 99 % was from the Associated Chemical Enterprises (Pty) Ltd. (Johannesburg, South Africa). Analytical standards, tetracycline (TC) 97.7 %, chlortetracycline (CTC) 90 %, sulfaguanidine (SGD), sulfathiazole (STZ), trimethoprim (TMP) 99.1 % and tylosin (TYL) 84.6% were purchased from Sigma-Aldrich (Seelze, Germany). Ultra high purity (UHP) water was processed through a Milli-Quantum Ultrapure Ionex Gradient A10 system (Millipore Corporation, Bedford, MA, USA).
Organic solvents were filtered through a 0.45 organic filter, type HVLP Millipore (Dublin, Ireland). The aqueous solvents were filtered through a 0.45 pore size cellulose nitrate membrane (Whatman International Ltd., Maidstone England). Solid phase extraction (SPE) cartridges used for the sample cleanup step, Sep Pak Vac C18 (500 mg 3 ml-1) were obtained from Waters (Milford MA, USA). 99.9 % ultramark, caffeine and L-methio-nylarginyl-phenyl-anaineacetate.H2O (MRFA) for tuning and calibrating the mass spectrometer were purchased from Thermo Fisher Scientific (Edenvale, South Africa).
2.2. Preparation of the Extraction Solution - 0.1 mol L-1 Na2EDTA-McIIvaine Buffer pH 4
McIIvaine buffer solution was prepared by mixing 153 mL of 0.1M citric acid solution and 96 mL of 0.2 M Na2HPO4. The buffer was subsequently used to prepare 0.1 M of Na2EDTA-McIIvaine buffer pH 4. This extraction solution was always prepared freshly before use.
2.3. Preparation of 10 mmol L-1 Methanolic Oxalic Acid (MOX)
Methanolic oxalic acid19 was prepared with 0.63 g oxalic acid dihydrate in a 500 mL volumetric flask to which HPLC grade methanol was added to volume and mixed.
2.4. Sample Preparation and Clean-up
Chicken liver samples were used for method validation. They were purchased from supermarkets in Gaborone, Botswana. They were wrapped in aluminum foil to protect them from photo-degradation and then stored at 4 °C. The samples were screened by extracting portions of liver samples and injecting the extracts into the LC-MS to ensure that none of the analytes of interest were present. The samples were blended for about two minutes and then two portions (2 g each) put in 15 mL centrifuge tubes. One sample was spiked with a mixture of the antibiotic standards at 500 μg kg-1 by addition of 100 μL of 10 mg L-1 standard solution whilst the other served as a control. The spiked sample was mixed and left to stand for 3 hours to allow maximum penetration of the analytes into the tissue. 10 mL of Na2EDTA-McIIvaine buffer (10 mL, pH 4) were added to each and the samples centrifuged at 3800 rpm for 10 minutes. This process was repeated twice with 5 mL of the extraction solution. The supernatants were pooled and centrifuged at 4000 rpm for 15 minutes. Thereafter, they were filtered using glass wool for solid phase extraction (SPE) clean-up.
The SPE cartridges were conditioned using 5 mL methanol, followed by 5 mL of de-ionized water. The sorbent phase was equilibrated with 5 mL of Na2EDTA-McIIvaine buffer. The SPE cartridges were loaded with 3 mL of the filtered sample, followed by washing with 5 mL of deionized water, and left to dry under vacuum for approximately 3 minutes to remove any residual moisture. The contents of the tube were discarded following elution with 4 mL of 10 mmol L-1 MOX at pH 1.8. The eluent was evaporated gently at room temperature using a stream of nitrogen gas to dryness and the residue reconstituted with 1 mL of 50:50 mobile phase A (methanol) and mobile phase B (water). The resulting solution was filtered using a Whatman 0.45 μm acrodisc syringe filter and transferred to an HPLC auto-sampler vial wrapped with aluminum foil to prevent photo-degradation of the analytes prior to analysis. The samples were ready for introduction into the HPLC-MS system.
2.5. Mass Spectrometry
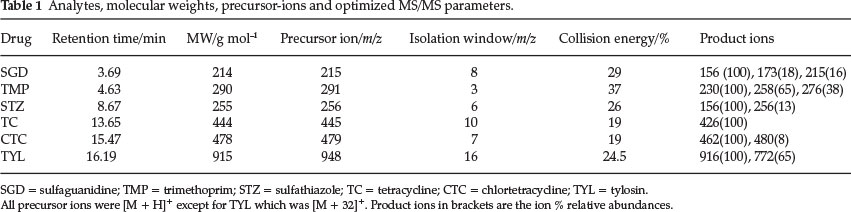
All mass spectrometric acquisitions were processed using the XCalibur version 2.0 acquisition software. Calibration and tuning of the mass spectrometer was accomplished using a solution of caffeine, methionyl-arginyl-phenylalanyl-alamine acetate (MRFA) and Ultramark. The isolation window and the collision energy for the MS/MS parameters were varied for each standard to obtain the optimum values for each as seen in Table 1. The voltages on the heated capillary, the ion optics and the electron multiplier were automatically set for each standard using the LCQ auto-tune function in the acquisition software.
To avoid space charge and enhance sensitivity, the automatic gain control (AGC) was used during all the acquisitions. The sheath gas used was nitrogen and the auxiliary gas was turned off. Helium gas was used as a buffer gas in the quadrupole ion trap (QIT). The sheath gas flow rate was set at 43.1 arbitrary units, the capillary temperature was set at 350 °C and the spray needle voltage was set at 5.02 Kv. The vacuum and turbo pump parameters as well as the power supplies were automatically set by the auto-tune function.
2.6. High Performance Liquid Chromatography
Working standard solutions dissolved in methanol (10 mg L-1) were run isocratically on an XTerra® MS C18 5.0 column μm 2.1 mm x 150 mm at a flow rate of 0.15 mL min-1 individually, to establish their retention times. After ascertaining that the retention times were different and therefore the analytes would not co-elute, a cocktail of the six standards at 5 mg L-1 was prepared. Optimization of the mobile phase pH, column temperature, flow rate and gradient elution was done in order to improve the resolution and shorten the analysis time. The diode array detector (DAD) was used to detect the analytes at three different absorption wavelengths of 260 nm, 287 nm, and 360 nm for all the analytes and their spectra were recorded simultaneously at each wavelength at a particular retention time. This necessitated the use of three channels in the diode array detector (DAD). An optimized gradient elution programme, shown in Table 2, was then used for all other separations.
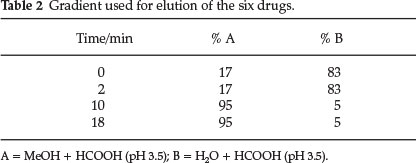
Analysis time was 18 minutes with a post equilibration run (15 minutes) before the next run. The mobile phase was composed of methanol and water adjusted to pH 3.5 with formic acid. The column was always equilibrated for one hour before the initial run of each batch of standards and samples on a daily basis at a low flow rate of 0.1 mL min-1. Optimum values as adduced from these experiments are shown in Table 2.
2.7. Quantitation
Quantitation was based on peak areas for the standards all at 5mgL-1 for all the analytes, which were used to construct calibration curves. The base peaks with relative abundances of 100 % as seen in Table 1 in the product ion spectra were used to create reconstructed ion chromatograms (RIC) from which the peak areas were derived. The RICs were obtained from the total ion chromatograms (TIC) using the XCalibur software by auto-filtration.
2.8. Method Validation
As part of method validation, linearities, limit of detections (LODs), limits of quantification (LOQs) and percentage (%) recoveries were estimated using extracts obtained after sample preparation and clean-up of the spiked liver samples. The LOD or detection limit, defined as the lowest concentration level that can be determined to be statistically different from a blank (99 % confidence) is approximately equal to the method detection limit (MDL) for those tests for which the MDL can be calculated20.
The MDL is the minimum concentration of a substance that can be measured and reported with 99 % confidence that the analyte concentration is greater than zero. It is determined from analysis of a sample in a given matrix containing the analyte. Method detection limits (MDLs) are calculated when samples are subjected to the entire sample preparation procedure and the sample extracts are analyzed by LC-MS were estimated using Eq. 1 below where s is the standard deviation of the concentration of the extracted analytes in the spiked samples and t is the student t-test value at 95 % confidence level with n -1 degrees of freedom. The instrument detection limits (IDLs), which are limits of detection when pure standards are used, were 26.3 μg kg-1 for SGD, 10.8 μg kg-1 for TMP, 24.4 μg kg-1 for STZ, 21.1 μg kg-1 for TC, 20.1 μg kg-1 for CTC and 80.9 μg kg-1 for TYL. To cater for losses that would be encountered during the sample preparation procedure, a blank sample was spiked at 500 μg kg-1 for all the analytes of interest and subjected to the whole sample preparation procedure and extracted seven times. The sample extracts were then run seven times.

In order to avoid ambiguity, the acronym LOD rather than MDL was used throughout the discussion. The LOQs were estimated as 10 times the standard deviation (s)21of the concentrations of the spiked samples as shown in Eq. 2 below.

The calibration curves were generated with eight standards ranging from 40 to 200 μg L-1, which were run in triplicate. Linearities were estimated from the calibration curves. The concentrations determined in spiked liver extracts were obtained by interpolation from the calibration curves. Recoveries of the spiked sample extracts (n = 3) at 500 μg kg-1 were calculated using Eq. 3.

3. Results and Discussion
3.1. Mass Spectrometer/UV Detector Responses to the Compounds under Study
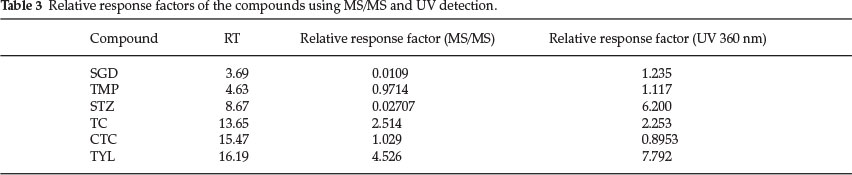
Relative response factors (RRFs) were calculated22 as shown in Table 3.
In order to clarify the variations in the validation parameters such as LODs for the analytes, a contrast in terms of analyte responses in the DAD and the mass spectrometer was made. A quantitative rather than a qualitative approach was used after qualitatively observing weak signals for sulfonamides in the mass spectrometer compared to those in the DAD. This facilitated rationalization of the lower sensitivities obtained for sulfonamides compared to the other analytes. RRFs were calculated using TMP as an internal standard for the other five analytes and then CTC as an internal standard for TMP. The RRFs of SGD and STZ in the UV detector at 360 nm were very high but sharply declined by 99 % in the mass spectrometer when MS/MS was performed. The only functional group that is unique to these compounds is the sulfonamide and speculation arose that it could have suppressed intra-molecular protonation by formic acid or this group is pH dependent. Sulfonamides are amphoteric in character and exhibit two dissociation steps in an aqueous phase. At low pH, i.e. lower than pKa1, they are fully protonated at the phenyl amine group (pKa1) and will thus be positively charged. At these pH values they will exhibit certain UV absorption characteristics. At higher pH values, i.e. greater than pKa2, they will be fully deprotonated and will be negatively charged at the sulfonamide group (pKa2) which is para to the amine group and thus they will have different UV absorption characteristics.
In contrast, the response factors of TC and CTC were identical. Figure 2 shows the signal to noise (S/N) ratios adduced, plotted as a function of detection method. S/N ratios were extracted from chromatograms of an extract of a spiked liver sample using the integrated chemical information system (ICIS) INCOS noise algorithm. The S/N ratios of SGD and STZ were far superior using UV detection compared to full scan and MS/MS. This is because sulfonamides have been shown to respond better to ESI at pH values higher or equal to pKa2 values23 which are in almost all instances values greater than pH 3.5 which was used in this study. Figure 2 also shows that SGD and STZ had identical S/N ratios both in the full scan and MS/MS modes, which were the lowest amongst the target analytes. Although UV can be implied as more sensitive for the determination of SGD and STZ, it lacks the specificity necessary to confirm presence of the analytes. Potentially, the two detectors used in tandem would be necessary in this case. The order of S/N ratios from highest to lowest in the MS/MS mode was TYL > TC > CTC > TMP > SGD = STZ.

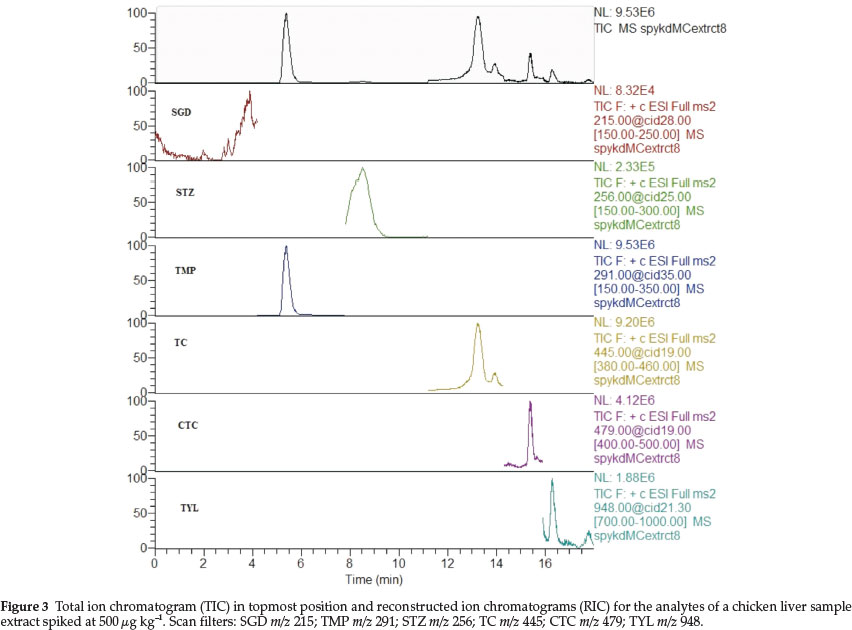
Figure 3 shows a full scan TIC and RICs of all targeted analytes for an extract from a spiked 2 g liver sample at a spike level 500 μg kg-1. As can be seen from Fig. 3 and due to poor responses to mass spectral detection in both the full scan and MS/MS modes, SGD and STZ signals were not prominent in the full scan TIC but became prominent after filtration to get RICs.
In this instance, the scan filters were pinned to the base peaks, i.e. the [M+1]+ ions except for TYL which was [M + 32]+, i.e. an adduct with methanol solvent. The filters were thus as follows: m/z 215 for SGD, m/z 291 for TMP, m/z 256 for STZ, m/z 445 for TC, m/z 479 for CTC and m/z 948 for TYL.
3.2. Method Validation
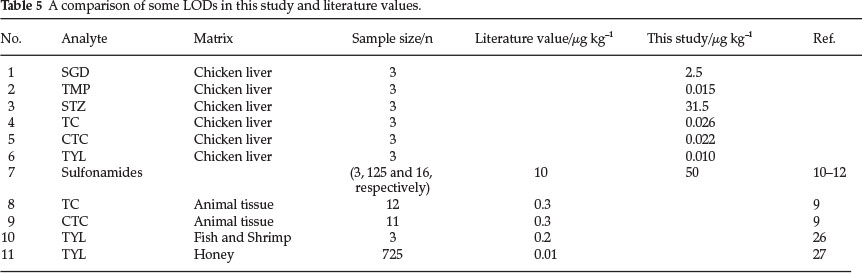
Validation results are shown in Table 4. The sensitivities for SGD and STZ were the lowest, i.e. with LODs of 2.5 and 31.5 μg kg-1, respectively, thus paralleling the low response factors to QIT detection that were estimated for these analytes in Table 3 using MS/MS.
Recoveries for SGD, i.e. 51 ± 10.8 %, and STZ, i.e. 68 ± 4.1 %, were also lower than other analytes, again underscoring the dependence of the analysis of sulfonamides on the type of sample matrix and sample preparation method used. Thus, a combination of poor responses to the instrument and matrix effects produced a cumulative affect that gave lower sensitivities, i.e. high LODs for the two sulfonamides. These values regardless still fell within and, in some cases, better than those ranges previously reported, i.e. 10-50 μg kg-1 for sulfonamides10-12 as seen in Table 5. The LODs for TMP, TC, CTC and TYL ranged between 0.010 and 0.026 μg kg-1. Of particular interest were the LODs for TC and CTC which were 0.026 and 0.022 μg kg-1, respectively. These values were lower than those that have been reported, i.e. 0.3 and 0.3 μg kg-1,ref.9 in fish tissue and 0.3 μg kg-1,ref.24 for both TC and CTC in multi-specie animal tissue and detected in a real beef sample at 6.0 μg kg-1. The lowest LOD was obtained for TYL at 0.010 μg kg-1 which was orders of magnitude lower than previously reported15. This result confirmed the observation that TYL had the highest S/N ratio from Fig. 2. TYL has also been determined with a much higher LOD, i.e. 0.2 μg kg-1 swine tissues25 and the same LOD in fish and shrimp.26
A comparable value of 0.010 μg kg-1 but with lower recoveries than in this study of 84 % (RSD = 9 %) has been reported27 using a single quadrupole mass spectrometer operated in the selected ion monitoring (SIM) mode in samples of honey. The LODs for all the compounds obtained in this study are much lower than the maximum residue limits (MRLs) in liver set by the European Union (EU) and better than those reported in many instances.
4. Conclusion
A simple, rapid (17 minutes) very sensitive and cost-effective method was developed for the determination of multi class antibiotics in chicken liver using LC-MS/MS. The low response factors of sulphonamides in this study, i.e. SGD and STZ, to mass spectrometry and in contrast to UV detection were observed. Low recoveries of the two sulphonamides were speculated to have arisen due to on the complexity of the matrix. Overall, the LODs of the method were far superior to many that are cited in the literature.
Acknowledgements
The authors wish to thank University of Botswana Department of Chemistry for material support. V.M. wishes to thank the DAAD for financial support towards her study.
References
1 S. Bogialli and A. D. Corcia, Anal. Bioanal. Chem., 2009, 39, 947-966. [ Links ]
2 V. Samanidou and N. Nisyriou, J. Sep. Sci., 2008, 31, 2068-2090. [ Links ]
3 M. McDonald, C. Mannion and P. Rafter, J. Chromatogr. A, 2009,1216, 8110-8116. [ Links ]
4 T. Cai-Ming, H. Qiu-Xin, Y. Yi-Yi and P. Xian-Zhi, Chinese J. Anal. Chem., 2009, 37, 1119-1124. [ Links ]
5 A. Kaufmann, P. Butcher, K. Maden and M. Widner, J. Chromatogr. A, 2008,1194, 66-79. [ Links ]
6 K. Granelli, C. Elgerud, A. Lundstrom, A. Ohlsson A and P. Sjoberg Anal. Chim. Acta 2009, 637, 87-91. [ Links ]
7 U. Koesukwiwat, S. Jayanta and N. Leepipatpiboon, J. Chromatogr. A, 2007,1140, 147-156. [ Links ]
8 B. Shao, X. Jia, Y. Wu, J. Hu, X. Tu and J. Zhang, Rapid Commun. Mass Spectrom., 2007, 21, 3487-3496. [ Links ]
9 J. Chico, A. Rúbies, F. Centrich, R. Companyó, M.D. Prat and M. Granados, J. Chromatogr. A, 2008, 1213, 189-199. [ Links ]
10 W. Reybroeck, F.J. Jacobs, H.F. De Brabander and E. Daeselèire, J. Agri. Food Chem., 2010, 58: 7258-7265. [ Links ]
11 R. Sheridan, B. Policastro, S. Thomas and D. Rice, J. Agri. Food Chem., 2008, 56, 3509-3516. [ Links ]
12 J. L. Martinez, V M. del Mar Aguilera-Luiz, R. Romero-González and A.G. Frenich, J. Agri. Food Chem., 2009,57, 1760-1767. [ Links ]
13 A. Economou, O. Petraki, D. Tsipi and E. Botitsi E, Talanta, 2012, 97, 32-41. [ Links ]
14 N. Le-Minh, R.M. Stuetz and S.J. Khan, Talanta, 2012, 89, 407-416. [ Links ]
15 J. Bernal, M.T. Martin, L. Toribio, R. Martin-Hernandez, M. Higes, J.L. Bernal and M.J. Nozal, J. Chromatogr. B, 2011, 879, 1596-1604. [ Links ]
16 H. Yu, Y. Tao, D. Chen, Y. Wang, L. Huang, D. Peng, M. Dai, Z. Liu, X. Wang and Z. Yuan, J. Chromatogr. B 2011, 879, 2653-2662. [ Links ]
17 M. Castellari, M. Gratacós-Cubarsí, J.A. García-Regueiro, J. Chromatogr. A 2009, 1216, 8096-8100. [ Links ]
18 Council Regulation (EEC) No. 2377/90., Off. J. Eur. Commun., 1990,224,1. [ Links ]
19 A.R. Shalaby, N.A. Salam, S.H. Abou-Raya, W.H. Emam and F.M. Mehaya, Food Chem., 2011,124, 1660-1666. [ Links ]
20 J. Ripp, Wisconsin Department of Natural Resources, Analytical Detection Limit Guidance (1996) http://dnr.wi.gov/regulations/labcert/documents/guidance/-lodguide.pdf Accessed 06.05.2014 [ Links ]
21 M. Thompson, S.L.R. Ellison and R. Wood, Pure Appl. Chem, 2002, 74, 835-855. [ Links ]
22 T.L. Ramus, S.J. Hein and L.C. Thomas, J. Chromatogr. A, 1987, 404, 155-162. [ Links ]
23 K. Sichilongo. Evaluation of Factors that Affect the Sensitivity of Sulfonamides in Electrospray Ionization Mass Spectrometry, Proceedings of the 61st American Society for Mass Spectrometry and Allied Topics, Minneapolis, Minnesota, June 9-13, 2013. [ Links ]
24 C. Blasco, A. Di Corcia and Y. Picó, Food Chem., 2009,116, 1005-1012. [ Links ]
25 M. Cherlet, S. De Baere, S. Croubels and P. De Backer, Anal. Chim. Acta. 2002, 473, 167-175. [ Links ]
26 M.R. Jo, H.J. Hee, T.S. Lee, K. Park, E.G. Oh, P.H. Kim, D.S. Lee and M. Horie, Food Sci. Biotechnol., 2011, 20, 823-827. [ Links ]
27 T. S. Thompson, D.K. Noot, J. Calvert and S.F. Pernal, J. Chromatogr. A, 2003, 1020, 241-250. [ Links ]
Received 13 May 2014
Revised 28 November 2014
Accepted 4 December 2014
* To whom correspondence should be addressed. E-mail: kwenga.sichilongo@mopipi.ub.bw

