


![Synthesis and characterization of ethyl 2-methyl-7-oxo-7H-isoxazolo[2,3-α ]pyrimidine-6-carboxylate derivatives](/img/en/next.gif)


Services on Demand
Article
 English (pdf)
 Article in xml format
 Article references
Indicators

Related links
-
 Cited by Google
 -
 Similars in Google
Share

 Permalink
South African Journal of Chemistry
On-line version ISSN 1996-840X
Print version ISSN 0379-4350
S.Afr.j.chem. (Online) vol.67 Durban Jan. 2014
REVIEW ARTICLE
The Contributions of James Moir to Physical Chemistry
P. Loyson*
Chemistry Department, Nelson Mandela Metropolitan University, P.O. Box 77000, Port Elizabeth, 6031 South Africa
ABSTRACT
James Moir was a pioneering chemist in the early 1900s who played a leading role in various chemical societies in South Africa. Although he was mainly an organic chemist, he was a very good all-round chemist, whose analytical and organic activities have already been covered in this j ournal. This article examines his research in physical chemistry, covering the spectral analysis of the ruby and emerald gemstones, a detailed analysis of part of the Fraunhofer lines of the solar spectrum, and an examination of the spectra of cobalt compounds, the permanganate ion, and uranium compounds. Finally, as part of his inorganic and analytical investigations, he also delved into the physical chemistry aspects of solution chemistry, particularly the hydrolysis of the cyanide ion.
Keywords: Physical chemistry, spectroscopy, ruby, solar spectrum, history of chemistry.
1. Introduction
James Moir (Fig. 1) arrived in South Africa from the University of Aberdeen in Scotland in 1902. He had graduated with a M.A. and a B.Sc. degree in 1897 and had just completed his D.Sc. After a brief spell as science master at a Johannesburg school, he acted as a chemist in the laboratory of a gold mining company and in 1904 was appointed chemist to the Transvaal Department of Mines. In 1914 he joined the staff of the Government Analyst at the Government Chemical Laboratories in Johannesburg, a position which he held for 15 years until his death. He was twice President of the South African Chemical Institute (1916, 1925), President of the Chemical, Metallurgical and Mining Society of SA (1910-1911) and President of the S.A. Association for the Advancement of Science (1919). He was awarded the South African Research Medal in 1919.1

He played an important role in the gold mining industry and in the early years of the South African Chemical Institute. He was a prolific author and over his working career he published some 140 papers.2 He was mainly an organic chemist.3 His activities as a chemical analyst have already been described in this journal.4 He called himself a 'chemical investigator'5 and hence was interested in all aspects of chemistry, including physical chemistry topics, especially in the field of spectroscopy. This article covers his research contributions in physical chemistry as reported in the local chemistry journals at the time.
2. The Spectrum of the Ruby
In 1909 James Moir published the first of his short articles dealing with the spectra of gemstones, in particular that of the ruby.6 He claimed that he had developed a characteristic test to identify a true ruby. On placing a ruby before the slit of a spectroscope, illuminated with strong sunlight, a very remarkable spectrum is obtained which differs from all others in resembling an ordinary emission spectrum, with a sharp narrow red band falling in the range 6915 to 6945 D (he called this unit tenthmetre). No other pink or red stone showed this line. In addition to the red line the spectrum also contained wide green and orange bands which, however, were not characteristic. This preliminary work was performed on a small spectroscope.
The following year he published a more detailed account on the spectrum of the ruby, having had access to instrumentation from the South African School of Mines and Technology in Johannesburg.7 In all, he discovered eight absorption lines, all of them of unusual narrowness. The first three of these hairlines constitute the system observed before. He found that the red transmission line observed previously consisted of lines at 6955 A, 6942-6947 A and 6933 A. The other five lines were the same as seen in an artificial ruby and more easily observed, with one in the range 6760-6790 A, and another at 6610 1 10 A; the other three lines were bands in the blue.
He claimed that 'the most curious thing about the ruby spectrum was that none of the lines could be definitely identified with those of any known colouring matter'. He also stated that he had discovered the cause of dichroism of the ruby: when the gem is examined with a nicol prism and spectroscope, there is seen, in addition to the hairline spectrum described, a broad band in the green, which appears and disappears as the gem is rotated.
As the artificial ruby was said to be coloured with chromium, he examined the spectra of most chromium compounds, detecting no corresponding sharp lines in their spectra. However, in a strong solution of potassium chromium oxalate, he detected the first ruby line, but the others were completely absent. He concluded 'that the coloration of the ruby was due to chromium, the vibrations of the element being modified by its imprisonment in an anisotropic medium'.
In a further paper on the spectrum of the ruby in 1911, he discovered two additional faint bands in the extreme red, of wavelengths 7000 and 7150 A.8 He succeeded in demonstrating the presence of chromium as the element causing the colour by dissolving an artificial ruby in fused bisulfate, followed by precipitation with ammonia and subsequently fusing the precipitate with soda and nitre. Another remarkable observation he made was that the ruby, when heated to a temperature below a red heat, changes colour, through brown to green. Whilst hot, the spectrum was that of ordinary chromium, without any of the special ruby lines. On cooling it slowly recovered its original colour and spectrum. Repeating this treatment with a corundum plate, he found that the effect of heat was exceedingly small, which made him conclude that the spectrum of the ruby depended on the chromium and not on the crystalline structure of the alumina.
In a final paper in 1918,9 he further investigated the ruby to see if constrained vibration of ordinary chromium oxide could be induced by artificial means so that the resulting mixture would show narrow absorption bands in the red in addition to the common broad band of unconstrained chromium. His first attempt involved dissolving a little chromium oxide in concentrated sulfuric acid and gradually adding small quantities of starch until the orange colour changed to deep green. This was successful. The solution showed a red transmission band bounded by two absorption bands just as in the case of the ruby, although the bands were not in the same place: in sulfuric acid the band was from 6880 to 6770 A, whilst with the ruby, the transmission band was at about 6940 A, considerably further up the spectrum. A second and even more striking example of the constrained chromium spectrum was obtained when glacial phosphoric acid was used instead of sulfuric acid. The product was a thick green syrup which solidified to a glass on cooling. Its spectrum showed a transmission band from 6800 to 6705 A, very similar to that seen in the ruby, but about twice as broad and also much further down in the red. None of the other acids tried gave anything characteristic.
It is now known that the ruby gemstone has a repeating unit of Al2O3Cr and its structure consists of aluminium oxide with a small fraction of the Al3+ ions replaced by Cr3+.10 Each Cr3+ is surrounded octahedrally by six O2- ions. This crystallographic arrangement strongly affects each Cr3+ ion, resulting in light absorption in the yellow-green region of the spectrum and this gives the red colour of the gem.
3. The Spectrum of the Emerald
He found that the spectrum of the true emerald consisted of a broad pure-green transmission with three hairlines in the red, at 6805,6795 and 6330 A.11 Examining the spectrum of Cr2O3 in a borax bead gave a hazy band with a sharp edge at 6800 A, so that the colour of emerald may be due to chromium. The artificial emerald showed no such hairlines in its spectrum. This was true also for a wide range of other coloured stones examined. The artificial emerald can thus easily be distinguished from the real emerald.
In trying to match the spectrum of the emerald with that of a constrained chromium compound, he found that a phosphoric acid solution of Cr2O3 had a faint band at 6310 A, which could also be seen in the emerald spectrum. He claimed that, 'by adjusting the concentration of Cr in the phosphoric acid medium, and so altering the depth of absorption bands, it would be possible to get a very close imitation of the emerald spectrum'.9
It is now known that the emerald is a green beryl of composition Be3Al2Si6O18 with about 2 % Cr3+ ions substituting the Al3+ ions.12
4. The Absorption Spectrum of Oxygen and a New Law of Spectra
In 1910 Moir investigated the solar spectrum,13 in particular the multiplex bands known as the A and B lines of the spectrum, which are better known today as part of the Fraunhofer lines. It was known at the time that they were due to the absorption of the sun's light by the oxygen of the earth's atmosphere. No attempt had yet been made to put the rhythmic structure of the lines into an algebraic expression in terms of their wavelength. He succeeded in doing this with a new type of equation quite different from those of Balmer and Rydberg which are functions of n2. His new equation contained n+2, with n being successive whole numbers.
He grouped the A and B lines in two sets each: the 'head' of A with a number of closely spaced lines, then a break, followed by the 'tail' of A, again with a number of closely spaced lines. He did the same for the B lines, with the 'head' of B, followed by the 'tail' of B.
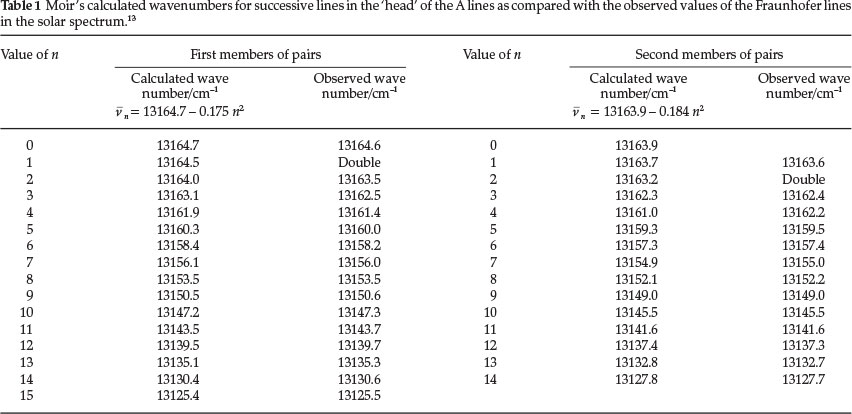
By analyzing the 'head' of the A lines, he noticed that they consisted of a tangled pair-system, with each line coupled to a subsidiary line. The first line of the first pair gave a fundamental oscillation frequency of 13164.7 cm-1 (actually the wavenumber,  , and he assigned a value for n = 0 to this line; the equation
  n = 13164.7 - 0.175 n2 was then used to calculate the frequency (i.e. the wavenumber V) for each successive n value. Similarly for the subsidiary line coupled to the first line, with a wavenumber of 13163.9 cm-1, a value of n = 0 was given and the wave number of each successive subsidiary line was then calculated by using a similar expression n = 13163.9 - 0.184 n2. Table 1 shows his calculated values for n for each pair of lines belonging to the head group of A, alongside the observed value for each line. It is seen that agreement is excellent.
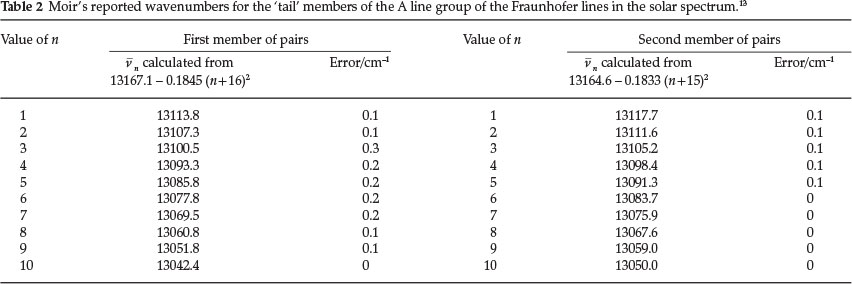
After the 15th pair there is a break and the 'tail' of A starts, again consisting of pairs. For the 'tail' section he used two fundamentals lying close to those of the 'head'. The equation for the wave number for the first member of pairs, in terms of n is: vn = 13167.1 - 0.1845 (n + 16)2. The second member of each pair is calculated from vn = 13164.6-0.1833 (n + 15)2. Table 2 below gives the calculated data for the first 10 pairs, with his reported error.
He stated in his paper that by these equations the whole of the observed lines in the A complex of the solar spectrum is accounted for except for one isolated line at 13124.6 cm-1, which is probably not a true oxygen line.
The B complex is a very close imitation of A and consequently the equations required only differ in the constants. For the 'head' of B he used the equation vn = 14555.7- 0.25 n2 for the first member of the pair, whilst for the second member of the pair vn = 14557.7 - 0.25 n2 was used. A table is presented in the article showing excellent agreement with observed values.13 He even improved on these equations, using a quadratic equation which gives a maximum error of only 10.15 cm-1. This equation is: vn = 14555.5 (or 14557.7) - 0.26 n2 + 0.11 n.13
In the same way the 'tail' of B is given by: vn = (14559.6 1 1) -0.25 (n + 12)2. Once again excellent agreement with observed values was reported.13 He summarized by saying that in the B series, only one line was not accounted for, i.e. 14556.1 cm-1 and suggested that it was probably wrongly observed.
He also found a connection between the constants for the A and B groups. The ratio of the fundamental oscillation frequencies (wavenumbers) is 1.10586 for both pairs and the cube of this is the ratio of the coefficients of n2, viz. 0.25 / 0.175.
He concluded by saying that this investigation showed that the vibrations of O2 are due to one system only and that that system is very slightly unsymmetrical to account for the pairs.
5. Spectra of Cobalt, Permanganate and Uranium Compounds
In Part VII of his series on Colour and Chemical Constitution he discusses his observations on certain inorganic spectra.14 From his exhaustive organic research he had concluded that simple coloured substances can have their colour altered by 'loading' the molecule either internally or by combination with a non-ionizing solvent. He now applied his findings to the spectra of compounds of Co, the permanganates and uranium compounds.
a) Compounds of Co:14 he observed that the spectrum of cobalt salts dissolved in water is not striking. It is the same for all salts when a dilute solution is examined and consists of a single, very broad band, with its centre near 1495 nm, that is due to the hydrated cobalt ion. Small differences are noticed for partly non-ionized cobalt solutions due to partial combination with the anion of the salt , leading to a higher molecular mass or volume and therefore to a 'loaded' vibration with a higher wave-length. The centre of the band is near 1 505 nm for both chloride and nitrate and near 1 510 nm for acetate. When the nitrate is fused without the addition of water, the band-centre is raised to 1 510 nm, which is thus the wave-length of Co(NO3)2 in the non-ionized condition.
A solution of CoSO4 in hot concentrated H2SO4 is blue, with the band-centre raised as high as λ 575 nm; on cooling, this turns to pink and has the band at λ 545 nm. He suggested, by using his loading hypothesis, that the latter was probably due to Co(HSO4)2, whilst the blue form was due to a compound of this with H2SO4. He also suggested that the change in colour from pink to blue by heat is due to an increase in molecular mass by combination with the neighbouring molecules. In his paper he gives further details of the spectral changes of a number of cobalt compounds when going from pink to blue: CoCl2, CoBr2, CoI2. It is now known, of course, that these colour transitions are due to a change from an octahedral pink arrangement, as in Co(H2O)62+, to the blue tetrahedral form as in CoCl42-.15
b) Spectrum of the permanganates:14 dilute solutions of permanganates give an absorption spectrum containing five bands which appear to be equally spaced. Two of these, the second and the third, are much stronger than the others, and by using more concentrated solutions he was able to observe two more further down in the violet, making seven in all. He expressed their rhythmic character by the following mathematical equation:

where N can be successively 0,1,2,3,4,5, and 6, giving seven values for λ agreeing within experimental error with the observed wave-lengths of the absorption spectrum, viz. 572, 547,525,504,485,468 and 451 nm (observed 572,546.5,524.5, 503,486,469 and 454 nm). He maintained that the reflection spectrum of solid KMnO4 contained emission bands at 577, 552, 530, etc. which evidently corresponded to non-ionized KMnO4 of slightly higher molecular mass than the ion MnO4-to which the ordinary absorption bands belonged.
Three years later, in 1922,16 he published a claim for priority when he noticed that an Italian investigator, Emilio Adinolfi, used a very similar equation in a paper in a journal of the Academy of Lincei.17 His equation was n = n3 1 75.3 N, but Moir claimed that the n3 in this equation referred to the third band (the strongest), whereas Moir's figure 1750 referred to the first band. Therefore by subtracting 2 x 75.3 from his value for n3(viz. 1902.8) he obtained 1752.2 cm-1.
By adjusting Adinolfi's equation to read:  = 1752.2 + 75.3 N, he claimed it was practically the same as his, decimal points meaning nothing in observations of this sort, which are not capable of a higher accuracy than 0.1 %. Table 3 compares the values for the seven lines in the MnO4- spectrum obtained with Adinolfi's adjusted equation, Moir's equation and Moir's observations.

c) Spectra of uranium compounds:14 uranyl compounds in solution exhibit a spectrum which is a sort of continuation of the permanganate spectrum, consisting of five bands equally spaced in the blue. For the UO22+ ion the position of the five absorption centres are 473, 459, 446, 433 and 430 nm, with the central one being the strongest. The effect of 'loading' was studied by observing the transmitted light from solid uranium salts and excluding fluorescence using a black cover. Uranyl acetate gave readings of 476, 464, 445, 432 and 422 nm. Other salts were also examined.
Uranyl bisulfate in concentrated H2SO4 gave four bands, namely at 492, 475, 458 and 438 nm; uranyl perchlorate in the same medium gave 488,471,456 and 443 nm; in the solid state this compound gave 506, 490 and 470 nm; finally solid natural autunite (Ca(UO2PO4)2.8H2O), obtained from Madagascar, gave 514, 500, 485, 470 and 456 nm. The latter two compounds showed a great 'loading' effect as a result of their much larger molecular volume, and he noted that the change in position of the bands followed the molecular mass qualitatively but not proportionally. In fact, the change in wavelength appeared all through to be roughly proportional to the sixth root of the molecular mass. Thus for autunite, as compared with two UO22+ ions, the ratio of the molecular masses is  of which the sixth root is 1.091. Now the five ratios
  and
and  all have an average of 1.089 within experimental error. A similar state of affairs holds for uranyl perchlorate, with the ratios of all the lines agreeing with the sixth root of the ratio of the molecular masses.
In further work he supplied an equation to calculate the lines in the spectrum of the uranyl ion, viz. n =  =2113 + 66 N (where N = 0,1, 2, 3, 4),16 giving the calculated values of 2113, 2179, 2245, 2311 and 2377 cm-1, whilst the observed values were 2114, 2180, 2243, 2310 and 2381 nm. He also gave an equation to calculate the bands in the spectrum of autunite by dividing by the sixth root of the ratio of the molecular mass of the salt to that of2x UO22+. The equation is as follows:

The calculated values are 1937, 1997, 2058, 2118 and 2179 cm-1, whilst the observed values are reported as 1945, 2000, 2062, 2128 and 2190 cm-1.
6. Instrumentation
Moir was an expert spectroscopist and in a publication from 1927 he gave a sketch of the spectroscope that he used,18 especially for his work dealing with the colours of flowers. In this study it was essential that the field of view of the spectroscope used should cover three-quarters of the visible spectrum. The instrument he preferred was the larger Hilger direct vision spectroscope shown in Fig. 2, in which the plate carrying the slit is moved across the front of the instrument by means of an accurate screw (F in diagram), the position of the slit being recorded on an equally divided scale fixed below the slit. He made some alterations to the instrument:
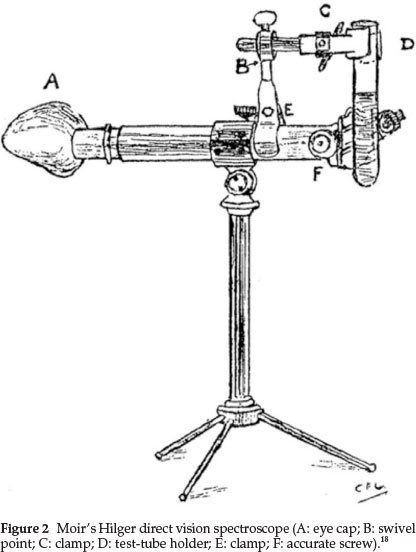
(1) The diaphragm in the eye-piece was filed out into a oblong shape so as to get most of the spectrum visible at once, even though the ends have poor definition.
(2) The pointer in the eye-piece was replaced by a very thin platinum wire.
(3) The eye-lens was provided with a lop-sided eye-cap made to fit the face from nose to ear, thus completely excluding side and back light, which is necessary when examining the ends of the spectrum. This appears as A in the diagram. It is soldered on to the lens socket, so that, when pushed home, the platinum pointer comes into sharp focus automatically
(4) A special test-tube holder constructed as in the diagram was added, swiveling round horizontally at B, so that the tube may follow the slit as it moves
(5) He also used various screens, such as a methylviolet screen to cut out the glare when observing bands near the end of the spectrum.
7. Organic Chemistry Spectral Work
Moir's main research activity was in the field of organic chemistry where he studied the colour of numerous organic substances and related their spectra to their chemical constitution. Most of his work has been described in a previous paper in this journal.19 Some examples are given here:
a) His work on halogenated derivatives of phenolphthalein and fluorescein.20 By using halogen derivatives of the two parent substances, he showed that the laws connecting the change in colour with the number and nature of the halogen substituents were quite simple and regular, so that all experimental results could be calculated and the spectrum of the unknown substances predicted from a simple equation:

where n = frequency (10000/1) of the band of the halogenated derivative, n = the frequency of the parent substance (18.05 cm-1 for phenolphthalein, 20.27 cm-1 for fluorescein), m the number of halogen substituents and N the atomic number of the halogen (17 for Cl, 35 Br and 53 for I). His experimental data confirmed the accuracy of the equation.
b) His general numerical solution of the colour constitution problem.21 He had shown before that the colour phenomenon was additive, i.e. the colour change effect caused by a particular group in a molecule is almost independent of other groups present and of the rest of the molecule. He found that each combination of group and position, e.g. o-methyl, p-hydroxyl, etc., can be assigned a colour-factor by means of which the effect on colour of the substitution of the group for H in the given position can be calculated. Even if five or six groups are present it is found that by multiplying the wavelength of the parent substance by all the factors of the groups present in the coloured substance, the wavelength 1 of the compound could be calculated. The calculated values agreed very closely to the observed measurements.
8. Further Physical Chemistry Activities: Hydrolysis of Cyanide
As part of his study into elimination of cyanide from aqueous solutions, he examined the hydrolysis of cyanide and the resulting disturbance of the equilibrium when ferrous sulfate was added to the solution.22 For a solution of NaCN the equation for the hydrolysis of CN- is

in his paper he used a standard sodium cyanide solution of 0.0100 Min strength and calculated that [HCN] [OH-] = 0.0100 x Kh = 8.33 x 10⁸, from which it appears that the Kh value he used was 8.33 x 10⁻⁶. Since [HCN] must equal [OH ] in a standard solution of sodium cyanide, it follows that [HCN] = [OH ] =  = 2.9 x 10⁻⁴ M, giving a% hydrolysis of
  x 100 = 2.9 %. By using the currently accepted values for Kh =
  =
=  = 1.62 x 10-5,23 a % hydrolysis of 4.0 % is obtained. Adding Fe2+ to the solution will cause precipitation of Fe(OH)2, which will disturb the equilibrium reaction causing more CN- to undergo hydrolysis. He used a Ksp value for Fe(OH)2 equal to 1.43 x 10⁻¹². Therefore [Fe2+] [OH-]2 = Ksp = 1.43 x 10¹², from which the [OH -] =
  = 1.42x 10⁻⁴ M, and the [HCN] is
  = 5.8 x 10⁻⁴ M which gives 5.8 % hydrolysis, an expected increase in hydrolysis.
By using an updated value for the Ksp for Fe(OH)2 = 4.87 x 10-17,23 the [OH ] becomes 4.6 x 10⁻⁶ M which gives an [HCN] of 3.5 x 10⁻² M, which is higher than the original [CN ], indicating that all the CN- initially present will have converted to HCN due to the Fe2+ upsetting the hydrolysis equilibrium.
9. Conclusion
This article has shown that James Moir, besides being a well-known organic chemist in the early 1900s, investigated a number of topics which could be classified as belonging to physical chemistry. He was especially active in the field of spectroscopy. His early spectral analysis of the ruby and emerald showed the presence of Cr in each of these and he developed characteristic tests to identify a true ruby and emerald, based on their spectra. His detailed examination of the A and B lines of the solar spectrum, part of the so-called Fraunhofer lines, led to the establishment of algebraic expressions to predict the exact wavenumber of all the lines (except one or two) in the fine structure of this part of the spectrum, which agreed very closely with the observed values. He also made contributions to the spectral analysis of cobalt compounds, the MnO4- ion, and uranium compounds. A brief summary of his organic spectral work shows that he could predict the absorption lines of numerous organic compounds. Finally, he used physical chemistry concepts dealing with aqueous equilibria of cyanide solutions to study the disturbance of the cyanide hydrolysis equilibrium upon the addition of Fe2+.
References
1 SACI Proceedings 1928-1929, September 1929, pp. 29-30. [ Links ]
2 P Bloom, James Moir Medal Information, SACI, personal communication. [ Links ]
3 J. McCrae, Obituary in J. Chem. Soc., 1929, 2973. [ Links ]
4 P. Loyson, S. Afr. J. Chem., 2014, 67, 61-66. [ Links ]
5 SACI Proceedings, June 1916, pp 24-31. [ Links ]
6 J. Moir, Trans. Roy. Soc. S. Afr.,1909,1, 2, 321. [ Links ]
7 J. Moir, Trans. Roy. Soc. S. Afr., 1910, 2, 1, 271-272. [ Links ]
8 J. Moir, Trans. Roy. Soc. S. Afr., 1911, 2, 1, 339-330. [ Links ]
9 J. Moir, Trans. Roy. Soc. S. Afr., 1918, 7, 1, 129-130. [ Links ]
10 http://www.webexhibits.org/causesofcolor/6AA.html, accessed 4 September 2014. [ Links ]
11 J. Moir, Trans. Roy. Soc. S. Afr., 1910, 2, 1, 273. [ Links ]
12 J. McMurray and R.C. Fay, Chemistry, 3rd edn., Prentice Hall, Upper Saddle, New Jersey, USA, 2001, p. 826. [ Links ]
13 J. Moir, Trans. Roy. Soc. S. Afr.,1910, 2, 1, 157-159. [ Links ]
14 J. Moir, Trans. Roy. Soc. S. Afr., 1919, 8, 1, 45-49. [ Links ]
15 F.A. Cotton and G. Wilkinson, Advanced Inorganic Chemistry, John Wiley and Sons, New York, 5th edn., 1988, p. 730. [ Links ]
16 J. Moir, Trans. Roy. Soc. S. Afr., 1922,10, 1, 33-34. [ Links ]
17 E. Adinolfi, Atti Accad. Lincei, 1920, 29, II, 38-41. [ Links ]
18 J. Moir, J. S. Afr. Chem. Inst. 1927,15, 36-46. [ Links ]
19 P. Loyson, S. Afr. J. Chem., 2014, 67, 124-136. [ Links ]
20 J. Moir, Trans. Roy. Soc. S. Afr., 1919, 8, 225-228. [ Links ]
21 J. Moir, Trans. Roy. Soc. S. Afr., 1919, 8, 303-311. [ Links ]
22 J. Moir, J. Chem. Metal. Min. Soc. S. Afr., 1910, 10, 433-441. [ Links ]
23 D.R. Lide, ed., Handbook of Chemistry and Physics, 84th edn., CRC Press, London, 2003-2004. [ Links ]
Received 12 May 2014
Revised 5 September 2014
Accepted 5 September 2014.
* E-mail: ployson@nmmu.ac.za

