


Services on Demand
Article
 English (pdf)
 Article in xml format
 Article references
Indicators

Related links
-
 Cited by Google
 -
 Similars in Google
Share

 Permalink
South African Journal of Chemistry
On-line version ISSN 1996-840X
Print version ISSN 0379-4350
S.Afr.j.chem. (Online) vol.67 Durban Jan. 2014
RESEARCH ARTICLE
Development of a reliable method for the spectrophotometric Determination of Palladium(II) with o-Methoxyphenyl Thiourea: Separation of palladium from associated metal ions
Shashikant KuchekarI, *; Ramesh NavalII; Sung-H. HanIII
IAnalytical Chemistry Laboratory, Department of Chemistry, Arts, Commerce and Science College, Satral, Tal- Rahuri, Dist- Ahmednagar, (MS) India 413711
IIJijamata College of Science and Arts, Bhende, Dist- Ahmednagar, (MS) India 413711
IIIInorganic Nanomaterial Laboratory, Department of Chemistry, Hanyang University, Seoul, South Korea
ABSTRACT
A simple and sensitive method is described for the solvent extraction and spectrophotometric determination of palladium(II) using low concentrations of o-methoxyphenyl thiourea (OMePT). Trace concentrations of palladium(II) were quantitatively extracted when equilibrated with OMePT in chloroform at 1.0 mol L-1 hydrochloric acid media for 10 s. The absorbance of a yellow coloured palladium(II)-OMePT complex was measured at 325 nm. The palladium(II)-OMePT complex was stable for more than 72 h. The composition of extracting species was 1:1, determined by mole ratio, Job's continuous variation method and it was confirmed by a log-log plot. Beer's law was obeyed up to 15.0 mL-1. The molar absorptivity and Sandell's sensitivity were 3.38 X 10³ L mol-1 cm-1 and 0.031 cm-2, respectively. The method was free from a large number of interferences from cations and anions. The method was applied for separation of palladium(II) from multi-component mixtures and synthetic mixtures corresponding to alloy.
Keywords: Solvent extraction, spectrophotometric determination, o-methoxyphenyl thiourea, palladium.
1. Introduction
Palladium is a rare and lustrous silvery white metal. It has a wide range of applications in the chemical industry. Palladium is biologically important for determination of N-acetyl-L-cysteine1 and nucleic acids.2 It catalyzes the oxidative degradation of paracetamol.3 Palladium (II) is used in the jewellery and cosmetics industry in the form of alloys.4,5 The use of palladium is growing continuously and its health hazards are also observed.6 The literature review gives a clear representation of the widespread applications of palladium. Hence it is necessary to determine palladium in various samples. Amongst available methods, spectrophotometric methods are widely used as these are easy, with high accuracy and precision. Extraction of palladium is reported using 5-chloro-8-hydroxy-7-iodoquinoline as a chromophore,7 the method has a narrow Beer's range (0.0-2.6 mL-1). A reagent, 1-(2-quinolylazo)-2,4,5-trihydroxybenzene (QATB), forms coloured complexes with palladium in acidic and basic media.8 With this method iodide, thiosulfate and manganese interfere seriously. The extractive spectrophotometric determination method has been reported using five thiosemicarbazone reagents,9 although limited parameters were studied, specifically the effect of solvent and that of pH. Spectrophoto-metric determination of palladium was carried out using p-[N,N-bis(2-chloroethyl)amino] benzaldehyde thiosemicarbazone,10 while Pt(IV), Cu(II) and I- interferes with the method.
In our laboratory, we have developed extraction and spectrophotometric determination methods for platinum(IV)11 and ruthenium(III)12 using o-methylphenyl thiourea (OMPT). Here we report the analytical applications of OMePT for spectrophotometric determination of palladium(II). The proposed method uses OMePT as a new chromogenic ligand, and when compared with other methods, it is found to be more sensitive and selective (Table 1).13-26
2. Experimental
2.1. Instrumentation
A double-beam UV-visible spectrophotometer (Elico, model SL-191) with matching 10 mm quartz cells was used for absorbance measurements. An electronic balance (Contech, model CA-123) was used for weighing purposes. Calibrated glassware were used and are cleaned by soaking in dilute nitric acid followed by washing with soap and rinsed two times with water.
A Systronics 8130 atomic absorption spectrometer equipped with a hydride generator was used for comparative purposes.
2.2. Reagents
All the reagents used were of analytical reagent grade unless otherwise stated. A standard stock solution of palladium (II) was prepared by dissolving 1.0 g palladium (II) chloride (PdCl2) (Loba Chem) in 1.0 mol L-1 hydrochloric acid and diluted to 250 mL in a calibrated flask with distilled water and was standardized by a gravimetric method.27 A working standard solution of palladium (II) 75 mL-1 was prepared by diluting the standard stock solution with distilled water. OMePT was prepared using the method reported by Frank and Smith.28 The working reagent solution (1.0 x 10⁻⁴ mol L-1) of OMePT was prepared in chloroform. Other standard solutions of different metal ions were prepared by dissolving their respective salts in water and diluted suitably. Double-distilled water was used throughout the work.
2.3. Recommended Procedure
Hydrochloric acid was added to an aliquot of solution containing 75 of Pd(II) in a 25 mL calibrated flask, to maintain the acidity of 1.0 mol L-1 on dilution up to mark with distilled water. The aqueous solution was equilibrated with 10 mL, 1.0 x10⁻⁴ mol L-1 OMePT in chloroform for 10 s, in a 125 mL separatory funnel. The two phases were allowed to separate, where the organic phase containing the yellow coloured palladium (II)-OMePT complex was collected and dried over anhydrous sodium sulphate. The total volume of organic phase was made up to 10 mL with chloroform and the absorbance of palladium(II)-OMePT complex was measured at 325 nm against the reagent blank.
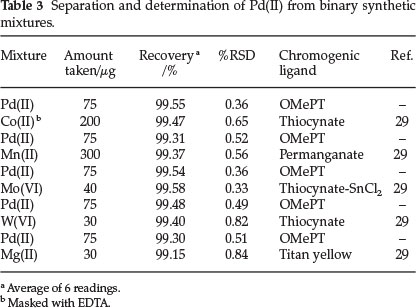
The recommended method was successfully applied for separation and determination of palladium (II) from associated metal ions. After extraction of Pd(II) from a synthetic sample, added metal ions W(VI) and Mo(VI) were determined spectrophotometrically in aqueous solution using the thiocynate method at 403 and 470 nm wavelength, respectively.29 Mn(II) was determined spectrophotometrically by the permanganate method at 528 nm while Mg(II) was determined at 545 nm with Titan yellow.29 To enhance the extraction of palladium (II) in the presence of Co(II), this metal ion was masked with EDTA and the recommended method was followed for quantitative extraction of palladium(II) into 10 mL chloroform, where the aqueous phase contained the masked Co(II). It was de-masked by treatment with 3.0 mL nitric acid and evaporated to moist dryness followed by 3.0 mL concentrated hydrochloric acid treatment. The residue was cooled, dissolved in water and Co(II) was determined spectrophotometrically at 620 nm.29
Palladium(II) was extracted and determined in synthetic mixtures corresponding to alloys. Various synthetic mixtures were prepared as per the composition of alloys to maintain the proportion of metals in the respective alloy, viz. jewellery alloy, low-melting dental alloy, Okay alloy and Pd-Cu alloy.
3. Results and Discussion
3.1. Absorption Spectra
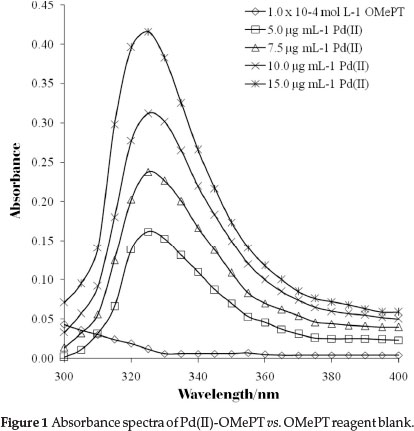
Figure 1 shows the absorption spectra of the palladium(II)-OMePT complex in chloroform with a maximum at 325 nm, whereas the absorption spectrum due to reagent blank is negligible. Therefore, all the absorbance measurements were made at 325 nm against the reagent blank for further spectrophotometric determination of palladium(II).
3.2. Effect of Acid Type and Concentration
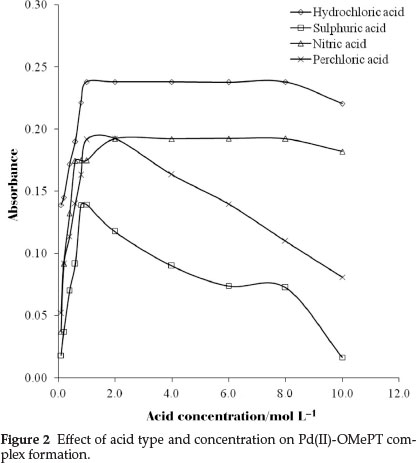
For finding the optimum acid conditions, the extraction of palladium(II) was studied using different mineral acid media viz. hydrochloric acid, sulphuric acid, nitric acid and perchloric acid using 1.0 x 10⁻⁴ mol L-1 reagent in chloroform, in a range of 0.1 to 10.0 mol L-1 acid concentrations. Complete complexation of palladium(II)-OMePT complex with maximum absorbance was observed in the range 1.0 to 8.0 mol L-1 hydrochloric acid media (Fig. 2). Therefore 1.0 mol L-1 hydrochloric acid concentration was used for this work.
3.3. Choice of Solvent
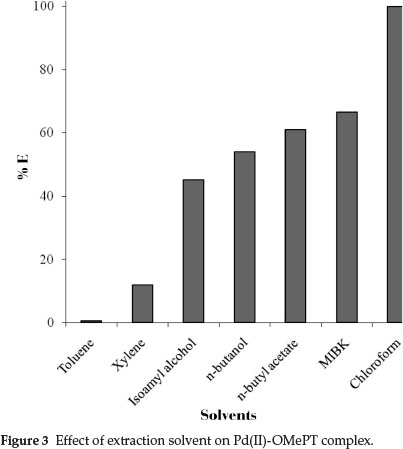
Various extraction solvents viz. toluene, xylene, benzene, n-hexane, n-butanol, n-butyl acetate, and chloroform were studied for quantitative extraction of the palladium(II)-OMePT complex (Fig. 3). Amongst the extraction solvents studied, quantitative extraction with maximum absorbance values were obtained in chloroform.
3.4. Effect of Reagent Concentration
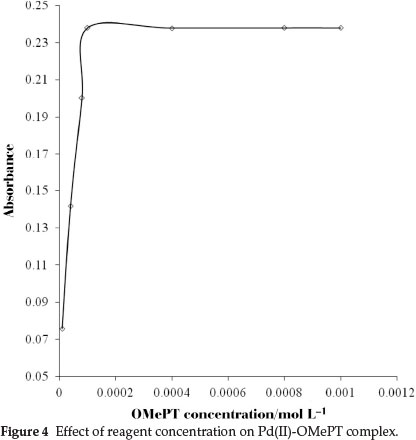
The effect of the concentration of OMePT was also investigated, a reagent concentration of 1.0 x 10⁻⁴ mol L-1 was chosen because it ensured a sufficient reagent in excess. The excess of reagent does not have any adverse effect. Different molar concentrations of OMePT from 1.0 X 10⁻⁵ mol L-1 to 1.0 X 10⁻³ mol L-1 in chloroform were studied for quantitative extraction of palladium(II)-OMePT complex (Fig. 4).
3.5. Effect of Equilibration Time and Stability of the Complex
The study of change in absorbance with variation in equilibration time was carried out over5sto30min. It has been observed that extraction was completed in 5 s and there was no any adverse effect of prolonged equilibration on extraction of the palladium(II)-OMePT complex up to 30 min. Hence 10 s equilibration time was fixed for further studies. The absorbance of the palladium(II)-OMePT complex remained stable and constant for at least 72 h.
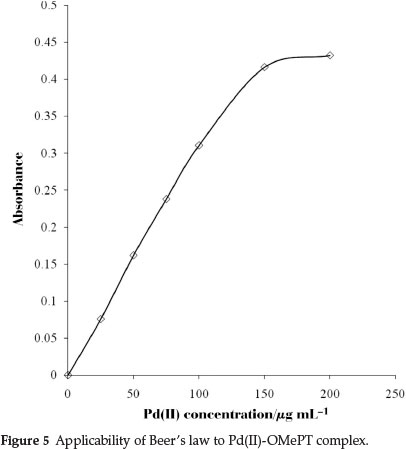
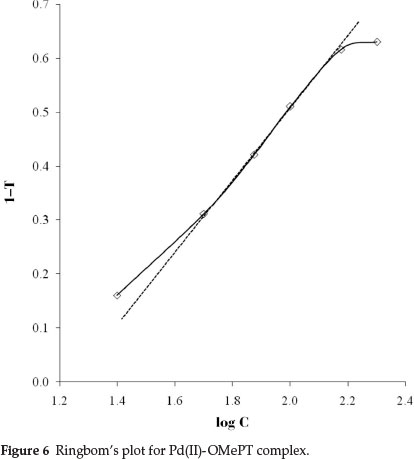
4. Analytical Figures of Merit
The system obeyed Beer's law up to 15.0 mL-1 of palladium(II) at 325 nm (Fig. 5). The molar absorptivity and Sandell's sensitivity were 3.38 X 10³ L mol-1 cm-1 and 0.031 µg cm-2, respectively. The optimum range as defined by Ringbom's plot30 (Fig. 6) is 3.98 to 15.00 µg cm-3; slope of Ringbom's plot is 0.7110. Hence, the ratio between the relative error in concentration and photometric error is 3.2391. A literature survey revealed that the proposed method is advantageous in that it has a wide range of validity of Beer's law (Table 1). The correlation coefficient value of Pd(II)-OMePT complex with an independent variable as concentration in mL-1 and a dependent variable as absorbance was found to be 0.96, indicated a clear linearity between these variables. The slope value and intercept for the best fitted line were obtained are 0.0209 and 0.0634. Therefore the content of palladium(II) in real samples can be determined using the straight line equation y = 0.0209x + 0.0634.
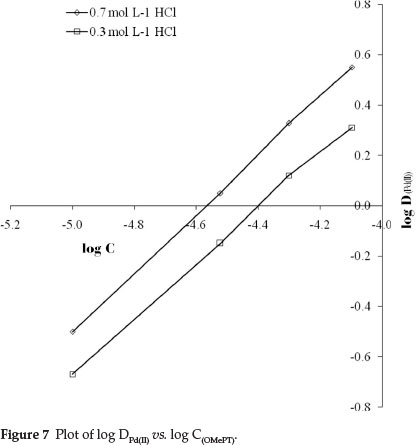
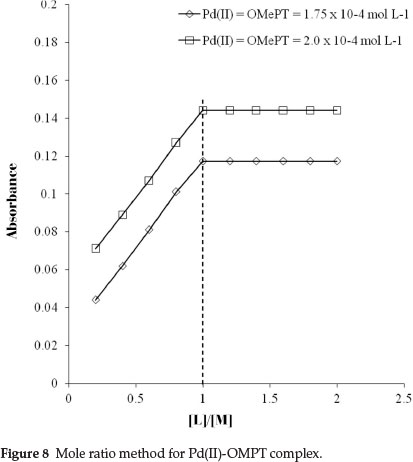
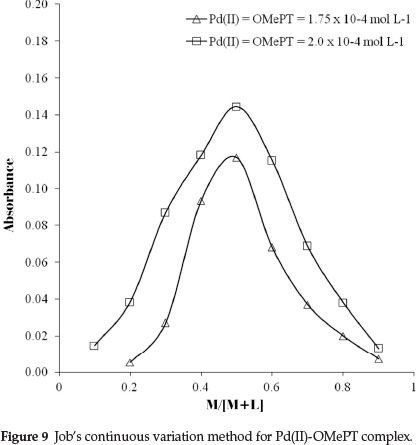
The molar ratio of palladium(II) to OMePT in the complex was determined by the slope ratio, Job's method of continuous variation and the mole ratio methods. The plot of logDPd(II) against logCOMePT at 0.7 mol L-1 and 0.3 mol L-1 hydrochloric acid concentrations shows linearity with slopes 1.17 and 1.09, respectively, as shown in Fig. 7. The probable composition of the complex Pd(II): OMePT was therefore 1:1. This composition was also verified by the mole ratio method (Fig. 8) and was confirmed by Job's continuous variation method (Fig. 9).
4.1. Interference Study
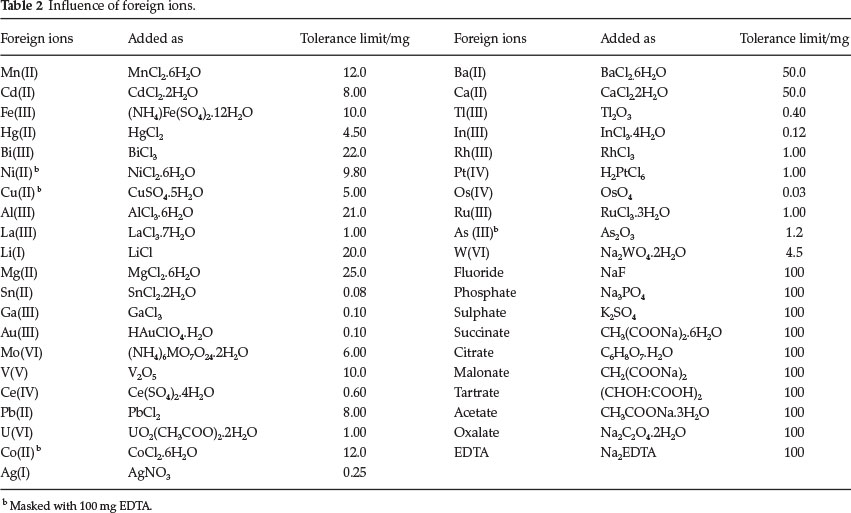
Various amounts of foreign ions were added to a fixed amountof palladium(II) in order to find the tolerance limits of these ions in extraction spectrophotometric determination of Pd(II) (Table 2). An error of ±2% in the absorbance values was considered to be tolerable. The only interfering ion was silver(I) because of its precipitation as silver chloride.
4.2. Precision and Detection Limit
To test the precision of the method, five successive measurements on the sample solution were carried out. The small RSD indicated a high precision. The detection limit for palladium(II) was 0.038 mL-1, and it is determined as amount corresponding to thrice the standard deviation blank value.
5. Applications
5.1. Separation and Determination of Palladium(II) from Binary Synthetic Mixtures
The proposed method permits separation and determination of palladium(II) from associated metal ions containing Mn(II), Mo(VI), W(VI), Mg(II) and Co(II). Palladium(II) was separated from Mn(IF), Mo(VI), W(VI) and Mg(II) as per the recommended procedure (section 2.3). The results are reported in Table 3. The percentage relative standard deviation indicates good accuracy of the method.
5.2. Separation of Palladium (II) from Synthetic Mixtures Corresponding to Alloys
As real samples were not available in the laboratory, palladium was determined in synthetic mixtures corresponding to alloys. From these alloys palladium was selectively determined by the method presented here. The results were in good agreement with those obtained by atomic absorption spectroscopy. The results are reported in Table 4.
6. Conclusion
The proposed method was simple, sensitive, selective, reproducible and rapid with low OMePT concentration. The quantitative extraction was carried out in a single step. In comparison, other reported methods (Table 1) suffer from interferences from cations and anions and were less sensitive. The proposed method was free from interferences from a large number of cations and anions. Reported methods need a laborious and lengthy procedure to be adopted; while with the proposed method there was instantaneous complex formation with 1.0 mol L-1 hydrochloric acid (Table 1). Minimum acidic conditions also improve the merit of this method. The palladium(II)-OMePT complex was stable for more than 72 h. The proposed method was successfully applied for the determination of palla-dium(II) from synthetic mixtures corresponding to a range of alloys.
Acknowledgements
The authors are thankful to the management, Pravara Rural Education Society, Principal, A. C. S. College Satral for providing the necessary facilities in the department. Thanks to Principal, Jijamata College of Science and Arts, Bhende for constant encouragement. Authors are also thankful to the University Grants Commission, New Delhi, India for providing the Teacher Fellowship under Faculty Development Programme to one of the authors (R.N.).
References
1 J. Giljanovic andM. Brkljaca, A. Prkic, Molecules, 2011,16,7224-7236. [ Links ]
2 Y.M. Hao and H.X. Shen, Anal. Chim. Acta, 2000, 413, 87-94. [ Links ]
3 A.K. Singh, R. Negi, B. Jain, Y. Katre, S.P. Singh and V.K. Sharma, Ind. Eng. Chem. Res., 2011, 50, 8407-8419. [ Links ]
4 P.S. More and A.D. Sawant, Analyt. Lett, 1994, 27, 1737-1748. [ Links ]
5 S. Ichinoki and S. Otani, Y.J. Fujii, Liq. Chrom. Rel. Technol., 2006, 29, 2457-2469. [ Links ]
6 J. Kielhorn, C. Melber, D. Keller and I. Mangelsdorf, Inter. J. Hygie. Envir. Health, 2002, 205, 417-432. [ Links ]
7 S. Nain, N. Agnihotri and L.R. Kakkar, J. Indian Chem. Soc., 2008, 85, 228-230. [ Links ]
8 P.S. Kadyan, D. Singh, A. Sharma and I. Singh, Der Pharma Chemica, 2011, 3, 70-74. [ Links ]
9 V.J. Sawant and S.B. Jagtap, Inter. Res. J., 2009, 1, 75. [ Links ]
10 J. Karthikeyan, P. Parameshwara and A. Nityanand Shetty, Environ. Monit. Assess, 2011,173, 569. [ Links ]
11 S.R. Kuchekar, Y.S. Shelar and S.H. Han, Br. J. Anal. Chem., 2013, 10, 421-428. [ Links ]
12 S.R. Kuchekar, Y.S. Shelar, H.R. Aher and S.H. Han, Spectrochimica Acta Part A: Molecular and Biomolecular Spectroscopy, 2013, 106, 1-11. [ Links ]
13 D. Bilba, C. Paduraru and L. Tofan, Microchim. Acta, 2004,144,97-101. [ Links ]
14 S.S. Mohsen, National J. Chem, 2009, 34, 375-382. [ Links ]
15 Y. Dong and K. Gai, Bull. Korean Chem. Soc, 2005, 26, 943-946. [ Links ]
16 Y.V. Demin, L.V Borisova and I.D. Troshkina, J. Anal. Chem., 2008, 63, 135-139. [ Links ]
17 G.B. Pethe, S.G. Bhadange, M.D. Joshi and A.S. Aswar, Adv. App. Sci. Res., 2010, 1, 58-64. [ Links ]
18 Z. Huang, S. Wang, X. Yang, Q. Wei and C. Jing, Chem. Anal., 2008,53, 347. [ Links ]
19 K.J. Reddy, J.R. Kumar, C. Ramachandraiah, S.A. Redd and, A.V Reddy, Environ. Monit. Assess, 2008, 136, 337-346. [ Links ]
20 V Vojkovic and V. Druskovic, Croatica Chem. Acta, 2003, 76, 87-92. [ Links ]
21 A.M.A. Khader and K.S. Prasad, Turk. J. Chem., 1996, 20, 222-227. [ Links ]
22 B.K. Reddy, K.J. Reddy, J.R. Kumar, A.K. Kumar and A.V Reddy, Anal. Sci., 2004, 20, 925-930. [ Links ]
23 M.R. Rao and K.B. Chandrasekhar, Eur. J. Applied. Engg. Scient. Res., 2012,1, 48-56. [ Links ]
24 W. Yang, Q. Hu, Z. Huang, J. Yin, G. Xie and J. Chen, J. Serb. Chem. Soc., 2006, 71, 821-828. [ Links ]
25 M. Zeydvandi and N. Pourreza, J. Anal. Chem., 2006, 61, 744-747. [ Links ]
26 B. Du, T. Yan, S.Y. Liu, J. Wang and Q. Wei, J. Anal. Chem., 2007, 62, 794-800. [ Links ]
27 N.H. Furman, Standard Methods ofChemical Analysis, 6th edn., Malabar Florida, 1962. [ Links ]
28 R.L. Frank and P.V. Smith, Org. Syn., 1955, 3, 735. [ Links ]
29 Z. Marckzenco, Spectrophotometric Determination of Trace Elements, Ellis Hardwood Ltd, John Wiley and Sons, Chichester, 1976. [ Links ]
30 A.Z. Ringbom, Anal. Chem, 1939,115, 332. [ Links ]
Received 5 September 2014
Revised 2 December 2014
Accepted 4 December 2014
* To whom correspondence shouls be addressed. E-mail: shashi17@gmail.com

