


Services on Demand
Article
 English (pdf)
 Article in xml format
 Article references
Indicators

Related links
-
 Cited by Google
 -
 Similars in Google
Share

 Permalink
South African Journal of Chemistry
On-line version ISSN 1996-840X
Print version ISSN 0379-4350
S.Afr.j.chem. (Online) vol.67 Durban Jan. 2014
RESEARCH ARTICLE
A New Kinetic Spectrophotometric Method for Total Polyphenols Determination in White Wines
M.N. Mitic*; D.A. Kostic; D.D. Paunovic; B.T. Stojanovic; J. Lj. Pavlovic
Faculty of Sciences and Mathematics, Department of Chemistry, University of Nisi, Visegradska 33, P.O. Box 224, 18000 Nis, Serbia
ABSTRACT
This paper describes a new, simple and sensitive catalytic kinetic spectrophotometric method for the determination of total polyphenols in white wines. The method was based on the catalytic effect of Cu(II) on the oxidation of phenolic compounds by H2O2 in acid media. The reaction was followed spectrophotometrically by measuring the increase in absorbance of oxidation products at 420 nm. Under optimal experimental conditions, a differential variation of the tangent method was used to obtain a calibration curve over the range of 23.01-194.11 μg mL-1 of phenols. The calculated detection limit (3.3S0/b) was 6.77 μg mL-1 for ten replicate measurements of blank signal. The relative standard deviations for five replicate determinations on 70.0, and 170.0 μg mL-1 of galic acid were 2.49 and 1.79 %, respectively. The proposed method was successfully applied for the determination of total polyphenols in white wine samples and the results were in excellent agreement with the Folin-Ciocalteau method.
Keywords: Kinetic-spectrophotometric method, phenolics oxidation, white wine.
1. Introduction
Phenols are diverse and consist of phenolic aldehydes, hydroxybenzoic and hydroxycinnamic acids, catechins, flavonols and stilbenes, in their monometic form or conjugated to some species, such as tartaric acid in the case of cinnamic acids, among others.1 These compounds are present in wines, because they are secondary metabolites of plants. The composition of phenolics and their concentration depend on grape variety, geographical origin, soil type, collection system and grape processing. These compounds are responsible for the sensory properties of wine, and, they also are anti-carcinogenic and have an anti-inflammatory action when they are regularly ingested.2
White wines are usually made from the free-running juice, without grape mash, having no contact with the grape skins. This was thought to be the main reason for the relatively low polyphenol content and thus for the lower antioxidant activity of white wine in comparison to red wine3. White wine usually contains 240 μg mL-1 of total polyphenols on average (as gallic acid) in comparison to red wine, which contain 1877 μ-g mL-1 of total polyphenols (as gallic acid) on average.4
Folin-Ciocalteau method has been used for the determination of total polyphenols in various samples. The Folin-Ciocalteau assay for the total phenolic content is a fast and simple method and can be useful in characterizing and standardizing botanical samples. The method is based on oxidation of polyphenols by molybdotungstate in Folin-Ciocalteau reagent to yield a coloured product with lmax 745-750 nm.5
A kinetic spectrophotometric method having excellent sensitivity, sufficient accuracy, simple procedures and the necessity of less expensive apparatus is more attractive for trace metals,6-8anions9 and organic compounds6,10 in food, water and biological samples. Their sensitivity is at least 2-3 orders of magnitude higher than that of ordinary spectrophotometric methods.
2. Experimental
2.1. Equipment
Spectrophotometric measurements were performed on UV-Vis spectrophotometer, model 8453 (Agilent, Germany) with a 1 cm match glass cell. For the pH measurements, Radiometer PHM 29Bb pH metre, (MeterLab, USA) and a combined glass-calomel electrode, GK2311C, were used. All solutions were kept in a thermostatic water-bath, model MP-5A, (Julabo, USA) at 25 1 0.1 0C before the beginning of the reaction. High precision measuring for laboratory applications were performed by using an analytical balance (10.0001 g), model AB204-5, (Mettler Toledo, Switzerland). A stopwatch was used to record the reaction time.
2.2. Reagents and Solutions
Analytical grade chemicals and deionized water (MicroMed high purity water system, TKA Wasseraufbereitungssysteme GmbH) were used for the preparation of all solutions.
All the stock solutions were stored in polyethylene containers. All the polyethylene containers and the glassware used were cleaned in aqueous HCl (1:1) and then thoroughly rinsed with deionized water. A 1.000 g dm-3 Cu(II) (nitrate salt, Merck, KGaA, Darmstadt, Germany) was used as a stock solution. Cu(II) working solutions were made by suitable dilutions of the stock solution. A solution of GA (gallic acid), Sigma-Aldrich (St. Louis, MO) of 1.000 g dm-3 was prepared by weighing 0.0500 g of substance of analytical grade, using an analytical balance, and dissolved with deionized water in a calibrated volumetric flask of 50 mL. A 1.0 mol dm-3 solution of hydrogen peroxide (Merck) was prepared by an appropriate dilution of 30 % of reagent in volumetric flask of 50 mL with deionized water. A 0.10 mol dm-3 tartaric acid stock solution was subsequently prepared by dissolving 1.50 g of C4H6O6 (Merck) in water and diluting to 100 mL in a volumetric flask.
2.3. Recommended Procedure
The reaction was carried out as follows. In a special four-compartment vessel (Budarin's vessel), the solution of Cu(II) was placed in the first, solution H2O2 in the second, white wine in the third, and tartaric acid (pH = 3.5) and deionized water (total volume 10 mL) in the fourth compartment.
The vessel was thermostatted for 5 min at 25 1 0.1 0C. The contents were mixed during 60 s and then immediately transferred to the spectrophotometric cell with a part length of 1 cm. The change in absorbance was recorded at 420 nm as a function of time every 5 min for the first 40 min of the reaction. The rate of the reaction at different concentrations of each of the reactants was obtained by measuring the slope of the linear part of the kinetic curves to the absorbance plot (from Beers low A =  , dc/dt =
  , slope = dA/dt, rate = dc/dt).
2.4. Investigation of the Effect of H2O2 Concentration
A four-compartment vessel was used for investigation of the effect of H2O2 concentration. 0.50 mL standard solution of H2O2 (0.98 mol L1) were pipetted into the first compartment, 0.50 mL of the solution of Cu(II) in the second, 3 mL of white wine in the third, and tartaric acid (pH = 3.5) and deionized water (total volume 10 ml) in the fourth compartment. After that, four more vessels in which different volumes of H2O2 solution was added to the first compartment of each (0.75, 1.00, 1.25 or 1.50 mL), while the volume of the other solutions in the rest of the compartments was kept constant
2.5. Investigation of the Effect of Cu(II) Concentration
0.50 mL standard solution of Cu(II) (0.001 mol L1) were pipetted into the first compartment, 0.50 mL of the solution of H2O2 in the second, 3 mL of white wine in the third, and tartaric acid (pH = 3.5) and deionized water (total volume 10 mL) in the fourth compartment of Budarin's vessel. After that, four more vessels in which different volumes of H2O2 solution was added to the first compartment of each (0.75, 1.00, 1.25 or 1.50 mL), while the volume of the other solutions in the rest of the compartments was kept constant.
2.6. Procedure for the Calibration Curve
0.50 mL white wine and standard solution of gallic acid were pipetted into the first compartment, 0.50 mL the solution of H2O2 in the second, 0.5 mL of Cu(II) in the third, and tartaric acid (pH = 3.5) and deionized water (total volume 10 mL) in the fourth compartment of Budarin's vessel. After that, four more vessels in which different volumes of H2O2 solution was added to the first compartment of each (1.00, 2.00, 3.00 or 4.00 mL), while the volume of the other solutions in the rest of the compartments was kept constant.
2.7 Analytical Parameters
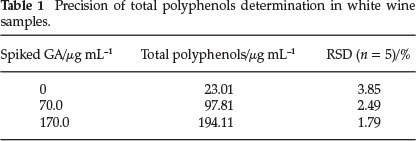
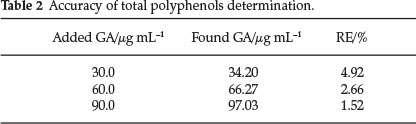
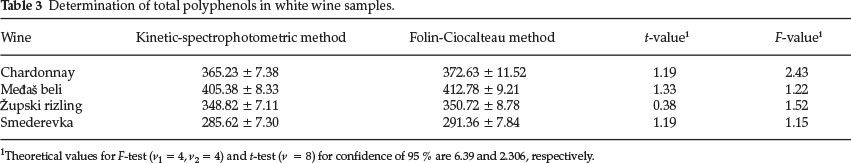
In order to asses the precision and accuracy of the proposed method, the reaction rates were determined for five replicate determinations and the results are presented in Tables 1 and 2. The method was also applied for the determination of total phenols in white wines. The results are summarized in Table 3.
3. Results and Discussion
3.1. Mechanism of the Reaction
Some metal ions, SO2, organic acids, ethanol and phenolic compounds present in wine are susceptible to oxidation, and among them phenolic compounds are considered the major substances to cause oxidizing.11 However, the oxidation of phenols is very complicated, largely depending on phenolic composition and their levels, and that o-diphenols are the most oxidizable ones (Fig. 1).12
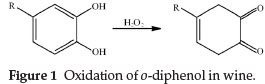
During the process of non-enzymic oxidation of wine, o-diphenols are oxidized to o-quinones.13
The quinones formed during the process as the primary products are unstable and may undergo further reactions. Quinones can spontaneously combine with nucleophilic compounds (including some phenols, sulphydryl compound and amines) due to their high electronic affinity and in the process the produced dimmers or polymers may rearrange their structure through an enol-like conversion reaction to form new diphenols.12
However, this reaction proceeds slowly in acid medium without catalytic amounts of iron and copper.13
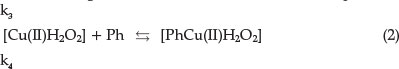
In the presence of the catalyst Cu(II) the process occurs in several stages.14
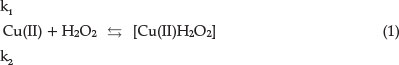
This is the reversible formation of an intermediate product. The second stage is the formation of an activated complex:
Finally, the activated complex decomposes into the product and catalyst:
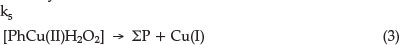
In a redox reaction the catalyst is an ion that changes oxidation state during a cycle process. The Cu(I) is oxidized again to Cu(II) by reaction (4):

The rate of the catalyzed reaction is (at constant pH):

In the stationary state the concentration of the activated complex can be determined from the relation.15

Substituting this into Eq. (5), an expression for the observed reaction rate is obtained:
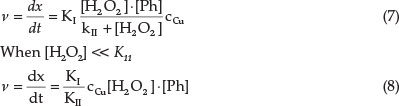
where Ccu = total concentration of copper, and K1 and Kn = new constants.
3.2. Optimization of Chemical Variables
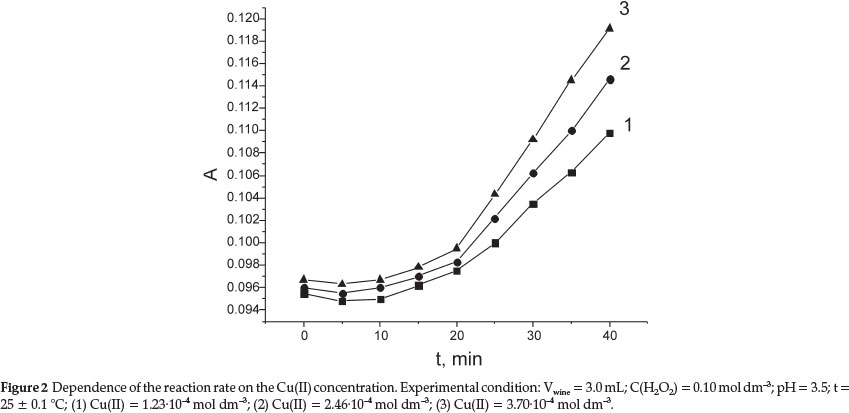
The catalytic effect of Cu(ii) on the oxidation of phenolics in white wine by hydrogen peroxide in acetic media (pH = 3.5) was observed (Fig. 2). Absorbance measurements have been performed at the wavelength of the absorption maximum of oxidation products at 420 nm, at pH of 3.5 and at 25 1 0.1 0C.
The oxidizing development follows a biphasic course, first by an decrease and consequent increase within 20 min, and then a linear rapid increase in the interval 20-40 min. A similar trend in white wines was reported in an earlier study.16 An hypothesis that may lie behind this observation is that the initial increase may be ascribed to quinone formation following oxidation of caffeic acid,17 the most abundant oxidizable substrate, which could then be reduced either by SO2 or by coupled reactions with flavanols.18
In order to establish the optimum conditions for the content analysis of phenolics in white wine, the influence of the reaction variables was studied for catalytic reaction.
The dependence of the reaction rate on the concentration of H2O2 was investigated in the range 0.10-0.29 mol dm-3 (Fig. 3).
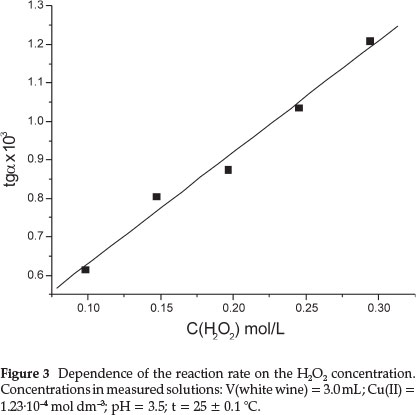
The reaction rate increased with increasing the concentration of H2O2. The analysis of this figure shows that the oxidation of phenolics in white wine follows pseudo-first order reaction kinetics with respect to H2O2 concentrations because the curve is linear. The H2O2 concentration of 0.10 mol dm-3 was selected, because at concentrations higher than 0.10 mol dm-3 the rate of the reaction became too fast, and was therefore not suitable for kinetic determinations.
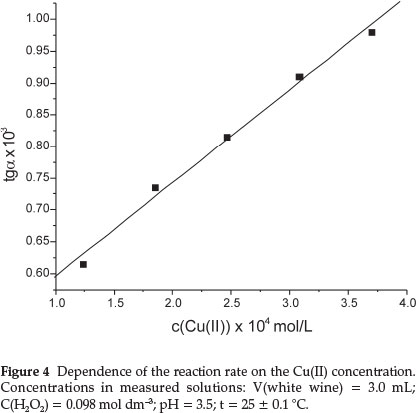
The dependence of reaction rate on the concentration of Cu(II) was investigated over the range from 1.23-10-4 to 3.70-10-4 mol dm-3 (Fig. 4). The reaction rate is of pseudo-first order with respect to Cu(II) concentration. The Cu(II) concentration of 1.232-10-4 mol dm-3 was selected, because at higher concentrations the linear part of the kinetic curve (A-t) is rather short.
The influence of temperature on the reaction rate was studied in the range 25-40 0C. The reaction rate increased as the temperature increased. However, although higher sensitivity could be obtained at a higher reaction temperature, it was troublesome to control the temperature precisely at the evaluated temperature. A reaction temperature of 25 0C was chosen.
3.3. Validation of the Proposed Method
The calibration graph has been constructed under the following working conditions: cH O = 0.10 mol dm-3; cCu(H) = 1.23-10-4 mol dm-3; pH = 3.5; t = 251 0.1 0C;l = 420 nm. Under these conditions the change in the reaction rate was quite reproducible, offering an additional routine quality control application in laboratories.
The linearity of the method was validated at five volumes of white wine. Since for the white wine sample, the true value was not known, an approximation was obtained based on spiking a white wine sample with known amounts of gallic acid (40 μ-g mL-1). The found concentration, cx (ug mL-1), (measured value) of each volume of white wine sample was calculated by the method of external standards as follows:

where tgaSample = reaction rate of sample, tgablank = reaction rate of blank sample, tgaSpiked = reaction rate of spiked sample, tgastd = reaction rate of standard, and cstd = concentration of standard solution, μ-g mL-1
The calibration curve was linear up to 194.11 μ-g mL-1 of polyphenols. The equation of the calibration curve was found to be:

The limit of detection (LOD) and the limit of quantification (LOQ) were calculated from the calibration graph as kSo/b, where k = 3.3 for LOD and 10 for LOQ, So is the standard deviation of the intercept and b is the slope of the calibration graph. LOD and LOQ are 6.77 and 20.51 μ-g mL-1, respectively.
The precision of the method was determined by consecutive analysis of white wine sample and white wine sample of the same volume, but spiked with different concentration of gallic acid. For each concentration, the average tga determined (n = 5), the standard deviation and relative standard deviation (RSD) were calculated (Table 1). The precision validation indicates that this kinetic-spectrophotometric method is suitable for polyphenols determination in white wine under the kinetic conditions described.
The accuracy of the method was measured as the agreement between the measured and the true value (found concentration and added concentration). By comparingthe found to the added concentrations, relative error (RE, %) was calculated for the determination of polyphenols (Table 2).
3.4. Application of the Developed Method
To evaluate the proposed kinetic method, the amounts of phenolics in white wine samples were determined. The results are presented in Table 3. The results of the proposed kinetic method have shown good agreement with the results obtained by Folin-Ciocalteau method19. The student's i- and F-values (Table 3) at 95 % confidence level did not exceed the tabulated i- and F-values, confirming no significant differences between the kinetic-spectrophotometric method and the reference method.
4. Conclusions
This work present development and application of a rapid, simple, low-cost and sensitive kinetic method for the determination of total polyphenols. The proposed method was applied to white wine samples. Validation was made by determination of linearity, accuracy, precision of the methods for the total polyphenols determinations in white wine. The results were compared with results obtained by using reference Folin-Ciocalteau method. The i-values and F-values, confirming no significant differences between the proposed an the reference method. The method has advantage in view of its sensitivity, low-cost, easy aviable chemicals and instrumentation, simple and direct application to white wine samples.
Acknowledgement
This work was supported by the Serbian Ministry of Education and Science Protection (grant number 174007).
References
1 M.N. Bravo, S. Silva, A.V Coelho, L. Vilas-Boas and M.R. Bronze, Anal. Chim. Acia, 2006, 563, 84-92. [ Links ]
2 TM. Goldfinger, Cardiol. Clin., 2003, 21, 449-457. [ Links ]
3 V. Katalinic, M. Milos, D. Modun, I. Music and M. Boban, Food Chem. 2004, 86, 593-600. [ Links ]
4 M.S. Fernandez-Pachon, D. Villano, M.C. Garcia-Parrilla and A.M. Troncoso, Anal. Chim. Acia, 2004, 513, 113-118. [ Links ]
5 R.L. Prior, X. Wu and K. Schaich, J. Agric. Food Chem., 2005, 53,42904302. [ Links ]
6 S.S. Mitic, R.J. Micic and R.M. Simonovic, Food Chem., 2009,117,461465. [ Links ]
7 G.A. Crespo, F.J. Andrade, F.A. Inon and M.B. Tudino, Anal. Chim. Acta, 2005, 539, 317-325. [ Links ]
8 S.R. Crouch, A. SchellineandE.S.Kirkor,Anal. Chem.,2000,72,53-59. [ Links ]
9 S.S. Mitic, G.Z. Miletic and D.A. Kostic, Anal. Sci., 2003,19, 913-916. [ Links ]
10 S.M. Sunaric, S.S. Mitic, G.Z. Miletic, A.N. Pavlovic and D. Naskovic-Dokic, J. Anal. Chem., 2009, 64, 231-237. [ Links ]
11 WJ.D.Toit, J. Marais, I.S. Pretorius and M.D. Toit, S. Afr. J. Enol. Vitic., 2006, 27, 76-94. [ Links ]
12 H. Li, A. Guo and H. Wang, Food Chem., 2008, 108, 1-13. [ Links ]
13 J.C. Danilewicz, Am. J. Enol. Viticult., 2003, 54, 73-85. [ Links ]
14 I.A. Salem, M. El-Maazawi and A.B. Zaki, Int. J. Chem. Kinet., 2000,32, 643-665. [ Links ]
15 G.Z. Miletic and S.S. Mitic, J. Serb. Chem. Soc.,1993, 58,823-832. [ Links ]
16 M.I. Salacha, S. Kallithraka and I.Tzourou, Int. J. Food Sci. Tech., 2008, 43, 1073-1077. [ Links ]
17 C.T. Saucier and A.L. Waterhouse, J. Agr. Food Chem., 1999, 47, 44914494. [ Links ]
18 V. Cheynier and J.M. Ricardo-da-Silva, J. Agr. Food Chem., 1991, 39, 1047- \1049. [ Links ]
19 VL Singleton and J.A. Rossi, Am. J. Enol. Vitic., 1965,16, 144-158. [ Links ]
Received 4 January 2013
Revised 27 July 2014
Accepted 12 August 2014
* To whom correspondence should be addressed. E-mail: milanmitic83@yahoo.com

