


Servicios Personalizados
Articulo
 Inglés (pdf)
 Articulo en XML
 Referencias del artículo
Indicadores

Links relacionados
-
 Citado por Google
 -
 Similares en Google
Compartir

 Permalink
South African Journal of Chemistry
versión On-line ISSN 1996-840X
versión impresa ISSN 0379-4350
S.Afr.j.chem. (Online) vol.67 Durban ene. 2014
RESEARCH ARTICLE
Monitoring of Herbicides in Aquatic Environments using the Bubble-in-Drop Single Drop Micro-Extraction (BID-SDME) Method
Mosotho J. George
Department of Chemistry and Chemical Technology, National University of Lesotho, P.O. Roma 180, Lesotho. E-mail: jm.george@nul.ls / maluti2005@gmail.com
ABSTRACT
Environmental monitoring can be a costly exercise for the legislative bodies to enforce regulatory mechanisms since most herbicides are hazardous in the environment. This study reports on the potential application of a cheaper sample preparation method termed 'bubble-in-drop' single drop micro-extraction (BID-SDME) method for monitoring metolachlor and atrazine herbicides used in maize farming in South Africa. The method demonstrated excellent applicability for aqueous samples obtained from streams impacted by farming activities where concentrations ranging from 25 to 50 ng mL-1 were determined. The detection limits of the method were in the range of 0.047 to 0.061 ng mL-1, which are considerably lower than those prescribed by the EPA Method 507. Recovery studies using 10 ng mL-1 solutions demonstrate excellent recoveries ranging from 94 to 108 % for respective herbicides. However, the challenge remains the detection of the breakdown products since only the parent herbicides were detected in this study.
Keywords: Bubble-in-drop micro-extraction, herbicides monitoring, farming areas, water streams.
1. Introduction
As the need for food security increases globally so does the use of agrochemicals to improve the production per unit area. Pesticides are widely used globally to increase the output of the agricultural processes per unit cost through elimination of pests that would threaten the success thereof. However, in addition to the health concerns from the consumption of products produced using such practices, application of pesticides present environmental challenge since these pesticides end up polluting the environment. Most pesticides used in South Africa are triazines and acetanilide-derived herbicides, specifically atrazine and metolachlor, respectively. Lesotho receives most of its food supply from South Africa, and as such shares similar concerns regarding food contamination.
Environmental monitoring can be a costly exercise, requiring sophisticated instrumentation and trained personnel. It is necessary to develop cheaper methods that can aid in mitigating the costs faced in adopting the international methods for analysis and monitoring of commonly used herbicides. In the environment, they pose a threat of spreading and threatening biodiversity as some of them are classified as either endocrine disruptors and/or carcinogens.1,2 A number of methods have been developed and applied to the extraction and analysis of triazines and other herbicides from various environmental and biological systems. Solid phase extraction and its miniaturised derivatives have been applied extensively in the extraction of triazines and their breakdown products such as desethyl-atrazine from various water systems,3,4 soils/sediments5 and biological and biomedical samples.6 Other methods applied to triazines are membrane-based, including the molecularly imprinted polymers which improved selectivity considerably.7,8
Recently, focus has shifted to the development of cheaper solvent micro-extraction options, either through single-drop micro-extraction or membrane-assisted liquid phase micro-extraction.9 In all these studies, it has been shown that the matrix composition plays a critical role in the applicability and efficiency of the method. Solvent micro-extraction is fast evolving as a technique of choice due to its effectiveness despite using only a few micro-litres of solvent for the extraction.10,11 This technique has seen the emergence of a number of modifications all of which reportedly increase extraction efficiency: simple syringe modifications;12 a direct drop suspension;13 dynamic solvent microfilm;14 a funnel-form SDME15 and a conical device;16 drop-to-drop solvent micro-extraction;17 solidified floating solvent drop liquid-phase micro-extraction18 as well as membrane-based/assisted techniques.19,20
This article reports the results obtained using single-drop micro-extraction (BID-SDME)21 to monitor atrazine and metola-chlor herbicides from streams flowing along farming areas close to Ladybrand in the eastern Free State. In this technique, which is one of the cheapest liquid-based micro-extraction methods, a volume of air is sucked into the droplet, improving the extraction kinetics through an increased surface to volume ratio.
2. Experimental
2.1. Reagents and Chemicals
The herbicides metolachlor (Met), atrazine (Atrz) and their deuterated (2H) analogues (100 ,ug mL-1 in 1 mL ampules each) were obtained from Dr Ehrenstorfer GmbH (Augsburg, Germany). Diphenylamine (DPA) and desethylatrazine (DEA) (100 ,ug mL-1) were obtained from Chem Service (Pennsylvania, USA), while chloroform, methanol and water (all HPLC grade) were purchased from Riedel de Haen (Seelze, Germany). Sodium chloride (AR grade) was obtained from SAARChem (Johannesburg, South Africa).
2.2. Standard Solutions
The H-standards of 100 ,µg mL-1 atrazine and metolachlor, respectively, were mixed together and diluted to 1 ,µg mL-1 in MeOH and kept in a freezer at -5 °C. The deuterated (2H) standards for the same herbicides were prepared and stored in the same manner. The breakdown product, DEA, was also mixed with atrazine and metolachlor to prepare a 1 ,µg mL-1 standard mixture in MeOH and the mixture was kept in the same freezer. Standard solutions were prepared by dilution of the stock solution with methanol and injected directly (1 ,µL) into the instrument. For the extraction procedure, 0.1 g of NaCl portions were added to the aqueous solutions to make 10 % NaCl aqueous solutions.
2.3. Collection, Storage and Preparation of Samples
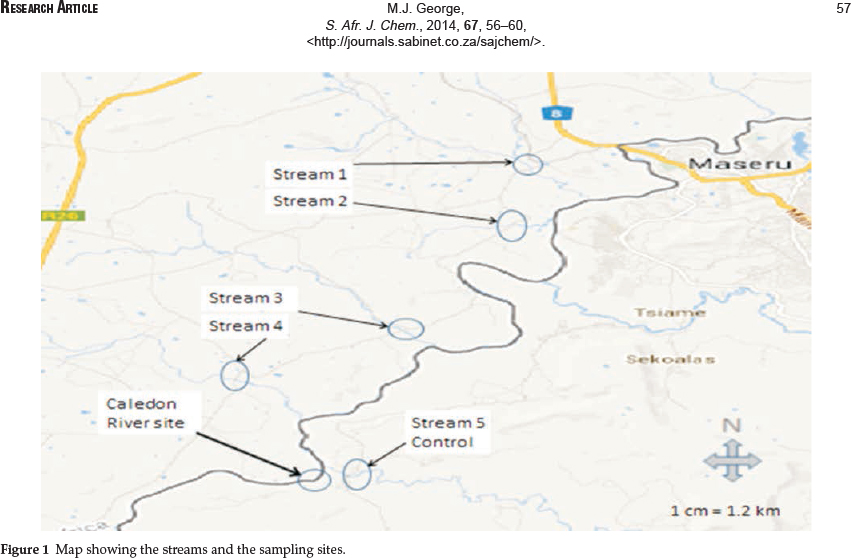
Water samples (one from each sampling site) were collected in 100 mL Schott bottles from streams running from the Free State Province of South Africa (15 - 20 km south of Ladybrand along the border with Lesotho - see Fig 1). One sample was collected from the Caledon River on the Lesotho side. The last sample was collected on the Lesotho side of the border from the stream that runs into the Caledon River (border with Free State) to be used as a control sample. These samples were stored in the fridge at -5 °C until analysis. 2 mL was transferred into 2 mL centrifuge tubes and centrifuged (Eppendorf centrifuge 5415D, Hamburg, Germany) for about 5 min to settle any suspended solids after which 1 mL of the supernatant liquid was transferred intoa1mL GC vial and extracted as described below.
2.4. Micro-extraction Procedure
The set-up for the BID-SDME extraction procedure is reported in detail elsewhere.21 1µL of the extracting solution (100 ng mL-1 DPA in chloroform) was drawn into a 10 ,µL calibrated gas-tight Hamilton GC syringe (Seelze, Germany), followed by 0.5 ,µL air. These contents were introduced into the aqueous solution by gentle depression of the plunger, causing the air to form a bubble contained within the micro-droplet. After 20 min static extraction at room temperature, the total solvent volume was carefully retracted into the syringe, and injected into the GC-MS for analysis.
For purposes of determination of the bubble-enrichment-factor (BEF), simple single-drop micro-extractions (SDME) were carried out using the standard mixture of the herbicides and the extraction efficiencies compared with those obtained with the bubble-in-drop single-drop micro-extraction (BID-SDME).
2.5. Instrumentation
The analyses were carried out using a Shimadzu (Kyoto, Japan) QP2010 gas chromatograph coupled to mass spectrometry (GC-MS) equipped with GC-MS Solution® software to which was fitted a Zebron 35MS column with 30 m x 0.25 mm x 0.25 µm dimensions. Ultra-pure helium (99.999 %, Afrox, South Africa) at a constant flow rate of 1 mL min-1 was used as the carrier gas. Injections (1 µL) were carried out in the splitless mode; after 2 min, a split ratio of >1:10 was maintained throughout the runs. The injector and transfer line were maintained at 250 °C. The oven programming started at 100 °C (held for 4 min), then ramped by 50 °C min-1 to 200 °C, followed by 10 °C min-1 to 280 °C and held for 5 min yielding total run time of 17 min.
The mass spectrometer (EI 70 eV and 1 kV at 200 °C ion source temperature) was set up on the scanning mode with mass range 50-350 mass units. The selected ions for extracted ion monitoring (EIM) were as follows: 162 (166), 169,172,200 (205) for Met, DPA, DEA and Atrz, respectively (the values in the brackets represent the 2H analogues).
Further identification was carried out using the retention times as well as comparing the ratios of the intensities of reference ions to qualifying ions compared to those obtained with standards where available, otherwise the previous literature values were used and duly referenced.
2.6. Recovery Experiments
Recovery experiments were carried out as follows: following the pipetted 1 mL of the sample aliquots into the GC vial, 10 of 1µg mL-1 deuterated (2H) sample was spiked into the solution to yield a concentration of 10 ng mL-1 for the 2H analytes. Then the solutions were extracted to establish their recovery so that the corresponding efficiency could be factored into the recovery of the 1H analytes already present in the sample.
3. Results and Discussion
3.1. Linearity, Limits of Detection and Validation of the Standards
Figure 2 shows the data for reproducibility using four samples, each extracted three times, over three days for inter-day repro-ducibility, giving n = 24. The error bars depict the standard deviation of n = 3 replicates per sample per day.
The results from Fig. 2 show very good reproducibility with the relative standard deviation (%RSD) within 10 % (9.0-3.4) for inter-vial reproducibility, while intra-vial reproducibility showed the average %RSD ranging from 2.6 to 6.2 %.
Table 1 shows the analytical data obtained from the relative responses as a function of concentration for the two herbicides and desethylatrazine breakdown product of atrazine. The table further shows the effect of the bubble on the simple drop-based extraction commonly referred to as bubble enhancement factor (BEF).
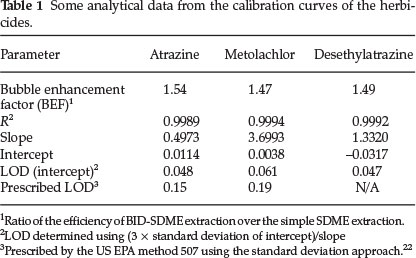
The results demonstrate a sufficient linearity in the range 0.05-5 ng mL-1 as demonstrated by the good correlation coefficient (R2) ranging from 0.9989 to 0.9994 for the three standards. However, the limits of detection obtained seem to be at the same concentration as the lowest standards used and slightly higher than the lowest metolachlor standard used (0.05 compared to 0.061 ng mL-1).
The use of the calibration data for LOD determination is more preferred since it takes into account the statistical properties of the whole data which is reported to be more reliable than the signal-to-noise ratio approach.23 The latter (S/N), however, always results in lower LOD values although they are considered subjective.24 The values thus reported (Table 1) are sufficiently within the LOD prescribed by the US EPA method 507.
3.2. Monitoring of Presence of the Herbicides in Water Samples
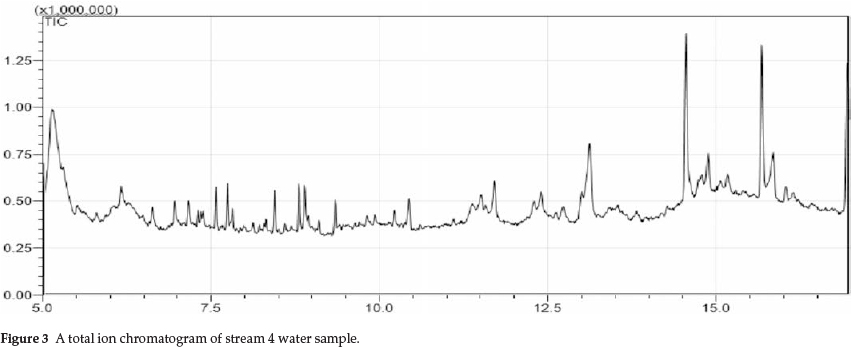
Figure 3 shows the total ion chromatogram resulting from the analysis of the stream 4 sample following BID-SDME. This sample contained the most number of analytes hence was used as the representative of the other samples' chromatograms. As can be seen this chromatogram lacks any details for a sensible analysis which is typical of the total ion monitoring at the low analytes concentrations.
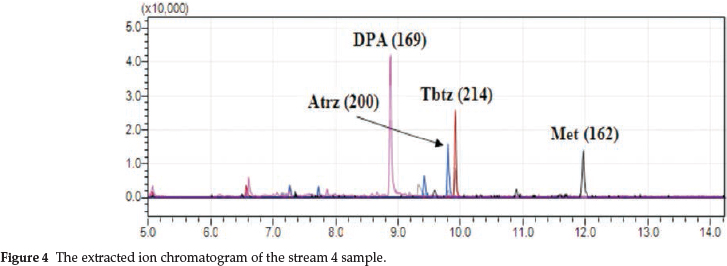
An extracted ion monitoring for the same sample (Stream 4) is shown in Fig. 4 using the three herbicides (atrazine denoted Atrz (200), terbutylazine denoted Tbtz (214), metolachlor denoted Met (162) as well as the internal standard (dipheylamine -DPA (169)) shown with the reference mass to charge ratios used in the identifications.
From the extracted ion chromatogram and after background subtraction using the embedded software, a typical mass spectrum was obtained (Fig. 5) showing the mass spectrum of atrazine (m/z 200). The calculation of the reference ion to qualifying ion ratio for this mass spectrum yields 100/70 = 1.42, which is in agreement with the ratio obtained using the standard of atrazine.
Table 2 shows the herbicides that were detected in the stream water samples as well as their calculated concentrations. The observed levels of these herbicides in these streams do not necessarily provide any correlation with their abundance since no information was available on how much was applied to which fields, with what type of soil as this also influences the mobility of these herbicides considerably, as well as the time for spraying. From a different study25 it has been demonstrated that dissipation of these herbicides takes about six months from spraying time (November-December). Interestingly no breakdown products were detected in the analysis.
The stream from Lesotho did not have detectable levels of the herbicides; presumably, because these herbicides are not widely used in Lesotho since farming is mostly restricted to subsistence level and herbicide application is considered expensive by most peasant farmers. Similarly no herbicides were detectable in the Caledon River water sample (not indicated in Table 2), possibly due to the excessive dilution rendering these herbicides' concentrations to be lower than their detection limits in the river water.
3.3. Analysis for Recovery of the 2H Analogues of the Herbicides
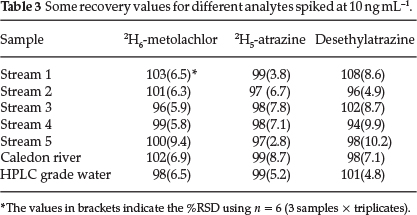
Since only the 2H5-atrazine and 2H6-metolachlor were available, these were used to assess the recovery of these analytes. Aliquots of 10 ,µL of the 1 ,µg mL-1 of the deuterated herbicide solution were used for spiking to achieve 10 ng mL-1 concentrations with the 10 % NaCl appropriately before the extraction process. Also, since no breakdown products were detected, it was considered prudent to spike the solutions with one of the breakdown products (desethylatrazine) to see if it would be extracted if spiked and to assess its recovery rate. The obtained relative extractions for these analytes were compared to those obtained using the HPLC grade water spiked and treated similarly. This HPLC grade water solution was used as a reference whose extraction efficiency was used as 100 %.
As can be seen from Table 3, all the spiked analytes extracted efficiently with their respective recoveries between 94 % and 108 %. The assessment of the two mean recoveries for desethylatrazine -101 % for HPLC grade water and 108 % from stream 1, using the student f-test reveals that these values were statistically the same at 99 % confidence.
4. General Discussion and Conclusions
BID-SDME has been demonstrated as an alternative method for the determination and monitoring of atrazine and metolachlor herbicides used widely in South African farming practices. This method gives very good reliability and reproducibility with the average relative standard deviation below 10 %. The herbicides demonstrated sufficient recoveries of between 94 and 108 %. The obtained concentrations ranging from 25 to 50 ng mL-1 do not necessarily convey a quantitative message since the actual levels are very much dependent on the presence of rains washing these herbicides from the fields; in addition, some of these streams run only during the rainy seasons. Due to restricted access to the areas, they were not visited regularly for monitoring of the levels with time. However, it would have been expected that the levels would vary depending on the flow rates of the streams that depend on presence and absence of rains, etc., washing these herbicides into the streams away from the fields where they have been applied as well as the actual levels of these herbicides in the fields where they have been applied
Acknowledgements
The author gratefully acknowledges the National University of Lesotho for financial support in this project, and Prof. D.B.G. Williams for assistance with the standards and gas chromatography columns.
References
1 US EPA Special report on environmental endocrine disruption: an effects assessment analysis, 1997, 62(50), 50J. [ Links ]
2 WHO, Guidelines for Drinking-Water Quality, vol. 1, 2nd edn., World Health Organization, Geneva, 1993, chapter 3. [ Links ]
3 S. Huang, H.I. Huang, and Y.H. Sung, Talanta, 2004, 64(4), 887-893. [ Links ]
4 J. Norrgran, R. Bravo, A.M. Bishop, D. Restrego, R.D. Whitehead, L.L. Needham and D.B. Barr, J. Chromatog. B, 2006, 830, 185-195. [ Links ]
5 C.G.ZamboninandF.Palmisano,J. Chromatog. A,2000,872,247-255. [ Links ]
6 P.C. do Nascimento, A.L.B. Rohlfes, D. Bohrer, L.M. de Carvalho and E.J. Pilau, Talanta, 2005, 65, 211-216. [ Links ]
7 F. Chapius, V. Pichon, F. Lanza, B. Sellergren and M.C. Hennion, J. Chromatog. B, 2004, 804(1), 93-101. [ Links ]
8 R.C. Martinez, E.R. Gonzalo and E.H. Hernandez, J. Chromatog. A, 2005,1085, 199-206. [ Links ]
9 C. Basheer and H.K. Lee, J. Chromatog. A, 2004,1047(2), 185-195. [ Links ]
10 M.A. Dalvie, E. Sinanovic, L. London, E. Cairncross, A. Solomon and H. Adam, Environ. Res., 2005, 98, 143-150. [ Links ]
11 E. Psillakis and N. Kalogerakis, J. Chromatog. A, 2001, 938, 113-120. [ Links ]
12 F. Ahmadi, Y. Assadi, S.M.R. Milani and M. Rezaee, J. Chromatog. A, 2006, 1101, 307-312. [ Links ]
13 L. YangchengL. Quan, L. Guangsheng, D. Youyuan Anal. Chim. Acta, 2006, 566, 259-264. [ Links ]
14 A. Mohammadi and N. Alizadeh, J. Chromatog. A, 2006,1107, 19-28. [ Links ]
15 L. Qian and Y. He, J. Chromatog. A, 2006,1134, 32-37. [ Links ]
16 C. Ye, Q. Zhou and X. Wang, J. Chromatog. A, 2007,1139, 7-13. [ Links ]
17 H.F. Wu, J.H. Yen and C. Chin, Anal. Chem.y, 2006, 78, 1707-1712. [ Links ]
18 M.R.K. Zanjani, Y. Yamini, S. Shariati and J.Ä. Jönsson, Anal. Chim. Acta, 2007, 585, 286-293. [ Links ]
19 J.Ä. Jönsson and L. Mathiasson, Trends Anal. Chem., 1999, 18(5), 318-325. [ Links ]
20 K. Ndungu and L. Mathiasson, Anal. Chim. Acta, 2000, 404, 319-328. [ Links ]
21 D.B.G. Williams, M.J. George, R. Meyer and L. Marjanovic, Anal. Chem., 2011, 83, 6713-6716. [ Links ]
22 J. Munch, Method 507, United States Environmental Protection Agency, 1995, 1-31. [ Links ]
23 J. Vial and A. Jardy, Anal. Chem, 1999, 71, 2672-2677. [ Links ]
24 M. Ribani, C.H. Collins and C.B.G. Bottoli, J. Chromatog. A, 2007,1157, 201-205. [ Links ]
25 M.J. George, Micro-extraction and detection/quantification of trace pesticides in various matrices, Ph.D. thesis, University of Johannesburg, Johannesburg, South Africa. 2012. [ Links ]
26 M.J. George, Advances in the single-drop micro-extraction pre-concentration technique, M.Sc. thesis, University of Johannesburg, Johannesburg, South Africa. 2007. [ Links ]
Received 2 December 2013
Revised 28 March 2014
Accepted 15 April 2014

