


![Synthesis and characterization of new bis-symmetrical adipoyl, terepthaloyl, chiral diimido-di-L-alanine diesters and chiral phthaloyl-L-alanine ester of tripropoxy p-tert-butyl calix[4]arene and study of their hosting ability for alanine and Na+](/img/pt/prev.gif)


Serviços Personalizados
Artigo
 Inglês (pdf)
 Artigo em XML
 Referências do artigo
Indicadores

Links relacionados
-
 Citado por Google
 -
 Similares em Google
Compartilhar

 Permalink
South African Journal of Chemistry
versão On-line ISSN 1996-840X
versão impressa ISSN 0379-4350
S.Afr.j.chem. (Online) vol.67 Durban Jan. 2014
RESEARCH ARTICLE
Beef-derived mesoporous carbon as highly efficient support for PtRulr electrocatalysts and their high activity for CO and methanol oxidation
Hui WangI, *; Huahua DaI; Rongfang WangI; Shan JiII, **
IKey Laboratory of Eco-Environment-Related Polymer Materials, Ministry of Education of China, College of Chemistry and Chemical Engineering, Northwest Normal University, Lanzhou 730070, China
IISouth African Institute for Advanced Materials Chemistry, University of the Western Cape, Cape Town, 7535, South Africa
ABSTRACT
In this work, a low-cost and nitrogen-containing carbon with mesoporous pores and high surface area was synthesized by carbonizing a natural biomass precursor, i.e. beef. It is found that the prepared material has excellent textural properties such as high specific surface areas and large pore diameters. TEM images showed that the PtRuIr nanoparticles were well dispersed on the surface of carbonized beef (C-Beef). PtRuIr/C-Beef was highly active for methanol electro-oxidation. PtRuIr/C-Beef showed superior catalytic activity to PtRuIr/C, i.e. lower onset potential and higher oxidation current density. Cyclic voltammograms of CO electro-oxidation showed that PtRuIr/C-Beef catalyst was kinetically more active for CO electro-oxidation than PtRuIr deposited on conventional carbon support. The highly porous structure and low cost of carbonized beef can be widely used as support for highly dispersed metal nanoparticles to increase their electrochemical performance as electrocatalysts.
Keywords: Carbon materials, electrocatalysts, support, beef, methanol oxidation.
1. Introduction
The binary PtRu alloy is one of the most effective electrocatalysts for methanol electro-oxidation, due to the ability of Ru in the alloy to promote fast oxidation of CO1-4. Despite the promising activity of the PtRu alloy, further improvement in activity and durability is necessary for practical application. The incorporation of a third metal, such as Ni, Sn, Fe, Co and Ir, is an effective approach to develop methanol-oxidizing catalysts with enhanced performance5-8. Among the ternary alloy catalysts, the PtRuIr/C system seems to be promising; the promoting effect of Ir on the methanol electro-oxidation has been studied to some extent with a limited composition and temperature range5,9-11.
Despite these advantages of the electrocatalysts for methanol oxidation, there is another impedement, namely corrosion of carbon supports that hinder the widespread commercialization of DMFCs12,13. Currently, carbon black, i.e. Vulcan XC 72, is the state-of-the-art support material, which dominates the support materials for Pt-based catalysts used in proton exchange membrane fuel cells (PEMFCs). Although carbon black has a high surface area and good electric conductivity, it is not satisfactory due to the weak interaction between carbon black and Pt nano-particle, which results in aggregation of Pt nanoparticles and further reducing the Pt active surface and fuel cell performance.14
Recently, nitrogen-doped carbon materials as support for Pt-based catalysts have attracted great attention.15"18 The literature shows that nitrogen-doped carbons possesses n-type or metallic behaviour which have greater electron mobility than their corresponding un-doped carbon materials.19-23 Nitrogen doping can also introduce chemically active sites onto the surface of carbon supports which act as anchoring sites for metal nanoparticles deposited on its surface.17 Although there is a great interest in the development of nitrogen-doped carbon materials due to their excellent electronic and electocatalytic properities, the nitrogen sources for preparing nitrogen-doped carbon materials are quite limited. Usually, ethylenediamine,24 ammonia,21 polypyrrole,25 pyridine,26 aniline,27 etc., were used as the precursors for nitrogen. In most of the cases, two steps were adopted to form nitrogen-doped carbon materials, which include the infiltration of the precursor and subsequently polymerization of molecules, and the resulting nitrogen-doped carbon materials often contain defects on the surface since a continuous polymer network may not be possible to form on the surface of carbon support. Unfortunately, there is no report on whether this drawback can be overcome by directly using natural biomass materials with high molecular weight and nitrogen compound.
Beef is a natural material and sustainable source with a high molecular weight and nitrogen content. Proteins that make up beef consist of 18 types of amino acids, such as glutamic acid, aspartic acid, serine, all of which contain nitrogen content within their molecular structures.28 Because of above reasons, we decided to prepare nitrogen-containing carbon materials using beef. In this work, we report a simple route for preparing nitrogen-containing carbon by carbonizing beef. Subsequently, PtRuIr nanoparticles were deposited onto the synthesized carbon support and its morphology and electrocatalytic properties were also investigated.
2. Experimental
2.1. Carbonization of Beef
Preparation of nitrogen-containing carbon was carried out by carbonizing fresh beef at high temperature in an inert gas tube furnace. 50 g of fresh beef was placed in a quartz tube furnace and then heated to 800 °C with a heating rate of 5 °C min-1 under N2 atmosphere and kept at 800 °C for 2 h. After the furnace cooled to room temperature, a black powder was obtained. The obtained powder was ball-milled for 6 h, and then immersed into 40 wt% HF solution for 2 h with stirring at room temperature. After that, the suspension was filtered, washed with deionized water and then heated at 800 °C for 2 h. Then, the black powder was added to 2 mol L-1 HNO3 solution stirred at 80 °C for 4 h. Subsequently, the black powder was rinsed and dried at 60 °C for 12 h. The resulting black powder was labelled as carbonized beef (C-Beef).
2.2. Preparation of PtRuIr/C-Beef
PtRuIr/C-Beef was synthesized by a modified organic colloid method in an ethylene glycol (EG) solution as follows: 0.59 mL of H2PtCl6 (20 mg mL-1), 0.31 mL of RuCl3 (20 mg mL-1), 1.17 mL of H2IrCl6 (10 mg mL-) were dissolved in the solution containing 30 mL of EG and 35.3 mg of sodium citrate in a 100 mL flask. The pH of the mixture solution was adjusted to 10 by using 5 wt% of KOH/EG solution while stirring vigorously. After that, 100 mg of C-Beef was introduced into the solution under ultrasonic conditions. Then, the mixture was transferred to an autoclave and heated at 160 °C for 6 h. The resulting powder was collected by filtration, rinsed with ultrapure water several times and dried overnight in a vacuum oven at 60 °C for 6 h. The catalyst, PtRuIr/ C-Beef, was obtained with 10 wt% of the metal loading. For comparative purposes, PtRuIr nanoparticle supported on Vulcan carbon XC 72 (PtRuIr/C) with the same metal loading was synthesized using the same procedure for synthesizing PtRuIr/C-Beef.
2.3. Physical Characterizations
X-ray diffraction (XRD) patterns of the catalysts were characterized on a Shimadzu XD-3A (Japan) goniometer, using Cu Ka radiation operated at 40 kV and 35 mA at room temperature. Transmission electron microscopy (TEM) and high resolution TEM measurements were carried out using a JEM-2010 Electron Microscope (Japan) with an acceleration voltage of 200 kV. The chemical composition of the samples was determined using an IRIS advantage inductively coupled plasma atomic emission spectroscopy (ICP-AES) system (Thermo, USA) the energy dispersive X-ray analysis (EDX) technique coupled to TEM. Raman spectroscopy was carried out on a Ft-Raman spectros-copy (Bruker RFS100) employing Nd:YAG laser wavelength of 1064 nm. The thermogravimetric analysis (TGA) was performed with a TGA/DSC-1 instrument system (Mettler Toledo, Swiss) at a scan rate of 10 °C min-1 up to 800 °C under protection N2 flow. The specific surface area was determined by Brunauer-Emmett-Teller (BET) method and the pore size distribution was calculated by the density functional theory (DFT) method on Quantachrome Autosorb-1 volumetric analyzer.
2.4. Electrochemical Characterizations
The electrochemical measurements of catalysts were performed on an Autolab electrochemical work station (PGSTAT128N, Eco Chemie, Netherlands). A conventional three-electrode electrochemical cell was used for the measurements, including a platinum wire as the counter electrode, an Ag/AgCl (KCl 3 mol L-1) electrode as the reference electrode, and a glass carbon electrode (5 mm in diameter) as the working electrode. The thin film electrode was prepared as follows: 5 mg of catalyst was dispersed ultrasonically in 1 mL of Nafion/ethanol (0.25 % Nafion). About 8 of the dispersion was transferred onto the glassy carbon disc using a pipette, and then dried in the air to form catalyst layer on it. Before each measurement, the solution was purged with high-purity N2 (for oxygen-free solutions) for at least 30 min.
3. Results and Discussion
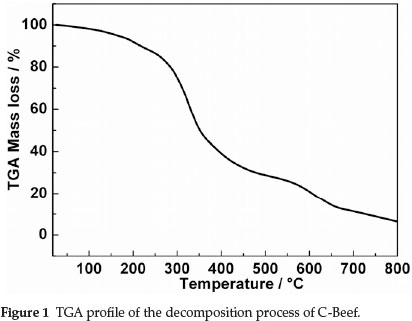
Figure 1 displays TGA profile of the decomposition process of C-Beef, from which we can obtain information on residual masses at different temperatures. As shown in Fig. 1, two stages are included in the pyrolysis process. The first stage is from the starting temperature to ~200 °C where a slight weight loss occcurs, which can be associated to the elimination of water (dehydration). While the second stage, from ~200 °C to the end, is characterized by a major loss, which relates to the main pyrolysis process (devolatilization). It proceeds at a high rate in the range ~200 °C to ~700 °C but holds a comparatively steady rate in the higher range from ~700 °C to ~800 °C, implying the formation of carbon materials.
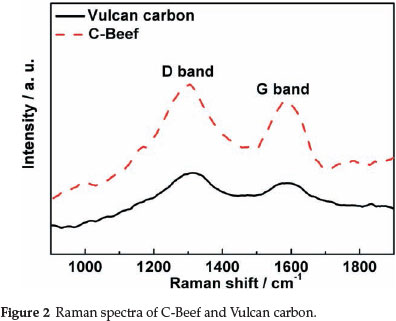
Raman spectroscopy was carried out to investigate the chemical structure and the degree of structure defect of C-Beef and Vulcan carbon (as shown in Fig. 2). Raman spectra of C-Beef and Vulcan carbon show two peaks at about 1300 and 1587 cm-1, which is the Raman active D-band and Raman active G-band, respectively.29 The D-band becomes active because of a reduction of symmetry near or at the crystalline edges, which is ascribed to the finite-sized crystals of graphite. G-band is attributed to all sp2 bonds of graphitic network.1 The ratio of the relative intensities of D-band and G-band (ID/IG) is a way to measure the crystallinity of the sample. The lower ID/IG means the crystalinity is high, and a higher ID/IG indicates more defects existed on the support.30 Therefore, it is expected that any distraction of carbon lattice will result in increasing the intensity of D-band. By measuring the Ramna spectra, the ID/IG of C-Beef and Vulcan carbon is 1.16 and 1.24, respectively. The ID/IG of C-Beef is lower than that of carbon, which indicated the crystallinity of C-Beef is better than that of Vulcan carbon, but the amount of defect for C-Beef is lower than Vulcan carbon. Usually, introduction N into carbon will result in an increase in D-band. However, in some cases, the intensity of D-band does not increase with the nitrogen content.31 Currently, there still is not a clear explanation for this phenomenon. Ghosh et al.31 suggested that N-dopants are perhaps more utilized in creating internal compartments rather than forming surface distortion.
BET surface area and porous properties of C-Beef were investigated by isotherms of adsorption-desorption of N2 at 77 K. Hysteresis loop was observed in the high relative pressure range (P/P0) (as shown in Fig. 3), which mainly results from the presence of ink-bottle type of porous structure.32 The ink-bottle pores have a larger pore size in the body, which cause the hysteresis in the high relative pressure region. The BET surface area of this C-Beef is 513 m2 g-1, which is much higher than that of Vulcan carbon, 235 m-2 g-1. According to Kelvin equation,33 this ink bottle type of pores has a large pore diameter since the hysteresis happen at high relative pressure. The pore size distribution was present as the inset in Fig. 3. The pore of C-Beef is in the range of mesopore with a peak of 3.9 nm. The low angle XRD was carried out to investigate the pore structure (as shown in Fig. 4). There is a broad peak observed at 2θ = 1.5°, which means C-Beef possesses the mesoporous structure. However, the intensity of this peak is low, suggesting the mesostructure of C-Beef is not well-ordered.34
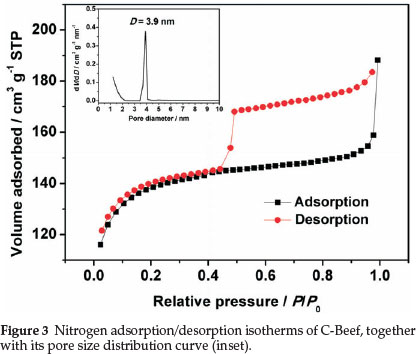
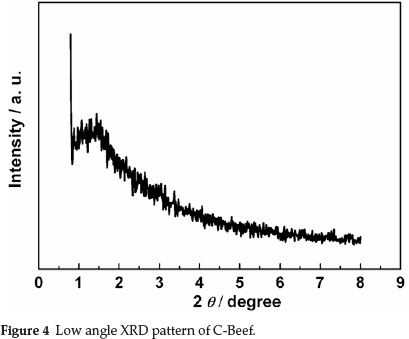
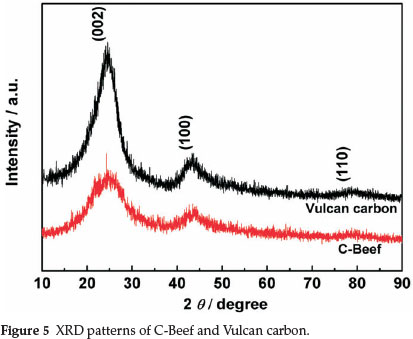
Figure 5 shows the XRD patterns of C-Beef and Vulcan carbon. The two samples show three peaks at ca. 25, 43, and 80°, which are corresponding to the (002), (100) and (110) reflection, respectively. The peak located at 2θ ≈ 25° is attributed to (002) diffraction peak referred to coke-like structural feature with disordered carbonaceous interlayers, and the (100) and (004) peaks of the CSex sample were associated with crystalline carbon.35 For C-Beef, the intensities of the (100) and (004) peak relative to that of the (200) peak become strong compared with those of Vulcan carbon, indicating that the degree of graphitization for C-Beef is higher than that of Vulcan carbon36,37, which is consistent with the results from Raman spectra.
The electrochemical performance of C-Beef and Vulcan carbon was studied by cyclic voltammograms (CVs), which were recorded in nitrogen-saturated 0.5 mol L-1 H2SO4 at a scan rate of 50 mVs-1. The current was normalized to the geometric area of the electrode. Fig. 6a and Fig. 6b present typical CV responses of the C-Beef and Vulcan carbon electrodes between -0.2 and 1.0 V, respectively. A clear pair of oxidation and reduction peaks is observed at approximately 0.4 V for both samples. These peaks can be assigned to carbon oxygen functionalities on the surface of C-Beef and Vulcan carbon, most probably to quinone-type species.38 In addition, the background current for C-Beef is larger than that of Vulcan carbon, which may be caused by the larger BET surface area of C-Beef.39 After 500 cycles scan, it can be observed that the current on Vulcan carbon electrode obviously decreases, while the current on C-Beef electrode does not clearly change, indicating C-Beef possesses good stability compared to Vulcan carbon. These results imply prepared C-Beef would exhibit good support effect, thus enhances the catalytic activity of PtRuIr nanoparticles.
The as-prepared PtRuIr/C-Beef and PtRuIr/C were characterized by XRD, as shown in Fig. 7. A broad peak at 23.5 ° observed for both catalysts can be attributed to graphite structure (002) plane of the supports. For the two catalysts, the peaks corre-spondingto (111), (200), (220) and (311) planes of polycrystalline Pt,10 cannot be clearly discerned at around 2θ =39°, 46°, 67°and 81 °, respectively, which may be result from the two factors, 1) the structure of the two catalyst is amorphou,40 and 2) the PtRuIr nanoparticles for the two catalysts are too small, which results in the broaden of the peaks.5
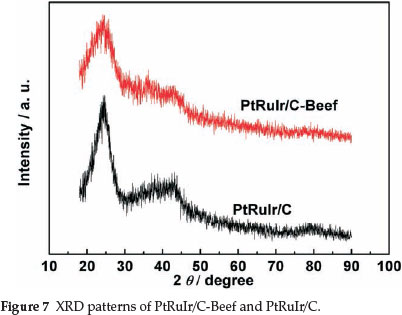
Figure 8 shows TEM images and the corresponding EDX profiles of PtRuIr/C (a, b and c) and PtRuIr/C-Beef (d, e and f), the insets in Fig. 8a and Fig. 8d are the particle size distribution of PtRuIr/C and PtRuIr/C-Beef by measuring the diameter of about 100 particles found in a randomly chosen area. The TEM images show that PtRuIr nanoparticles are well dispersed on the surface of both supports, and these nanoparticles with uniform size distribution show no aggregation in large clusters. Compared with the histogram of particle size distribution, it shows that the degree of uniform nanoparticles of PtRuIr/C-Beef is higher than that of PtRuIr/C, which is due to the existence of N groups on the surface of C-Beef facilitates the dispersion of PtRuIr nano-particles. The average particle size is 2.3 and 2.0 nm for PtRuIr/C and PtRuIr/C-Beef, respectively. In addition, crystalline PtRuIr nanoparticles, i.e. lattice planes, are not observed in HRTEM of Fig. 8b and Fig. 8e, which consist with the XRD analysis. From EDX results in Fig. 8c and Fig. 8d, it is found that Pt, Ru and Ir element are presented in both sample, confirming N element derived from amino acids only exist in PtRuIr/C-Beef. The practical loading of catalysts was evaluated by ICP analysis. The analytical results indicate that the atomic ratio of Pt:Ru:Ir for PtRuIr/C-Beef and PtRuIr/C is 1.00:0.92:0.88 and 1.00:0.95:0.90, respectively. The pratical metal loading of PtRuIr/C-Beef and PtRuIr/C is 9.5 wt% and 9.7 wt%, respectively.
XPS was carried out to determine the surface composition of the two catalysts. XPS survey spectra of the two catalysts are presented in Fig. 9. O 1s, C 1s, Ir 4f, Ru 3p and Pt 4f signals can be observed in the spectrum of PtRuIr/C. In the spectrum of PtRuIr/C-Beef, besides the above signals, N 1s appears, which again confirms the presence of N. The N 1s spectrum of PtRuIr/C-Beef shown in Fig. 10a is fitted by four component peaks ascribed to pyridinic-N, pyrrolic-N, quaternary-N, and pyridine-like oxide species.41 pyridinic-like N is nitrogen atoms bonded to two carbon atoms at the edge of graphene planes, which donates one p-electron to the aromatic π system; Pyrrolic-like N is nitrogen atoms bonded to two carbon atoms and one h atom which contribute to the π system with two p-electrons; And quaternary N is ternary nitrogen or substituted nitrogen bonded to three C atoms and incorporated into the graphene layer and replaces carbon atoms within a graphene plane. From the fitting results of the N 1s spectrum, N not only incorporated into the graphene layer but also formed a variety of functional groups, which likely play an important role in the dispersion of metal nanoparticles and the electrocatalytic process.
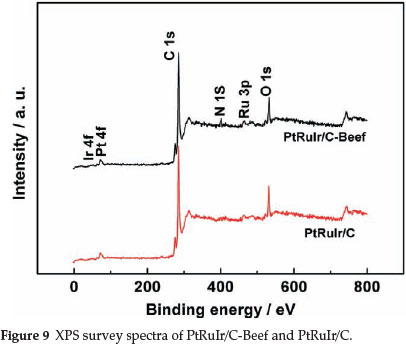
Figure 10b shows the Pt 4f XPS analysis of PtRuIr/C-Beef and PtRuIr/C catalysts, respectively. The two intense XPS peaks represent Pt 4f7/2 and 4f5/2 electrons. Compared to binding energy of Pt 4f7/2 of Pt/C,42 the binding energy of Pt 4f peaks for both catalysts is shifted towards positive position, which could be attributed to the small particle size effect.43 On the other hand, the binding energies of Pt 4f of PtRuIr/AC catalyst show higher value than that of PtRuIr/C, which could be realted to the stronger interaction between the C-Beef support and PtRuIr nanoparticles than that between Vulcan carbon and PtRuIr nanoparticles.
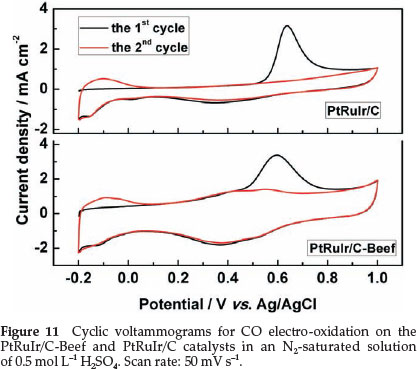
To reduce or to avoid strongly adsorbed CO species formed on the surface or to favour CO oxidation at low potential is a key parameter for electrocatalysts of DMFCs.44 The CVs normalized by the geometric area of the electrode for CO electro-oxidation on the PtRuIr/C-Beef and PtRuIr/C catalysts were carried out in an N2-saturated solution of 0.5 mol L-1 H2SO4 and shown in Fig. 11. Here, the hydrogen desorption peaks were completely suppressed in the first scan in the lower potential region (-0.2 to 0.05 vs. Ag/AgCl), due to the saturated coverage of COads species on the surface of PtRuIr alloy active sites.45 However, hydrogen desorption peaks recovered in the second cycle after the CO was removed by oxidation. As shown in Fig. 11, the onset potential of CO electro-oxidation on PtRuIr/C-Beef (0.44 V vs. Ag/AgCl) is lower than that of PtRuIr/C (0.53 V vs. Ag/AgCl), which indicates that PtRuIr/Beef is more favourable for CO electro-oxidation. The CO electro-oxidation peak of PtRuIr/C-Beef is relatively broad and shifted negatively as compared with PtRuIr/C, confirming better CO oxidation activity for PtRuIr/C-Beef. The lower peak potential and onset potential of the CO electro-oxidation on PtRuIr/C-Beef indicate that PtRuIr/Beef catalyst is kinetically more active for CO electro-oxidation.46
The electrochemical surface area (ECSA) of the catalyst was calculated using the equation:47

where QCO is the charge for CO desorption electro-oxidation in microcoulomb (µC), 480 is the charge required to oxidize a monolayer of CO on the catalyst in µC cm-2 and w is the precious metal loading, respectively. The ECSAco for PtRuIr/C-Beef and PtRuIr/C were 65.1 m2 g-1metal and 68.2 m2 g-1metal, respectively.
Based on TEM images, it is expected that ECSA of PtRuIr/C-Beef should be higher than that of PtRuIr/C. However, the ECSA of PtRuIr on the support of C-Beef is slightly lower than the ECSA on the Vulcan carbon. The results from isotherms of adsorption-desorption of N2 showed that an ink-bottle type pore was formed by carbonizing beef. In the sample of PtRuIr/C-Beef, some of very small PtRuIr nanoparticles may be formed insides the ink-bottle pores, which would result in a relative lower ECSA for PtRuIr/C-Beef.
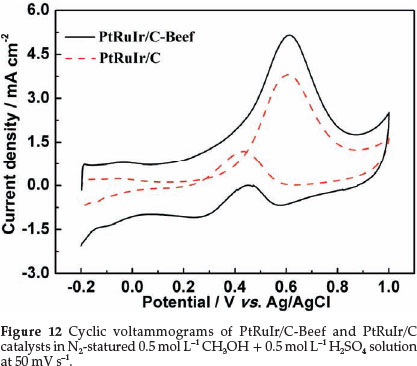
Evaluating the catalytic activity of methanol electro-oxidation of PtRuIr/C-Beef and PtRuIr/C (in Fig. 12) were performed in the potential range from -0.2 to 1.0 V in 0.5 mol L-1 CH3OH + 0.5 mol L-1 H2SO4 solution. The current was normalized to ECSACO. It was found that the onset potential of methanol electro-oxidation on PtRuIr/C-Beef is lower than that of PtRuIr/C. In the forward scan, the peak current density of PtRuIr/C-Beef (5.1 mA cm-2) is higher than that of PtRuIr/C (3.6 mA cm-2). PtRuIr/C-Beef showed superior catalytic activity to PtRuIr/C, i.e. lower onset potential and higher oxidation current density. Besides, the ratio of the forward oxidation current peak (If) to the reverse current peak (Ib), If/Ib, of PtRuIr/ C-Beef catalyst is 7.4, higher than that of PtRuIr/C (3.2), suggesting that the removal of the poisoning species on the PtRuIr/C-Beef surface is more efficient compared with PtRuIr/C catalyst. This finding can be attributed to an increased activity of catalytically active sites towards the methanol electro-oxidation on the surface of PtRuIr/C-Beef because of the mesoporous structure of C-Beef and small PtRuIr nanoparticles.
The rate of surface poisoning of PtRuIr/C-Beef and PtRuIr/C were examined using chronoamperometry, which were carried out in a N2-saturated solution of 0.5 mol L-1 H2SO4 + 0.5 mol L-1 CH3OH at a constant potential of 0.6 V vs. Ag/AgCl for 1000 s. Initially, the potentiostatic current normalized by ECSACO reduce rapidly, and the drop of potentiostatic current slows down for both catalysts over longer operation periods (as shown in Fig. 13). This phenomenon can be explained by assuming all the active sites are free from adsorbed ethanol molecules at the beginning, and after that, available active site is a function of the liberation of the active sites by the oxidation of methanol and/or intermediate species (CO, HCHO and HCOOH) formed during the reaction.48 At longer time periods although the current gradually decays for both catalysts, the PtRuIr/C-Beef catalyst maintains a higher current density than the PtRuIr/C catalyst throughout all ranges up to 1000 s. the current densities on the PtRuIr/C-Beef and PtRuIr/C electrodes at 1000 s were 0.65 and 0.56 mA cm-2, respectively. The above results demonstrated that the resistance to CO poisoning of the PtRuIr/C-Beef catalyst is much higher than that of the PtRuIr/C catalysts, which agrees with the results from the above CO stripping curves.

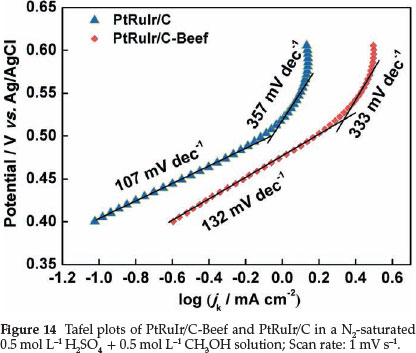
Tafel plots of methanol electro-oxidation on PtRuIr/C-Beef and PtRuIr/C derived from the linear sweep voltammetry in 0.5 mol L"-1 H2SO4 + 0.5 mol L-1 CH3OH aqueous N2 saturated solution are shown in Fig. 14. Tafel plots can be divided into two linear regions for both two catalysts. In the low potential range, the Tafel slopes involve two steps, i.e. methanol adsorption and dehydrogenation. The straight line at high potential is related to oxidative removal of CO-like species.49 The difference in the Tafel slopes at low and high potential ranges indicates a possible change of reaction mechanism, or at least a change of rate-determining steps at different potential ranges.50 In the low potential range, the Tafel slope of PtRuIr/C-Beef and PtRuIr/C are 132 and 107 mV dec"1, respectively, which indicates that the step of methanol dehydrogenation reaction on PtRuIr/C is faster than PtRuIr/C-Beef. In high potential range, a sharp change of Tafel slope shows that removal of poisonous species becomes the rate-determining processes in methanol electro-oxidation reaction. The slope value of PtRuIr/C is greater than that of PtRuIr/C-Beef at high potential, indicating the step of removing poisonous species on PtRuIr/C is slower than on PtRuIr/C-Beef.51
4. Conclusions
Natural biomass, i.e. beef, was successfully used for preparing a low-cost and nitrogen-containing carbon with mesoporous structure, which is applicable as an efficient, cheap and high surface area support materials for electrocatalysts. Mesoporous carbon with high specific surface area and large pore diameters was formed after beef was carbonized at high temperature. After PtRuIr nanoparticles were deposited on the carbonized beef, it was found that well dispersed nanoparticles were formed on its surface. PtRuIr/C-Beef showed superior catalytic activity to PtRuIr/C for methanol electro-oxidation. Compared with conventional carbon support, PtRuIr nanoparticles supported on this mesoporous carbon also show a higher electrocatalytic activity toward CO electro-oxidation. This PtRuIr nanoparticle supported on carbonized beef is highly active for methanol and CO electro-oxidation, which makes it very promising as a new support for electrocatalysts used in direct methanol fuel cells.
Acknowledgements
The authors would like to thank the National Natural Science Foundation of China (21163018), the National Science Foundation for Post-doctoral Scientists of China (20110490847, 2012T50554) and Guangdong Key Lab for Fuel Cell Technology for financially supporting this work.
References
1 Z. Chen, D. Higgins, H. Tao, R.S. Hsu and Z. Chen, J. Phys. Chem. C, 2009,113, 21008. [ Links ]
2 L. Bai, H. Zhu, J.S. Thrasher and S.C. Street, ACS Appl. Mater. Interfaces, 1, 2009, 2304. [ Links ]
3 S. Patra and N. Munichandraiah, Langmuir, 25, 2008, 1732. [ Links ]
4 W. Zhou, Y. Du, F. Ren, C. Wang, J. Xu and P. Yang, Int. J. Hydrogen Energy, 35, 2010, 3270. [ Links ]
5 S. Liao, K.-A. Holmes, H. Tsaprailis and V.I. Birss, J. Am. Chem. Soc, 2006,128, 3504. [ Links ]
6 J. Zhu, F. Cheng, Z. Tao andJ. Chen, J. Phys. Chem. C, 2008,112,6337. [ Links ]
7 K.-W. Park, J.-H. Choi, B.-K. Kwon, S.-A. Lee, Y.-E. Sung, H.-Y. Ha, S.-A. Hong, H. Kim and A. Wieckowski, J. Phys. Chem. B, 2002,106, 1869. [ Links ]
8 C.K. Poh, Z. Tian, J. Gao, Z. Liu, J. Lin, Y.P. Feng and F. Su, J. Mater. Chem., 2012, 22, 13643. [ Links ]
9 D.S. Geng, D. Matsuki, J.J. Wang, T. Kawaguchi, W. Sugimoto and Y. Takasu, J. Electrochem. Soc., 2009,156, B397. [ Links ]
10 K.I.B. Eguiluz, G.R. Salazar-Banda, D. Miwa, S.A.S. Machado and L.A. Avaca, J. Power Sources, 2008,179, 42. [ Links ]
11 Y. Ma, R. Wang, H. Wang, S. Liao, J. Key, V Linkov and S. Ji, Materials, 2013, 6, 1621. [ Links ]
12 Y.J. Wang, D.P. Wilkinson and J. Zhang, Chem. Rev., 2011,111, 7625. [ Links ]
13 L. Chen, H. Guo,T. Fujita, A. Hirata, W. Zhang, A. Inoue andM. Chen, Adv. Funct. Mater., 2011, 21, 4364. [ Links ]
14 X. Yu and S. Ye, J. Power Sources, 2007,172,145. [ Links ]
15 T. Chen, Z. Cai, Z. Yang, L. Li, X. Sun, T. Huang, A. Yu, H.G. Kia and H. Peng, Adv. Mater., 2011, 23, 4620. [ Links ]
16 Y. Chen, J. Wang, H. Liu, M.N. Banis, R. Li, X. Sun, T.-K. Sham, S. Ye and S. Knights, J. Phys. Chem. C, 2011,115, 3769. [ Links ]
17 R. Imran Jafri, N. Rajalakshmi and S. Ramaprabhu, J. Mater. Chem., 20, 2010, 7114. [ Links ]
18 H. Wang, T. Maiyalagan and X. Wang, ACS Catal., 2, 2012, 781. [ Links ]
19 R.I. Jafri, N. Rajalakshmi and S. Ramaprabhu, 2010, J. Power Sources, 195, 8080. [ Links ]
20 C. Jeyabharathi, P. Venkateshkumar, M.S. Rao, J. Mathiyarasu and K.L.N. Phani, Electrochim. Acta, 2012, 74, 171. [ Links ]
21 Y.F. Jia, B. Xiao and K.M. Thomas, Langmuir, 2001,18, 470. [ Links ]
22 Z. Rozlívková, M. Trchová M. Exnerová and J. Stejskal, Synth. Meth, 2011,161, 1122. [ Links ]
23 Y. Zhou, K. Neyerlin, T.S. Olson, S. Pylypenko, J. Bult, H.N. Dinh, T. Gennett, Z. Shao and R. O'Hayre, Energy Environ. Sci., 2010,3,1437. [ Links ]
24 D.C.Higgins,D.MezaandZ.Chen, J. Phys. Chem. C,2010,114,21982. [ Links ]
25 Y. Ma, S. Jiang, G. Jian, H. Tao, L. Yu, X. Wang, X. Wang, J. Zhu, Z. Hu and Y. Chen, Energy Environ. Sci., 2009, 2, 224. [ Links ]
26 Y. Liu, Z. Jin, J. Wang, R. Cui, H. SUn, F. Peng, L. Wei, Z. Wang, Liang, L. Peng and Y. Li, Adv. Funct. Mater., 2011, 21, 986. [ Links ]
27 Z. Lei, L. An, L. Dang, M. Zhao, J. Shi, S. Bai and Y. Cao, Micropor Mesopor Mat., 2009,119, 30. [ Links ]
28 D.A. Greenwood, H.R. Kraybill and B.S. Schweigert, J. Bio. Chem., 1951,193, 23. [ Links ]
29 Q.-H. Yang, P.-X. Hou, M. Unno, S. Yamauchi, R. Saito and T. Kyotani, Nano Lett., 2005, 5, 2465. [ Links ]
30 S. Yang, L. Zhi, K. Tang, X. Feng, J. Maier and K. Mullen, Adv. Func. Mater., 2012, 22, 3634. [ Links ]
31 K. Ghosh, M. Kumar, T. Maruyamaü and Y. Ando, Carbon, 2010,48,191. [ Links ]
32 R.-S. Juang, F.-C. Wu and R.-L. Tseng, Colloids and Surfaces A: Physicochem. Eng. Aspects, 2002, 201, 191. [ Links ]
33 D. Dollimore and G.R. Heal, J. Appl. Chem, 1964,14, 109. [ Links ]
34 M.L. Lin, M.Y. Lo and C.Y. Mou, J. Phys. Chem. C, 2009, 113, 16158. [ Links ]
35 H. Wang, H. Da, S. Ji, S. Liao and R. Wang, J. Electrochem. Soc., 2013, 160, H266. [ Links ]
36 T. Iwazaki, H. Yang, R. Obinata, W. Sugimoto and Y. Takasu, J. Power Sources, 2010, 195, 5840. [ Links ]
37 R. Chetty, S. Kundu, W. Xia, M. Bron, W. Schuhmann, V. Chirila, W. Brandl, T. Reinecke and M. Muhler, Electrochim. Acta, 2009, 54, 4208. [ Links ]
38 I. Kruusenberg, N. Alexeyeva, K. Tammeveski, J. Kozlova, L. Matisen, V. Sammelselg, J. Solla-Gullón and J.M. Feliu, Carbon, 2011,49, 4031. [ Links ]
39 J.Y. Cheon, C. Ahn, D.J. You, C. Pak, S.H. Hur, J. Kim and S.H. Joo, J. Mater. Chem. A, 2013,1, 1270. [ Links ]
40 M. Wen, H. Liu, F. Zhang, Y. Zhu, D. Liu, Y. Tian and Q. Wu, Chem. Commun., 2009, 4530-4532. [ Links ]
41 K. Wang, H. Wang, S. Ji, H. Feng, V. Linkov and R. Wang, RSC Advances, 2013, 3, 12039. [ Links ]
42 X. Zhang, H. Wang, J. Key, V. Linkov, S. Ji, X. Wang, Z. Lei and R. Wang, J. Electrochem. Soc., 2012, 159, B270. [ Links ]
43 W.P. Zhou, A. Lewera, R. Larsen, R.I. Masel, P.S. Bagus and A. Wieckowski, J. Phys. Chem. B, 2006, 110, 13393. [ Links ]
44 J. Ribeiro, D.M. dos Anjos, K.B. Kokoh, C. Coutanceau, J.M. Léger, P. Olivi, A.R. de Andrade and G. Tremiliosi-Filho, Electrochim. Acta, 2007, 52, 6997. [ Links ]
45 J. Prabhuram, T.S. Zhao, Z.K. Tang, R. Chen and Z.X. Liang, J. Phys. Chem. B, 2006, 110, 5245. [ Links ]
46 Z. Cui, P.J. Kulesza, C.M. Li, W. Xing and S.P. Jiang, Int. J. Hydrogen Energy, 2011, 36, 8508. [ Links ]
47 C. Zhou, H. Wang, F. Peng, J. Liang, H. Yu and J. Yang, Langmuir, 2009, 25, 7711. [ Links ]
48 E.M. Cunha, J. Ribeiro, K.B. Kokoh and A.R. de Andrade, Int. J. Hydrogen Energy, 2011, 36, 11034. [ Links ]
49 Y. Huang, J. Cai, M. Liu and Y. Guo, Electrochim. Acta, 2012, 83, 1. [ Links ]
50 W. Wang, Y. Li and H. Wang, Micro Nano Lett., 2013, 8, 23. [ Links ]
51 W. Wang, Y. Li and H. Wang, React. Kinet. Mech. Cat., 2013, 108, 433. [ Links ]
Received 27 August 2013
Revised 22 October 2013
Accepted 10 January 2014
* To whom correspondence should be addressed. E-mail: wanghui3931@126.com
** To whom correspondence should be addressed. E-mail: sji@uwc.ac.za

