


Serviços Personalizados
Artigo
 Inglês (pdf)
 Artigo em XML
 Referências do artigo
Indicadores

Links relacionados
-
 Citado por Google
 -
 Similares em Google
Compartilhar

 Permalink
South African Journal of Chemistry
versão On-line ISSN 1996-840X
versão impressa ISSN 0379-4350
S.Afr.j.chem. (Online) vol.67 Durban Jan. 2014
RESEARCH ARTICLE
Rating of sweetness by molar refractivity and ionization potential: QSAR study of sucrose and guanidine derivatives
Rajesh K. Singh*; Mohd. A. Khan; Pashupati P. Singh
Department of Chemistry, M.L.K. P.G. College, Balrampur, U.P., India
ABSTRACT
A quantitative structure activity relationship study of 31 sucrose derivatives and 30 guanidine derivatives has been undertaken. Their sweetness values, relative to sucrose (RS), have been taken from literature. The study has been made with the help of CAChe Pro software by using eight descriptors, viz. electron affinity, ionization potential, electrophilicity index, total energy, heat of formation, steric energy, molar refractivity and solvent accessible surface area. Multi-linear regression (MLR) analysis has been performed with different combinations of descriptors and the quality of regression has been adjudged by the correlation coefficient, cross-validation coefficient and other statistical parameters like the standard error, standard error of the estimate, degrees of freedom, etc. The study indicates that ionization potential appears an important descriptor for sucrose derivatives, whereas molar refractivity appears an important descriptor for guanidine derivatives. The ionization potential alone and in combination with the electrophilicity index, molar refractivity and solvent accessibility surface area provide dependable QSAR models for sucrose derivatives. Molar refractivity alone and in combination with solvent accessibility surface area, ionization potential and heat of formation provide dependable QSAR models for guanidine derivatives. The predicted sweetness values obtained by these QSAR models are close to observed sweetness.
Keywords: Sweetness, sucrose, guanidine, DFT, PM3.
1. Introduction
Sweetness is one of the basic tastes and is almost universally regarded as a pleasurable experience. Sucrose (table sugar) is the prototypical example of a sweet substance. Sucrose has a sweetness perception rating of 1 and other substances are rated relative to this. Sweet taste is thought to arise from the interaction of a molecule with a G-protein coupled taste receptor, identified as the T1R3 receptor at the taste receptor cells, which generate a sensation of pleasant sweetness.1-4 The study of the structure-sweet taste relationship was first systematically started with the development of the AH-B theory of sweetness proposed by Shallenberger and Acree.5 They proposed that to be sweet, a compound must contain a hydrogen bond donor (AH) and a Lewis base (B); the AH-B unit of a sweetener binds with a corresponding AH-B unit on the biological sweetness receptor to produce the sensation of sweetness. Later on the B-X theory was proposed by Lemont Kier.6 He proposed that to be sweet, a compound must have a third binding site (labelled X) that could interact with a hydrophobic site on the sweetness receptor via London dispersive forces. The most elaborate theory of sweetness to date is the multipoint attachment theory (MPA) proposed by Tinti and Nofre.7,8 This theory involves a total of eight interaction sites between a sweetener and the sweetness receptor, although not all sweeteners interact with all eight sites.
The main thrust of QSAR studies has been in the field of drug design, but there have been several applications of QSAR to the taste properties of molecules, particularly involving sweetness of different sets of compounds. QSAR studies of five families of sweet-tasting molecules have been investigated extensively.
These are sucrose, guanidine, isovanillyl, sulfamate and amino-succinamic acid derivatives with their known RS (sweetness relative to sucrose) values.9-5 Drew et al. successfully used molecular descriptors and energies derived via molecular field analysis (MFA) for the computational studies of sucrose and guanidine derivatives.9 They developed QSAR models for isovanillyl derivatives by applying molecular field analysis and physicochemical parameters selected by using the genetic algorithm method.10 Drew et al. also developed QSAR models for sulfamate derivatives by using molecular field analysis followed by selection of relevant grid points by the genetic algorithm method to distinguish sweet, sweet-bitter and bitter molecules.11
In this paper, a QSAR study of 31 sucrose derivatives and 30 guanidine derivatives has been performed. Sucrose and guanidine derivatives constitute a large class of sweet-tasting compounds in which there is a high degree of structural similarity and a wide range of sweetness. The QSAR study of sucrose and guanidine derivatives has been made with the help of eight parameters, viz. electron affinity, ionization potential, electrophilicity index, total energy, heat of formation, steric energy, molar refractivity and solvent accessible surface area. Recently, these parameters have been found useful in the QSAR study of various compounds.16-21
Drew et al. used molecular descriptors and energies for the QSAR study of sucrose and guanidine derivatives.9 QSAR models for sucrose derivatives obtained by them have good predictive quality with r2 values in the range of 0.90 and rCV2 values in the range of 0.85. The QSAR models for sucrose derivatives developed by us also have good predictive ability with r2 values in the range of 0.85 and rCV2 values in the range of 0.80. However, a mono-parametric QSAR model using ionization potential is obtained with r2 0.727709 and rCV2 0.713409. In the case of guanidine derivatives, the predictive ability of the QSAR models developed by Drew et al. were not as high as for the sucrose derivatives with r2 values around 0.70 and rCV2 values between 0.50 and 0.60. In our study, the statistical measures of the regression models for guanidine derivatives are also not as high as for the sucrose derivatives, however, a mono-parametric QSAR model using molar refractivity is obtained with r2 0.744515 and rCV2 0.703491.
2. Materials and Method
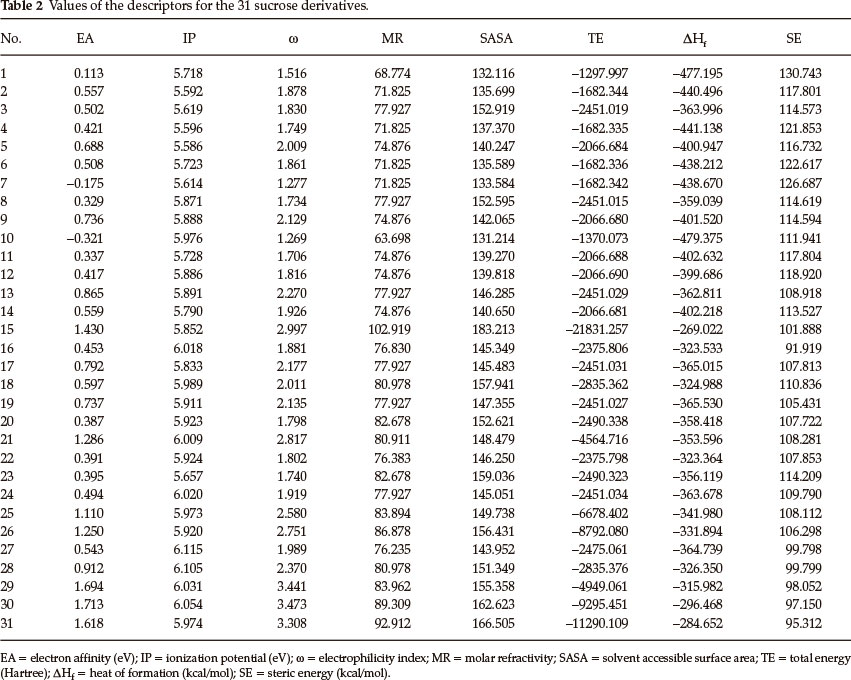
Thirty one derivatives of sucrose and thirty derivatives of guanidine, which have been taken from the literature, were used as study material. These are listed in Table 1 and Table 5 along with their observed RS (sweetness relative to sucrose) values. The QSAR studies of both sets of derivatives have been made with the help of eight descriptors, viz. electron affinity, ionization potential, electrophilicity index, total energy, heat of formation, steric energy, molar refractivity and solvent accessible surface area. The geometry optimization of all the derivatives and evaluation of values of the descriptors have been done with the help of CAChe Pro from Fujitsu software. The density functional theory22-25 based descriptors, viz. electron affinity, ionization potential, electrophilicity index and total energy have been calculated by using the DFT-B88-PW91 GGA functional with the DZVP basis sets. The values of heat of formation and steric energy have been obtained by using the PM3 method26 and the solvent accessible surface area (SASA) was calculated at an optimized geometry in water. The water geometry was from an optimization by using MOPAC with PM3 parameters and the Conductor like Screening Model (COSMO).27 The molar refractivity was calculated by the atom typing scheme of Ghose and Crippen.28 The Project Leader program associated with CAChe Pro was used for multi-linear regression (MLR) analysis. The statistical parameters were calculated by Smith's Statistical Package (version 2.80). The values of the descriptors were evaluated by solving the relevant equations given below.

According to the Koopman's theorem, the ionization potential is simply the eigenvalue of the highest occupied molecular orbital (HOMO) with change of sign and the electron affinity is the eigenvalue of the lowest unoccupied molecular orbital (LUMO) with change of sign.29
Parr et al. introduced the electrophilicity index (ω) in terms of the chemical potential and hardness.30 The operational definition of the electrophilicity index may be written as,

The total energy (TE) of a molecular system is the sum of the total electronic energy (Eee) and the energy of internuclear repulsion (Enr).31
TE = Eee + Enr .
The total electronic energy of the system is given by
Eee = ½ P(H +F) ,
where P is matrix and F is the Fock matrix. The Hartree-Fock method is an ab initio method based on averaged electron-electron interactions. The Hartree-Fock method is generally derived by assuming a specific form of the solution to the quantum mechanical equation as expressed in the electronic Schrödinger equation. This solution leads to a set of coupled homogeneous equations called the Hartree-Fock equations. The Hartree-Fock equations can be written in matrix form which is known as the Fock matrix. The total energy of the molecular system is a function of the positions of the atoms and one-particle wave functions. A density matrix is defined over the occupied orbitals and can be used along with the one- and two-electron integrals of the atomic basis in an appropriate representation of the Fock matrix. In a Hartree-Fock solution procedure, the molecular orbital coefficients are used to compute the density matrix, which in turn is used to construct the Fock matrix from the list of atomic orbital two-electron integrals.
The heat of formation is defined as:
ΔHf = Eelect + Enuc - Eisol + Eatom ,
where Eelect is the electronic energy, Enuc is the nuclear-nuclear repulsion energy, Eisol is the energy required to strip all the valence electrons of all the atoms in the system and Eatom is the total heat of atomization of all the atoms in the system.32
The steric energy of a molecule is the sum of the molecular mechanics potential energies calculated for the bonds, bond angles, dihedral angles, nonbonded atoms and so forth. It is specific to mechanics and depends upon the force-field used.33
The solvent accessibility surface area (SASA) is the surface area of a biomolecule that is accessible to a solvent and is usually quoted in square angstroms. Lee and Richards first described the solvent accessible surface area (SASA) of a molecular surface.34 SASA is typically calculated by using the 'rolling ball' algorithm developed by Sharke and Rupley.35 This algorithm uses a sphere of solvent of a particular radius to probe the surface of the molecule. The choice of the probe radius does have an effect on the observed surface area, as using a smaller probe radius detects more surface details and therefore reports a larger surface. A typical value is 1.4 Å, which approximates the radius of a water molecule.
Molar refractivity is calculated by the Lorenz-Lorentz formula36
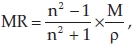
where M is the molecular weight, n is the refractive index and p is the density. For a radiation of infinite wavelength, molar refractivity represents the real volume of the molecules.
3. Results and Discussion
3.1. QSAR Study of the First Set of Compounds Containing Sucrose Derivatives
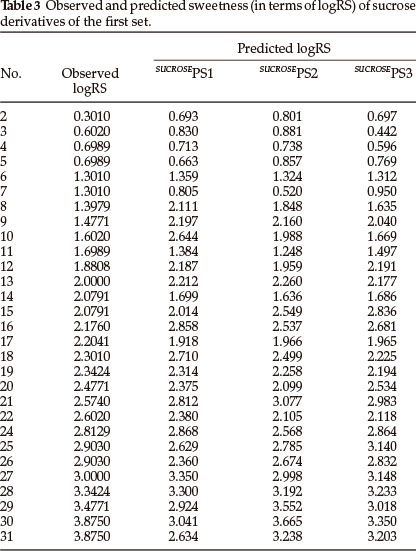
Thirty one derivatives of sucrose are given in Table 1 along with their observed sweetness in terms of logRS values. The values of the eight descriptors of the compounds, which have- been calculated, are given in Table 2. For the development of QSAR models multi-linear regression (MLR) analysis has been performed by using different combinations of the descriptors. Compound numbers 1 and 23 are outliers in the MLR analysis, i.e. removing these two compounds from the data set greatly increases the predictive ability of the QSAR models. The MLR analysis has indicated that the sweetness of sucrose can be successfully modelled even in mono-parametric regression by using ionization potential as a descriptor. This mono-parametric QSAR model is obtained from the following regression equation,
SUCROSEPS1 = 5.08109 x IP - 27.7204.
r2 = 0.727709, rCV2 = 0.713409, SE = 0.1177, SEE = 0.5028, t-value = 8.4963, P-value = 0, DOF = 0.7177, n = 29.
In the above regression equation, r2 is the squared correlation coefficient, rCV2 is the cross-validation coefficient, S.E is the standard error, SEE is the standard error of the estimate, DOF is the degrees of freedom and n is the number of data points (compounds). The ionization potential appears to be an important descriptor for this set of sucrose derivatives. The trend of observed sweetness and predicted sweetness obtained from SUCROSEPS1 is shown in Fig. 1.

The addition of the electrophilicity index (ω) in the above mono-parametric model yields a model with dramatically improved predictability. The resulting bi-parametric QSAR model is obtained from the following regression equation,
SUCROSEPS2 = 4.07088 x IP + 0.616562 x ω - 23.1215.
r2 = 0.842159, rCV2 = 0.805992, SE = 0.0833, SEE = 0.3829, t-value = 12.0028, P-value = 0, DOF = 0.8363, n = 29.
The trend of observed sweetness and predicted sweetness obtained from SUCROSEPS2 is shown in Fig. 2.

The best tri-parametric QSAR model is developed by using the descriptors ionization potential, molar refractivity and solvent accessibility surface area (SASA). This tri-parametric QSAR model is obtained from the following regression equation,
SUCROSEPS3 = 4.63976 x IP + 0.138893 x MR - 0.0712653 x SASA - 25.5542.
r2 = 0.865448, rCV2 = 0.816901, SE = 0.0759, SEE = 0.3536, t-value = 13.1759, P-value = 0, DOF = 0.8604, n = 29.
The trend of observed sweetness and predicted sweetness obtained from SUCROSEPS3 is shown in Fig. 3.

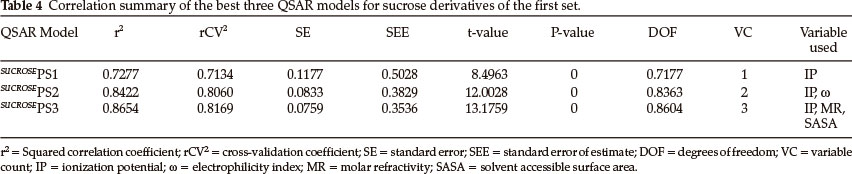
From the values of the squared correlation coefficient (r2), cross-validation coefficient (rCV2) and other statistical parameters for the above three QSAR models, it is clear that the predictive power of all models is high. Among these three QSAR models the tri-parametric model, i.e. SUCROSEPS3, is the best. It can be used to find the sweetness value of any new derivative of sucrose. The predicted logRS values, for sucrose derivatives of this set, obtained from above three QSAR models are listed in Table 3 along with their observed logRS values. A correlation summary of the best three QSAR models for sucrose derivatives of this set is presented in Table 4.
3.2. QSAR Study of the Second Set of Compounds Containing Guanidine Derivatives.
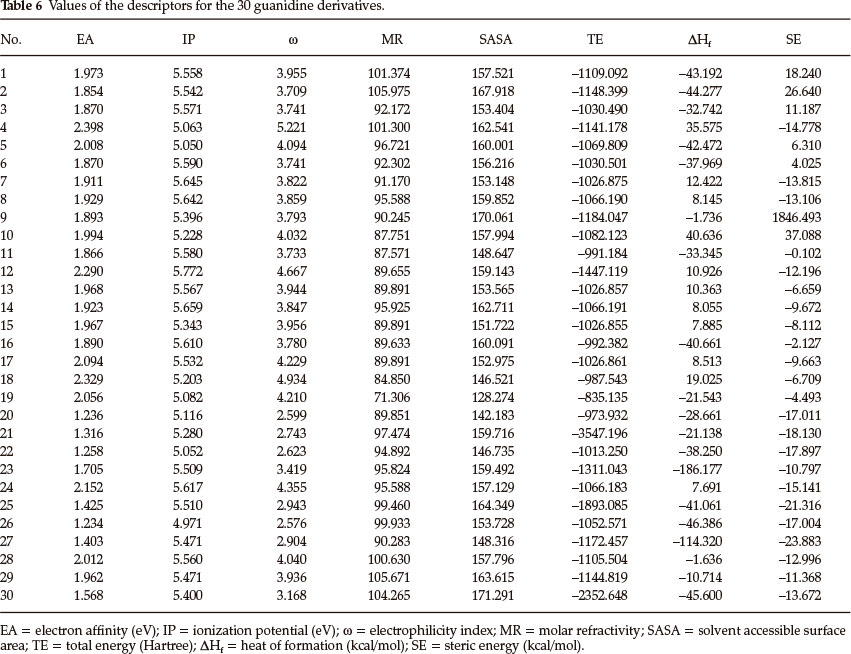
Thirty derivatives of guanidine are given in Table 5 along with their observed sweetness in terms of logRS values. The values of the eight descriptors of the compounds, which have been calculated, are given in Table 6. Multi-linear regression (MLR) analysis has been performed by using different combinations of the descriptors. Compound numbers 3,14 and 24 are outliers in the MLR analysis, i.e. removing these three compounds from the data set greatly increases the predictive ability of the QSAR models. From the MLR analysis, it was found that the sweetness of guanidine can be successfully modelled by mono-parametric regression by using molar refractivity as the descriptor. This best mono-parametric QSAR model is obtained from the following regression equation,
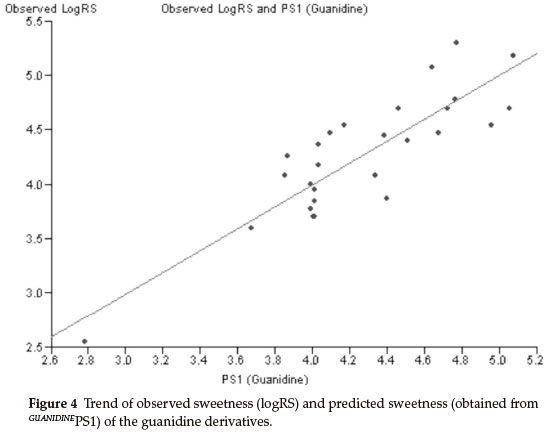
GUANIDINEPS1 = 0.0662468 x MR - 1.94682.
r2 = 0.744515, rCV2 = 0.703491, SE = 0.1171, SEE = 0.2956, t-value = 8.5371, P-value = 0, DOF = 0.7344, n = 27.
Molar refractivity appears to be an important descriptor for this set of guanidine derivatives. The trend of observed sweetness and predicted sweetness obtained from GUANIDINEPS1 is shown in Fig. 4.
The best bi-parametric QSAR model for this set of derivatives is obtained by the addition of the solvent accessibility surface area (SASA) in the above mono-parametric model. This best bi-parametric QSAR model is obtained from the following regression equation,
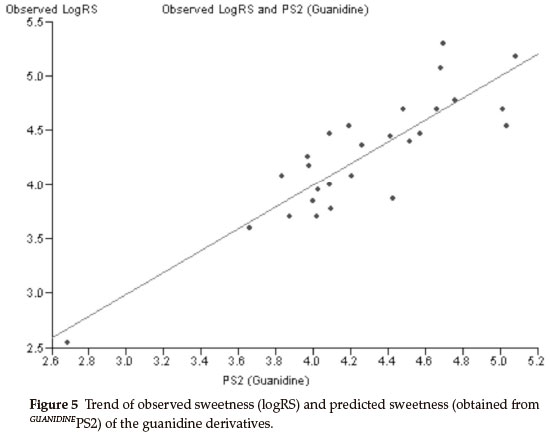
GUANIDINEPS2 = 0.0541185 x MR + 0.0133308 x SASA - 2.88913.
r2 = 0.763869, rCV2 = 0.694028, SE = 0.1112, SEE = 0.2842, t-value = 8.9917, P-value = 0, DOF = 0.7544, n = 27.
The trend of observed sweetness and predicted sweetness obtained from GUANIDINEPS2 is shown in Fig. 5.
The best tri-parametric QSAR model is developed by using the descriptors ionization potential, molar refractivity and heat of formation. This tri-parametric QSAR model is obtained from the following regression equation,
GUANIDINEPS3 = 0.33132 x IP + 0.0669111 x MR + 0.00167667 x ΔHf - 3.75749.
r2 = 0.777595, rCV2 = 0.616007, SE = 0.1070, SEE = 0.2758, t-value = 9.3485, P-value = 0, DOF = 0.7687, n = 27.
The trend of observed sweetness and predicted sweetness obtained from guanidineps3 is shown in Fig. 6.

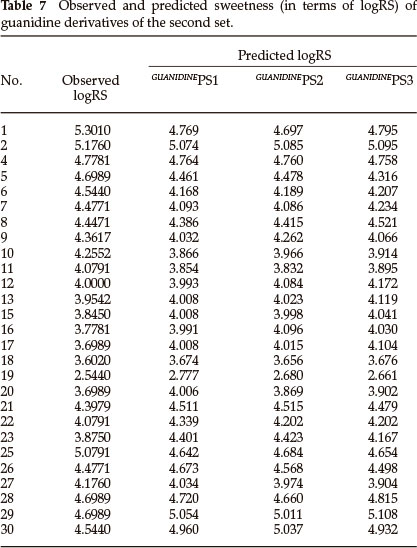
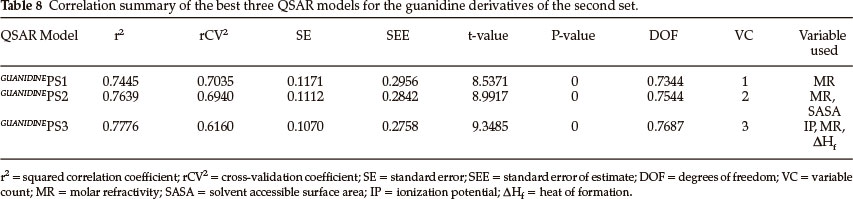
From the values of the squared correlation coefficient (r2), cross-validation coefficient (rCV2) and other statistical parameters for the above three QSAR models, it is clear that the predictive power of all models is high. Among these three QSAR models the tri-parametric model, i.e. GUANIDINEPS3, is the best which can be used to find the sweetness value of any new derivative of guanidine. The predicted logRS values, for guanidine derivatives of this set, obtained from above three QSAR models are listed in Table 7 along with their observed logRS values. A correlation summary of the best three QSAR models for guanidine derivatives of this set is presented in Table 8.
4. Conclusions
A reference to Table 4 indicates that ionization potential appears an important descriptor for sucrose derivatives. Ionization potential in combination with electrophilicity index, molar refractivity and solvent accessibility surface area provide better results. The best combination of descriptors obtained for predicting the sweetness value of sucrose derivatives is ionization potential, molar refractivity and solvent accessibility surface area.
Reference to Table 8 indicates that molar refractivity appears an important descriptor for guanidine derivatives. Molar refractivity in combination with solvent accessibility surface area, ionization potential and heat of formation provide better results. The best combination of descriptors obtained for predicting the sweetness value of guanidine derivatives is ionization potential, molar refractivity and heat of formation. Molar refractivity is related not only to the volume of the molecules but also to the London dispersive forces. Thus London dispersive forces appear to play an important role in guanidine-receptor interaction.
References
1 B. Lindemann, Physiol. Rev. 2001, 76, 718-766. [ Links ]
2 M. Kitagawa, Y. Kusakabe and H. Mius, Biochem. Biophys. Res. Commun. 2001, 283, 236-242. [ Links ]
3 E. Sainz, J.N. Korley and J.F. Battey, J. Neurochem. 2001, 77, 896-903. [ Links ]
4 X.D. Li, L. Staszewski, H. Xu, K. Durick, M. Zoller and E. Adler, Proc. Natl. Acad. Sci. 2002, 99(7), 4692-4696. [ Links ]
5 R.S. Shallenberger and T.E. Acree, Nature 1967, 216, 480-482. [ Links ]
6 L.B. Kier, J. Pharm. Sci. 1972, 61, 1394-1397. [ Links ]
7 C. Nofre and J.M. Tinti, Food Chem. 1996, 56, 263-274. [ Links ]
8 C. Nofre, J.M. Tinti and D. Glaser, Chem. Senses. 1996, 21, 747-762. [ Links ]
9 J.S. Barker, C.K. Hattotuwagama and M.G.B. Drew, Pure Appl. Chem., 2002, 74(7), 1207-1217. [ Links ]
10 A. Bassoli, M.G.B. Drew, C.K. Hattotuwagama, L. Merlini, G. Morini and G.R.H. Wilden, Quant. Struct.-Act. Relat. 2001, 20, 3-16. [ Links ]
11 M.G.B. Drew, G.R.H. Wilden, W.J. Spillane, R.M. Walsh, C.A. Ryder and J.M. Simmie, J. Agric. Food Chem. 1998, 46, 3016-3026. [ Links ]
12 A. Bassoli, L. Merlini and G. Morini, Pure Appl. Chem., 2002, 74(7), 1181-1187. [ Links ]
13 W.J. Spillane, C.M. Coyle, B.G. Feeney and E.F. Thompson, J. Agric. Food Chem, 2009, 57(12), 5486-5493. [ Links ]
14 L. Tarkoa, I. Lupescub and D.C. Groposilab, ARKIVOC, 2006, (xiii), 22-40. [ Links ]
15 L. Tarkoa, I. Lupescub and D.C. Groposilab, ARKIVOC, 2005, (x), 254-271. [ Links ]
16 VK. Sahu, A.K.R. Khan, R.K. Singh and P.P. Singh, Int. Jour. Quant. Chem. 2009, 109(6), 1243-1254. [ Links ]
17 F.A. Pasha, S.J. Cho, Y.Beg and Y.B. Tripathi, Med. Chem. Res. 2007, 16(7-9), 408-417. [ Links ]
18 H.K. Srivastava, F.A. Pasha, S.K. Mishra and P.P. Singh, Med. Chem. Res. 2009, 18, 455-466. [ Links ]
19 A.K.R. Khan, S.K. Mishra, S.A. Khan and M. Ansari, Med. Chem. Res., 2011, 21(9), 2153-2161. [ Links ]
20 R.K. Singh, A.K.R. Khan, VK. Sahu and P.P. Singh, Int. Jour. Quant. Chem. 2009, 109(2), 185-195. [ Links ]
21 VK. Sahu and R. K. Singh, CLEAN-Soil, Air, Water, 2009, 37(11), 850-857. [ Links ]
22 R.G. Parr and W. Yang, Density Functional Theory of Atoms and Molecules, Oxford University Press, 1989, New York. [ Links ]
23 W. Kohn, A.D. Becke, R.G. Parr, J. Phys. Chem. 1996, 100, 12974-12980. [ Links ]
24 W. Kohn, Rev. Mod. Phys. 1999, 71(5), 1253-1266. [ Links ]
25 K. Capelle, Braz. Jour. of Phys. 2006, 36(4A), 1318-1343. [ Links ]
26 J.J.P. Stewart, J. Comp. Chem., 1989, 10(2), 209-220. [ Links ]
27 A. Klamt and G. Schuurmann, J. Chem. Soc. Perkin Trans. 1993, 2, 799-805. [ Links ]
28 A.K. Ghose, A. Pritchett and G.M. Crippen, J. Comput. Chem. 1988, 9, 80-90. [ Links ]
29 R.G. Parr, R.A. Donnelly, M. Levy and W.E. Palke, J. Chem. Phys. 1978, 68, 3801-3807. [ Links ]
30 R.G. Parr, L.V. Szentpaly and S. Liu, J. Am. Chem. Soc. 1999, 121, 1922-1924. [ Links ]
31 R.G. Parr and W. Young, Annu. Rev. Phys. Chem. 1995, 46, 701-728. [ Links ]
32 N. Bodor, Z. Gabanyi and C.K. Wong, J. Am. Chem. Soc. 1989, 111, 3783-3786. [ Links ]
33 T. Clark, A Handbook of Computational Chemistry, John Wiley and Sons, 1985, New York. [ Links ]
34 B. Lee and F.M. Richards, J. Mol. Biol. 1971, 55(3), 379-400. [ Links ]
35 A. Shrake and J.A. Rupley, J. Mol. Biol. 1973, 79(2), 351-371. [ Links ]
36 R.J. Padron, A. Carrasco and R.F. Pellon, J. Pharm. Pharmaceut. Sci. 2002, 5, 258-266. [ Links ]
Received 31 December 2012
Revised 29 August 2013
Accepted 19 December 2013
* To whom correspondence should be addressed. E-mail: madil.khan207@gmail.com

