


Services on Demand
Article
 English (pdf)
 Article in xml format
 Article references
Indicators

Related links
-
 Cited by Google
 -
 Similars in Google
Share

 Permalink
South African Journal of Chemistry
On-line version ISSN 1996-840X
Print version ISSN 0379-4350
S.Afr.j.chem. (Online) vol.66 Durban Aug. 2013
RESEARCH ARTICLE
Making ET AAS determination less dependent on vapourization kinetics of the analytes
Nicholas DarangwaI; Dimitri A. KatskovI, *; Uwe HeitmannII
IDepartment of Chemistry, Tshwane University of Technology, P.O. Box X680, Pretoria, 0001, South Africa
IIGerman Aerospace Center, PT-SW, 12489 Berlin, Germany
ABSTRACT
The quantification of the analytes in ET AAS is normally attained by the measurement and integration of transient absorbance. High degree of atomization and constant vapour transportation rate for the analyte atoms in the absorption volume are considered to be crucial to grant correctness of the measurements. However, the second of these conditions has, in fact, never been met in the commercial tube or tube-platform ET atomizers. The vapourization of the analyte occurs during temperature rise that affects vapour transport; vapourization temperature depends on matrix or presence of chemical modifier. In the analytical practice, the problem is normally bypassed by using reference materials with physical and chemical properties similar to those of the sample. The general solution of the problem comes from the integration of running absorbance normalized with regard to vapour transportation velocity. In this work, the approach was verified by measuring absorption signals for Ag, Cd, Mn, Pb and Tl in the tube atomizer (without a platform), monitoring the temperature of the tube and calculating the instantaneous velocity of vapour transfer and respective integration. The semi-empirical formula employed to describe vapour transport velocity included the diffusion parameters specific for each element and a common constituent, attributed to gas expansion. The measurements and numerical integration were performed using various temperature ramps for the analytes alone and those introduced together with excessive amounts of Mg and Pd. The methodology suggested reduced the error associated with change of atomization kinetics from 20 to 2 %. In combination with chemical modification the measurement methodology does not require platform atomization.
Keywords: ET AAS, vapour transport, chemical modification, normalization of integrated absorbance.
1. Introduction
Since the presentation by Walter Slavin in 1981, the stabilized temperature platform furnace (STPF) concept1 became a guiding principle for designing of instrumentation for electrothermal atomic absorption spectrometry (ET AAS). The main constituents of the concept were modification of the sample through the addition of chemical reagents, platform atomization, vapourization of the analyte into the absorption volume at constant gas phase temperature and temporal integration of transient absorption (peak area measurements).
Beside the issue of chemical modification, the postulated requirements to the atomizer and measuring system could be considered as a compromise between the characteristics of first ET atomizer, 'graphite cuvette', and 'graphite furnace', introduced in AAS by L'vov and Massman, respectively.2,3 The first consisted of the independently heated graphite tube ('cuvette') and sampling probe. The sample was fast vapourized into the preheated cuvette at high constant temperature that provided a high degree of atomization and constant residence time of atoms in the absorption volume. The experimental conditions made it possible to apply temporal integration of the measured absorbance for the quantification of the analyte in the sample,4

where the absorbance A(t) corresponds to the quantity of free analyte atoms in the absorption volume, α is a constant depending on the sensitivity of the absorption line, L is tube length, ν is average gas transportation velocity and N0 is the quantity of the analyte to be measured. The design of L'vov's atomizer was not accepted by manufacturers of AA instrumentation in favour of the simplicity and practical advantages of the tube atomizers based on Massman's furnace. The design of Massman's furnace provided vapourization of the analyte from the inner wall that made easy injection of larger sample volumes, addition of chemicals or thermal treatment of the sample before the atomization, e.g. for matrix removal. In this tube atomizer the vapourization temperature, degree of atomization and residence time of atoms in the absorption volume depended on the nature of sample matrix and volatility of the analyte.
The objective of the STPF methodology1 was, firstly, to provide a dissociative atomization mechanism of the analyte on account of chemical modification and secondly, to create experimental conditions which could guarantee independence of the absorption peak area and the atomization kinetics. Usefulness of chemical modification has been proved by analytical practice5 and does not need discussing in this work. In contrast, the advantages of platform atomization for the AA measurements are not so evident.
In the platform atomizer, the sample is located on a specially machined piece of pyrographite (platform) in the central part of the tube. At the atomization stage the platform is heated via radiation from the tube wall that provides a temperature lag relative to the tube. Due to the lag the release of the analyte occurs into the analytical volume having elevated gas tempera- ture. Thus, the platform can improve atomization efficiency of the molecular fractions of the analyte in gas phase if the goal has not been already achieved on account of chemical modification. If, in contrast, full dissociation of the analyte species is already provided, the increase of vapour transportation velocity due to high temperature in the absorption volume causes reduction of determination sensitivity. Moreover, the STPF postulates related to vapour transport at the stabilized gas temperature cannot principally be realized in practice with platform atomization.6 The simulation7 showed that gas temperature in the absorption volume depends on the mass and size of the platform. For specific platform and heating rate of the tube, the velocity of vapour transport is time dependent that makes peak area subject to the vapourization kinetics of the analyte. Respectively, the quantification of the peak area measurements can be justified only for the samples and reference materials, which show similar behaviour of the transient absorption signals. In practice it is achieved by proper choice of reference material, chemical modification or thermal treatment of the sample prior to atomization, by using the method of analyte additions or by other time and labor consuming methods.
A procedure is proposed in this work to simplify analytical measurements making the output data less dependent on the atomization kinetics.
2. Theory
The general solution of the problem is readily apparent from the theory of vapour transport in ET atomizers.8 It states that Equation (1) represents a particular case of a more general equa-tion8

where vapour transportation velocity depends on temperature T and time t. Thus, the introduction of the function ν(T) makes integration invariant towards experimental conditions. In the text below, function (2) is called the 'normalized integrated absorbance'.
The integration (2) can be performed, if the mechanism of mass transfer and function T(t) are known. The main constituents of vapour transport mechanisms in ET AAS (that is diffusion, purging of the absorption volume by Ar and thermal gas expansion) were discussed earlier.9,10 Respectively, the velocity of vapour transfer for the gas-stop mode can be described by the equation:

where

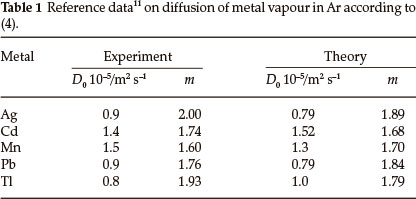
D0 (m2 s-1) and m are constants specific for each combination of metal vapour and Ar, γ = 3.67x10⁻³ K-1 is the coefficient of thermal expansion for Ar and x is the empirical parameter. The contribution of the first constituent in (3) was verified by the closeness of the diffusion parameters measured, using the tails of the absorption signals at stabilized temperature, to the theoretical values.11,12 The experimental and theoretical values of parameters D0 and m for the elements investigated in this work are presented in Table 1. The contribution of gas expansion in the vapour transport was not so evident, most probably dependent on the design of the atomizer, e.g. heating mode (longitudinal or transverse), tube length and diameter or presence of sampling hole. The value of parameter x should be justified by experiment.
The suggested methodology includes measurement and simulation of temporal behaviour of tube temperature during the atomization stage, correction of running absorption measurements using the temporal temperature function and reference data on vapour diffusion and, finally, temporal integration of the modified absorption signal.
3. Experimental
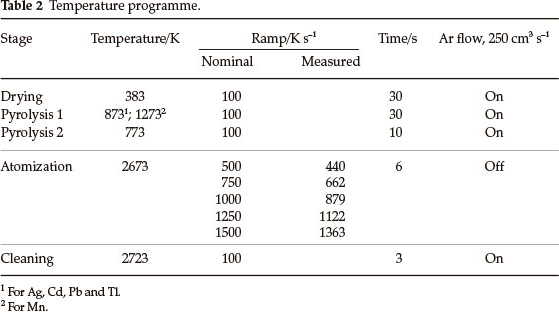
The profiles of atomic absorption signals vs. time were recorded for Ag, Cd, Mn, Pb and Tl using a prototype high-resolution continuum source (HR-CS) atomic absorption spectrometer (ISAS, Berlin, Germany)13 equipped with a transverse heated graphite tube atomizer (GTA) from Analytik Jena (Jena, Germany) without a platform. The analytes were prepared from nitrate stock solutions (Merck) by dilution with 0.2 % high-purity nitric acid (Merck) in de-ionized water; 10 or 20 µL aliquots were introduced into the tubes. The measurements and numerical integration were performed for various temperature ramps at the atomization stage and constant settings for the initial and final atomization temperatures 773 and 2673 K, respectively (Table 2). An initial pyrolysis step was used before bringing the temperature down to 773 K. The concentrations of the solutions injected into the tube were selected to provide peak height within 0.1-0.35 absorbance units. In some experiments the analyte was introduced together with excessive amounts of Mg or Pd as nitrates (300 and 500 µg, respectively) to imitate behaviour of absorption signals in the presence of chemical modifiers.
The temperature T(t) of the GTA during the atomization stage was measured similarly to that described in ref. 14 by monitoring emission from the internal surface of tube through the side opening in wavelength range 340-790 nm using an Ocean Optics HR2000 spectrometer equipped with a charge coupled device (CCD) detector connected to a PC. Data acquisition frequency for radiation intensity measurements was set to 5 ms, and averaged to 30 ms to match the absorption signals.
The text files containing absorption peak A(t) and temperature T(t) data were opened in Excel, the respective velocities ν(T) calculated using Equation (3), and the product ν(T) A(t) integrated.
4. Results and Discussion
4.1. GTA Temperature
Temperature T(t) of the tube was measured for heating ramps 500, 750, 1000, 1250 and 1500 K s-1 using two wavelengths λ1 and λ2 (550 and 575 nm, respectively) that provided direct temperature output:15
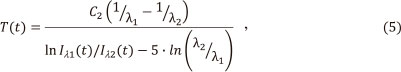
where Iλ1(t) and Iλ2(t)1 are radiation intensities at the two wavelengths λ1 and λ2 and C2 is the second radiation constant equal to 1.44 x 10⁻² mK-1. The diagrams in Fig. 1 (curves 1-5) show the CCD output Ιλ1vs. time for various heating rates. The emission steadily increased to a maximum during the ramp time, followed by a dip and then gradual increase to the maximum. The graphs of respective temperatures, calculated according to (5) are shown in Fig. 1 as curves T1-T5.
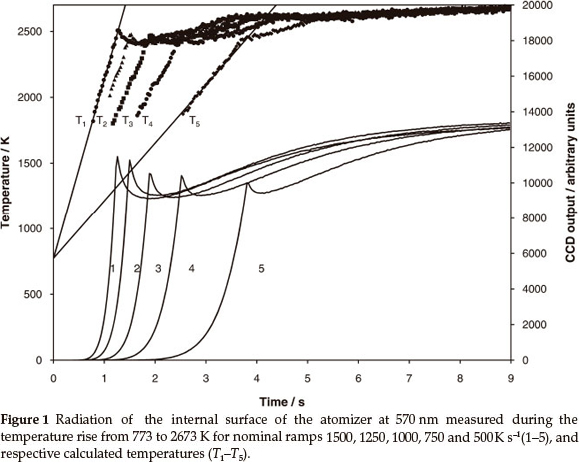
The experimental heating rates during the atomization ramp time were lower than the heating ramp setting of the instrument just as observed earlier.14 The switch from the heating ramp to stabilization was accompanied by a reduction, followed by a gradual increase in temperature (Fig. 1, curves T1-T5). Finally, all ramps temperature reached the maximum set in the heating programme. The measured stationary temperatures were very close to those evaluated earlier using a MIKRON infrared thermometer.14 According to the experimental data15 gas temperature in the tube is to be attributed to that of the tube wall.
4.2. Normalization of Integrated Absorbance
4.2.1. Simulations for Ag
Theoretical evaluation of the normalized peak area and the impact of temperature and parameters of mass transfer on the vapourization of the analyte were investigated earlier.8,14 The simulation of atomization and vapour transport in ET AAS was performed using Matlab software. The simulation results for Ag based on the model8 are presented in Fig. 2 to illustrate the suggested approach. The diagram shows the simulation for Ag measurements with heating ramps 1500, 1000 and 500 K s-1: absorption signals (curves 1a-3a), respective peak areas (curves 2b-3b) and normalized integrated absorbance according to (2) (curves 1c-3c). It is clearly seen from the figure that peak height increases with heating ramp and is accompanied by a decrease in peak areas because of growing diffusion. In contrast, the normalized integrated absorbance (curves 1c-3c) shows that the amount of metal transported through the absorption volume does not depend on the temperature programme.
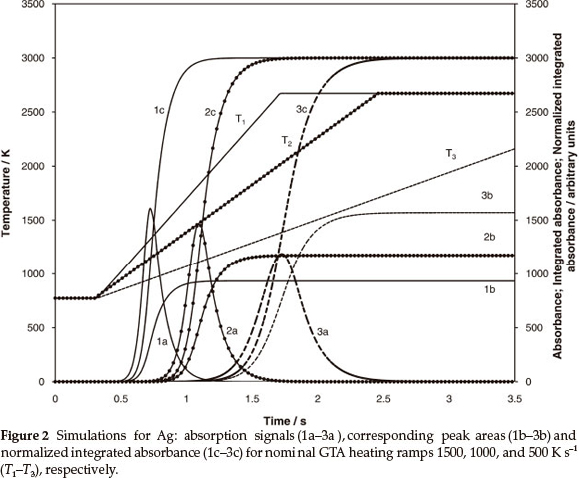
It should be noted that in the theory8 illustrated by Fig. 2, similar parameters of mass transfer were used for the generation of atomic signals and calculations of normalized integrated absorbance. This provided exact identity of final values of the normalized integrations 1c-3c. In the real situation an erroneous evaluation of factors contributing to the vapourization and mass transfer would cause divergence of the calculated values for various experimental conditions.
4.2.2. Normalization of Absorption Peak Area for Ag
The data on Ag vapour transportation in the GTA were selected as a reference source because of the low affinity of the metal towards oxygen and carbon, which, otherwise, could influence the release of metal14.
The absorption signals for 10 ppb Ag solution, obtained for the heating programmes including 1500, 1000 and 500 K s-1 temperature ramps, are reported in Fig. 3. Positions of the peak maxi-mums at about 1300-1400 K coincide with the linear range of temperature vs. time functions for all measurements. Similar to the simulations in Fig. 2, the absorption peak heights (curves 1a-3a) monotonously increase while integrated absorbance (curves 2a-3a) decrease with increasing heating ramp.
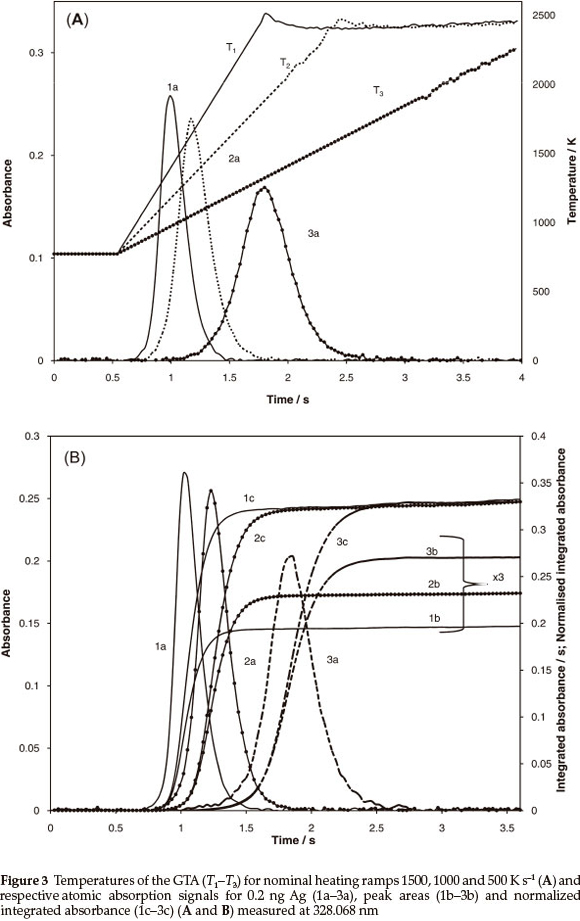
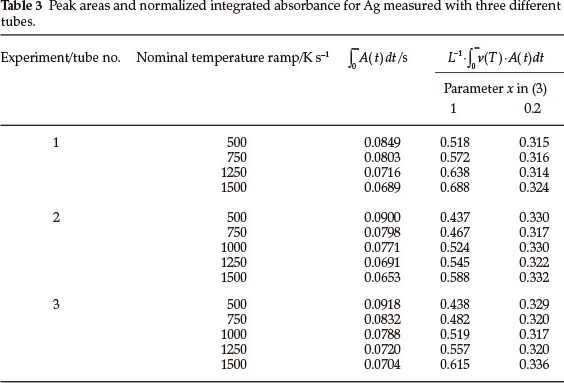
The averaged data from six replicates on integrated peak absorbance for different heating ramps are summarized in Table 3 (third column) for three tubes earlier exposed to different numbers of heating cycles. In general, a reduction in integrated peak absorbance values up to ~25 % accompanies the change in the heating rate from 500 to 1500 K s-1. The integrated absorbance normalized using the transport function (3) where x is equal to 1 and 0.2 are presented in Table 3, columns 4 and 5, respectively. It is seen that the normalized integrated absorbance calculated using transport function (3), where x = 1 does not provide invariant output (Table 3, column 4) because of the overrated contribution of thermal gas expansion. Five-fold reduction of the respective constituent made possible the equalization of the data for various ramps within satisfactory random deviation range of about 1.5-2.2 %.
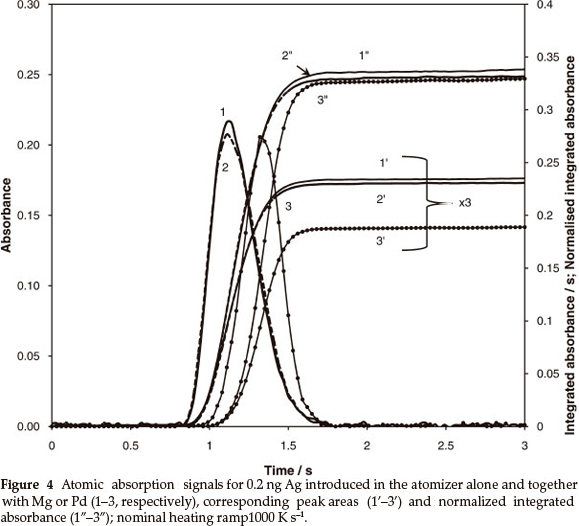
Silver vapourization kinetics was not affected by the presence of MgO as a matrix, but substantially changed when excess Pd was added to the analyte. The respective signals and calculation results for heating rate 1500 K s-1 are shown in Fig. 4. The shift of absorption peaks (curve 1 vs. curve 3) in the presence of 500 µg Pd is equal to 0.25 s. This makes the tube temperature, for the second peak, higher by 375 K. Hence, 20 % reduction of peak area occurs due to the acceleration of vapour removal (curves 1' vs. 3'). The normalization of the integrated absorbance using (3), where x = 0.2, equalizes the output (curves 1" vs. 3"). Thus, similarly reduced contribution of thermal gas expansion in the vapour transportation velocity could be expected for other metals. Consistency of the approach was examined for elements with different vapourization characteristics from Ag.
4.3. Application of the Calculation Algorithm for Mn, Tl, Pb and Cd
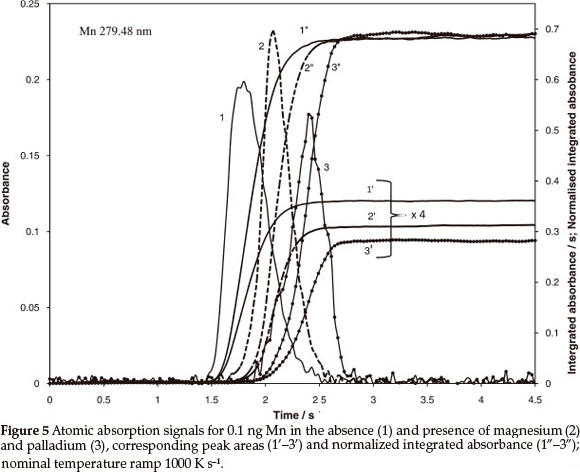
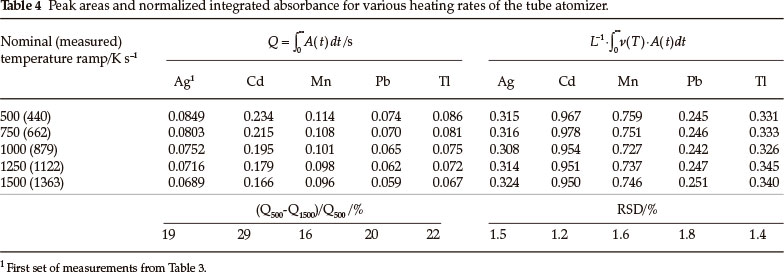
According to simulation 14, the decomposition of MnO is accompanied by an immediate vapourization of Mn with the formation of metal bound by carbon. The carbide formation is accompanied by slowing down vapour release. Since there is no gaseous species containing Mn atoms, change of heating ramp or presence of modifiers should not affect normalized integrated absorbance. The data in Table 4 and the graphs in Fig. 5 confirm the theory. The deviation of peak area data, about 16 % for various heating ramps, is reduced to 1.6 % RSD for the normalized inte- grated absorbance. The shift of absorption pulses by 0.27 and 0.6 s (Fig. 5, curves 2 and 3 vs. 1) corresponding to 270 and 600 K rise of temperature, which was caused by presence of MgO and Pd, did not affect normalized integrated absorbance (curves 1"-3"), while peak areas (curves 2'-3') were reduced respective to the shift.
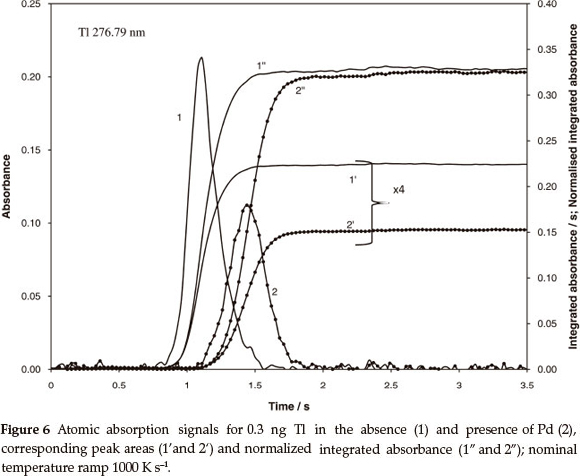
The atomization mechanism of Pb and Tl includes vapouri- zation of both metal and volatile oxide, where the contribution of each component depends on concentration of oxygen in the tube, enthalpy of oxide formation in the condensed phase and temperature but does not depend on the heating ramp of the atomizer.8 A higher degree of atomization is to be expected for Tl, because it has a lower enthalpy of vapourization than Pb (145 and 195 kJ mol-1, respectively),17 and much lower enthalpy of oxide formation (30.8 kJ mol-1 for Tl2O and 68.2 kJ mol-1 for PbO).18 Independent of the degree of atomization, stable level of the normalized integrated absorbance is to be expected for both metals and various heating ramps. However, in this case, chemical modification should produce different output. The data in Table 4 for Pb and Tl confirm independence of the normalized integrated absorbance of heating ramp: Systematic deviation of about 20 % characteristic for peak area measurements was reduced to a random error less than 2 %. Comparison of Figs 6 and 7 confirms the predictions regarding variable degree of atomization. It is seen from Fig. 6 that the Tl signal was shifted by 0.36 s or by 360 K towards high temperature due to the presence of Pd. The shift caused 30 % reduction of peak area but only about 4 % increase of the normalized integrated absorbance. Apparently, almost complete atomization has been already achieved for Tl at lower temperature, without Pd modifier.
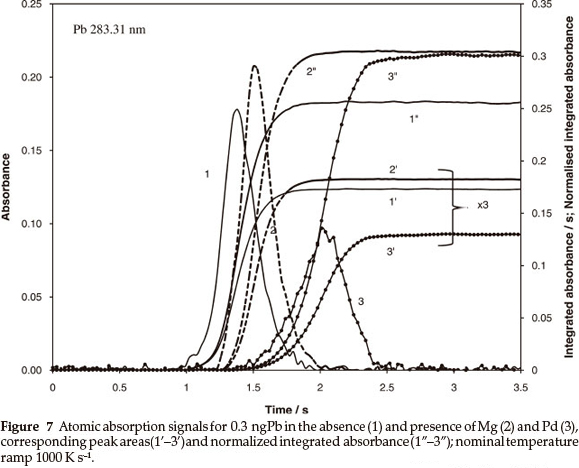
The behaviour of Pb reflected in Fig. 7 was more complicated. In the presence of MgOor Pd the absorption signals (curves 2 and 3 vs. 1) were shifted by about 0.13 and 0.6 s (by 130 and 600 K).
As a result, the normalized integrated absorbance increased by 20 % (curves 2" and 3" vs. 1") and reached similar maxima that indirectly confirms a high degree of atomization. Respective data regarding the peak areas (curves 1'-3') showed combination of two processes, increase of the atomization and reduction of the residence time of atoms in the absorption volume, leading to opposite results. Hence, a small shift of the absorption pulse due to MgO (compared to that for Pd) provides slight increase of peak area (2' vs. 1') instead of the reduction expected in case of full atomization.
The mechanism of vapour release for Cd is much different from that for other metals investigated. While its oxide is stable, the metal itself is very volatile. The temporal position of the atomic absorption signal for Cd depends on the removal rate of oxygen.8 However, the dependence should not influence the degree of atomization because of dissociative character of vapourization at low oxygen concentration characteristic for gas phase in the GTA. Thus, variations in the integrated peak absorbance corresponding to different heating ramps or presence of low volatile matrix are to be associated only with vapour transport.
The theory is partially confirmed by the data for Cd in Table 4 calculated using the diffusion parameters from Table 1 and the same empirical coefficient x equal to 0.2. According to Table 4, almost 30 % reduction of the peak area accompanied the faster vapourization. The normalization of the integrated absorbance reduced the deviation to 1.2 % including random error. The excessive mass of Mg or Pd did not strongly influence the vapourization temperature; Fig. 8 (curves 2 and 3 vs. curve 1).
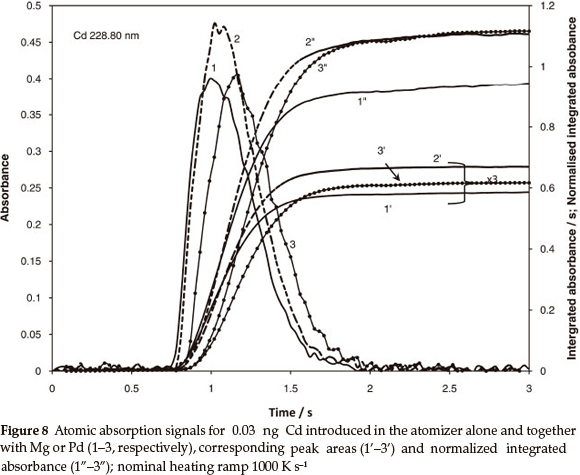
However, presence of each of the modifiers caused similar, about 20 %, increase in normalized integrated absorbance (curves 2" and 3" vs. 1") and no predictable deviations in the peak areas. Apparently, without the modifiers, the dissociative vapourization of Cd oxide is not fully achieved at low temperature, which leads to incomplete atomization. The chemical modification removes the shortcoming, and normalization of integrated absorbance stabilizes the output independent of temperature programme.
5. Conclusion
The results of this investigation show that ET AAS determination error related to the vapourization of the analyte from various matrices in the tube, without a platform, can be substantially reduced if chemical modification of the sample is employed and the normalized integrated absorbance is used for the data quantification. For the realization of the concept in practice the instantaneous temperature measurements of the tube during the atomization step are to be performed and vapour transportation velocity introduced into the integration of the absorption peak. The rejection of a platform as part of the atomizer, should make possible modification of the tubes to provide higher sensitivity, less electric power consumption and unification of temperature programmes for multi-element determination. Apparently, there should be no problem in temperature measurements in modern ET AAS instruments, which provide programmed heating. Closeness of the experimental and theoretical diffusion parameters show that theoretical values for a number of elements12 can be employed in the calculation of vapour transportation velocity. The empirical parameter related to the contribution of gas expansion can be easily found for particular type of atomizer from the measurements of normalized integrated absorbance for various heating ramps.
Acknowledgements
The authors express their gratitude to National Research Foun- dation of South Africa and Tshwane University of Technology for the financial support of the research.
References
1 W. Slavin, D.C. Manning and G.R. Carnrick, Atomic Spectrometry, 1981, 2, 137-145. [ Links ]
2 B.V. L'vov, Inzhener-Fiz. Zhur., Akad. Nauk Belorus. SSR. J. Eng. Phys. (USSR), 1959, 2/2, 44-52. [ Links ]
3 H. Massmann, Spectrochim. Acta, 1968, 23B, 215-226. [ Links ]
4 B.V. L'vov, Atomic Absorption Spectrochemical Analysis, Adam Hilger, London, England, 1970. [ Links ]
5 B. Welzand M. Sperling. Atomic Absorption Spectrometry, 3rd edn., Wiley-VCH, Weinheim, 1999. [ Links ]
6 R.S. Koirtyohann, R.C. Giddings and H.E. Taylor, Spectrochim. Acta, 1984, 39B, 407-413. [ Links ]
7 P. Ngobeni and D.A. Katskov, J. Anal. At. Spectrom., 2002, 17, 1316-1322. [ Links ]
8 D.A. Katskov and N. Darangwa, J. Anal. At. Spectrom, 2010, 25, 1079-1090. [ Links ]
9 C.L. Chakrabarti, H.A. Hamed, C.C. Wan, P.C. Bertels, D.C. Gregoire and S. Lee, Anal. Chem, 1980, 52, 167-176. [ Links ]
10 D.A. Katskov, J. Anal. At. Spectrom, 2005, 20, 220-226. [ Links ]
11 Y.M. Sadagov, Spectrochim. Acta, 2000, 55B, 907-915. [ Links ]
12 B.V. L'vov and VG. Nikolajev, Zh. Prikl. Spektrosk, 1987, 46, 7-12. [ Links ]
13 B. Welz, H. Becker-Ross, S. Florek and U. Heitmann, High-resolution Continuum Source AAS: The Better Way to do Atomic Absorption Spectrometry, Wiley-VCH, Weinheim, 2005. [ Links ]
14 D.A. Katskov, N. Darangwa and U. Heitmann, J. Anal. At. Spectrom, 2010, 25, 1091-1101. [ Links ]
15 R.A. Felice, Proceedings of the Eighth Symposium on Temperature: Its Measurement and Control in Science and Industry, National Institute of Standards and Technology, Gaithersburg, MD, 2003, 717-722. [ Links ]
16 B. Welz, M. Sperling, G. Schilemmer, N. Wenzel and G. Marowsky, Spectrochim. Acta, 1988, 43B, 1187-1207. [ Links ]
17 G.V. Samsonov, ed., The Oxide Handbook, IFI/Plenum, New York, 1973. [ Links ]
18 R.H. Lamoreaux, D.L. Hildenbrand and L. Brewer, J. Phys. Chem. Ref. Data, 1997, 16, 419-443. [ Links ]
Received 4 December 2012
Revised 5 May 2013
Accepted 7 May 2013
* To whom correspondence should be addressed. E-mail: katskovda@tut.ac.za

