


Serviços Personalizados
Artigo
 Inglês (pdf)
 Artigo em XML
 Referências do artigo
Indicadores

Links relacionados
-
 Citado por Google
 -
 Similares em Google
Compartilhar

 Permalink
South African Journal of Chemistry
versão On-line ISSN 1996-840X
versão impressa ISSN 0379-4350
S.Afr.j.chem. (Online) vol.66 Durban Ago. 2013
RESEARCH ARTICLE
Measuring the impact of academic development courses in first- and second-year chemistry
Leonard C. Smith
Centre for Higher Education Development, University of Cape Town, South Africa. E-mail: leonard.smith@uct.ac.za
ABSTRACT
This paper uses multivariate analysis to estimate the impact of educational interventions in the first-year academic development chemistry courses on students' final course marks. The cohorts for seven years are pooled, which generates a more robust set of results than was previously the case. To counter the sample-selection problem that arises as academic development students are placed onto the academic development programme, a selection of control variables is included in the estimations. The results suggest that the educational interventions in the first year had a positive impact on academic development students' performance, relative to mainstream students, in both the first- and second-year courses. The implications of the results for education policy and research are considered.
Keywords: Academic development, academic performance, chemistry, educational interventions, multivariate analysis, South Africa.
1. Introduction
The poor academic performance of students at South African tertiary institutions is cause for concern and is reflected in low graduation rates across the sector.1,2 Of particular concern is the relatively poor academic performance of students who come from socially and educationally disadvantaged backgrounds.3 In response to this situation South African tertiary institutions have introduced a variety of academic development (AD) programmes and courses designed to enable such students to realize their full academic potential.4,5,6
The purpose of an AD course in chemistry is to enable students to develop their learning, writing, quantitative and study skills, so that they are able to achieve success in a particular course and in subsequent mainstream courses (courses that make up the standard three-year degree programme in the Science Faculty at the University of Cape Town (UCT)) in chemistry.7 In addition an AD course in chemistry is designed to facilitate the students' understanding of the subject.
Despite the use of educational interventions in chemistry courses it is, however, fair to say that relatively little quantitative research has been carried out in South Africa and elsewhere to test the efficacy of such interventions in improving the academic performance of students taking AD courses in chemistry,8 and also in economics and mathematics.9-11
This paper makes a number of advances to the existing empirical literature in the area of chemistry education. Firstly, an explicit attempt is made to compare the academic performance of AD and mainstream chemistry students, controlling for a number of independent variables. Secondly, the data for seven cohorts including some 1600 observations is pooled: this makes it possible to test the effect of the educational interventions over several years and to generate a more robust set of results.11 Thirdly, the academic performance of each student taking the second-year chemistry course is tracked until such time as they pass, withdraw from, or are excluded from the course.
This study is conducted in two parts. In the first part the academic performance of students taking the first-year AD courses in chemistry (CEM1009H and CEM1010F) is compared to the academic performance of mainstream students taking the whole-year first-year chemistry course, CEM1000W. In the second part, the effect of the educational interventions in the first-year chemistry courses on the academic performance of the AD students in the second-year chemistry course is assessed relative to the academic performance of mainstream students.
The structure of the paper is as follows. In Section 2, the AD and mainstream courses in first-year chemistry, and the first- and second-semester mainstream courses in second-year chemistry (CEM2007F and CEM2008S), are described as is the nature of the educational interventions. In Section 3 the method used in this paper is presented and estimation issues are discussed, and Section 4 considers the data and discusses the results. The implications of the findings are discussed in Section 5, and Section 6 concludes the paper.
2. Characteristics of the Academic Development and Mainstream Chemistry Courses
The first-year AD and mainstream courses in chemistry are described by Allie7 as follows:
Since a first-year course in chemistry is a requirement for many programmes (majors) in the Science Faculty, there is a need for an AD (CEM1009H) course which caters for students considered to be underprepared for tertiary studies. It also provides an opportunity to a limited number of students with no secondary chemistry background to register for a chemistry course. The mainstream (CEM1000W) course does not cater adequately for these students as the pace is too fast and there is limited support in the form of tutorials. CEM1009H covers about 55.0 % of the mainstream curriculum and is based on a spiral approach.12 Students are introduced to the most important basic concepts in chemistry. There is time to cover the basic concepts as well as to develop skills such as writing, data interpretation etc.
CEM1009H has five contact periods per week, three formal lectures and two small-group tutorials. In addition, there is a practical session each week. The course has been designed to integrate all facets into a coherent curriculum which is possible as the course convener does most of the teaching. Lectures are used to explain the content using carefully chosen examples to illustrate problem solving strategies where applicable. The approach is traditional, making use of an overhead projector and a blackboard rather than using electronic media to deliver the material. This allows a degree of spontaneity and flexibility which is not possible when using a Powerpoint presentation.
The tasks in the tutorials complement the lectures. The problem sets often contain examples which extend the coverage of the topics in the lectures. There are many questions which require discussion; this is more easily achieved in the small tutorial groups where the tutor is available to act as a facilitator. The tutorial sessions also allow students to interact more easily with models and other materials designed to enhance their understanding of the concepts. The lecturer acts as an additional tutor during the sessions and feedback from tutors is very valuable in that it alerts the lecturer to any issues which may need further clarification in the lectures.
Laboratory work has been designed to familiarize students with practical methods available to the chemist and to give them confidence in their ability to use these methods.13 The experiments give them opportunities to develop their manipulative skills as well as to handle modern instruments such as electronic balances and spectrophotometers. Students learn how to take careful measurements, to assess the precision of their findings and to describe the significance of their observations. Doing practical work also helps them to appreciate the experimental basis on which theoretical concepts are founded and thus enhance their understanding of chemical theory.
Tutors and demonstrators are an essential part of the teaching team as they facilitate learning in small groups. Well trained demonstrators and tutors will be more confident and effective in their roles. A one day workshop at the beginning of the year is the start of the training process, while weekly meetings with the demonstrators and tutors afford ongoing training. The tutors and demonstrators are given responsibility for running the activities of their group (14-16 students) which underlines their role as key members of the teaching team. Where possible, post graduate students, who themselves entered the chemistry department via CEM1009H, are recruited for this course since they are excellent role models for the students.
Some of the students who pass CEM1009H go on to take CEM1010F in the first semester of their second academic year. These two courses, together, cover the same material as the first-year mainstream course. As regards assessment, students taking the two AD courses are not required to answer multiple-choice questions in their final examination; they are required to respond in writing to structured questions. In contrast, the mainstream examination consists of structured and multiple-choice questions in the ratio of 2:1.
Successful AD and mainstream students, who wish to major in chemistry, go on to do the second-year courses, CEM2007F and CEM2008S. CEM2007F is a mathematics-based course, which includes physical chemistry and spectroscopy, and CEM2008S covers organic and inorganic chemistry.
3. Method and Specification Issues
3.1. Method
This section presents the method used to identify whether the educational interventions improved the academic performance of AD students in the first- and second-year chemistry courses, relative to mainstream students.
Observations are included for AD and mainstream students of the 1999-2005 cohorts, registered in the Faculty of Science at UCT, and who wrote the South African matriculation examination. Few changes were made to the content of the first-year chemistry course during the period, or to the content, structure and standard of the final examination paper, and the same people acted as course convener and chief lecturer for each of AD courses. AD students cover the same material as do the mainstream students in their first-year whole-year course. AD and mainstream students did not, however, write the same final examination. That said, although the methods of assessment differ, they are of a similar standard and are moderated by the same external examiner.
The first part of the study identifies the extent to which the AD courses in first-year chemistry were successful in improving the academic performance of AD students relative to mainstream students. The academic performance of the AD (CEM1010F) and mainstream (CEM1000W) students is compared using the final course mark as the dependent variable.
The second part of the study identifies the extent to which the educational interventions incorporated in the first-year AD courses improved the academic performance of AD students in the first-semester second-year mainstream chemistry course (CEM2007F) relative to their peers who took the first-year mainstream course (CEM1000W). The academic performance of the AD and mainstream cohorts is compared using the final course mark or the best course mark if the student did the course more than once, as the dependent variable.
The starting point for this study is Becker's seminal book Human Capital, and Hanushek and Welch's (2006) Handbook of the Economics of Education.14,15 These books and many subsequent studies use a production function approach and multivariate analysis (MVA) to estimate the relationship between an array of inputs (e.g. academic ability (preparedness), demographic variables, socioeconomic variables, etc.) and a set of outputs, here, the students final course mark.9-11,16,17,19-25
The first empirical challenge is that the mainstream students can only act as a comparable group if they are drawn from the same population as the AD students across a broad range of characteristics. If not, the difference in the graduation performance of the AD students, relative to the mainstream students, might be due to their differing set of characteristics on entry to the university rather than the effectiveness of the AD programme.
MVA controls for a number of variables (other than participation in an AD course) that are expected to influence students' academic performance. In essence, the purpose of MVA is to identify the effect of the AD course on students' academic performance, taking into account (or conditional on) the fact that AD and mainstream students have different characteristics, which are reckoned to determine their course marks. The statistical programme STATA is used to conduct the MVA estimations.
The first objective of this paper is to assess the effectiveness of the educational interventions on the academic performance of the AD students in the first-year chemistry course. This relationship is identified through the use of a dummy variable AD, equal to 1, for AD students. A positive sign for the coefficient of AD suggests that the educational interventions have a positive effect on AD students' academic performance relative to that achieved by mainstream students, conditional on the control variables, and vice versa.
To obtain the conditional impact of the AD course on learning outcomes a number of other variables that may explain students' academic performance in first-year chemistry are included: variables for performance in school-leaving subjects, course and student characteristics.
Proxies for academic preparedness are important in explaining students' academic performance at South African universi-ties,9,16,18,21,22,26-8 and their academic performance in chemistry courses in the United States.21-23,27-29 Following Edwards16 proxies for academic preparedness are included as independent variables. These independent variables include the adjusted matriculation points score (ADJMATPT), and dummy variables, equal to 1, for English first language higher grade (HG) (ENG FL HG), physical science (HG) A+B+C (PS HG ABC), D(PS HG D), E+F (PS HG EF), and mathematics (HG) A+B+C (MATHHG ABC), D (MATH HG D), E+F (MATH HG EF) taken in the school-leaving examination. To determine the adjusted matriculation points score, the points allocated to English first language (HG), English second language (HG), mathematics (HG) and mathematics standard grade (SG) are deducted from the matriculation points score. Therefore, the adjusted matriculation points score includes the matriculation points that the students earned for the four subjects taken in the matriculation examination, net of mathematics and English. Two points are also deducted from the student's matriculation points score if he/she took physical science (HG); the student retains his/her remaining matriculation points earned for this subject as it is one of the four subjects used to calculate the adjusted matriculation points score.
There are strong grounds for expecting English (home language) to have a positive impact on learning outcomes at universities where English is the medium of instruction32,33, but for South African studies of economics at least the results are mixed.9,16,17,19 A dummy variable ENGHOME, equal to 1, is included if the student's home language is English.
Several South African studies report that males perform relatively well in multiple-choice questions and females in essay questions.8,11,16,17 However, gender is reported as being statistically insignificant in explaining academic performance in a first-year introductory chemistry course in the United States.34 A dummy variable MALE, equal to 1, is included if the student is male.
Other variables include whether the student received financial aid (FINAID), the student's age at last birthday on entry to university (AGE), whether he/she matriculated in the Western Cape Province (WC), whether he/she attended the following types of school: those that fell under the former DET (DET), and those that fell under the former Houses of Representatives and Delegates (HRD), and whether he/she declared himself/herself as 'white' on the university's application for admission form (WHITE).
The dummy variable FINAID, equal to 1, is included as a proxy for socioeconomic disadvantage. Students in receipt of financial aid are more likely to come from poorer households and communities, on average. It has been suggested that there is a positive relationship between students' age and learning outcomes in economics and chemistry: older students are more likely to have achieved the level of intellectual development necessary for mastering abstract processes.29,35 The evidence is, however, inconclusive as regards economics education at least.9,11,16,19
Van Walbeek17 reports that students from the Western Cape Province outperformed students from the rest of South Africa in their first-year microeconomics course at the University of Cape Town. This finding was also reported for a first-year economics course at the University of Stellenbosch.22 It is possible that students from the Western Cape Province experience less dislocation in their transition to university when they have family and friends living relatively close to the university. It is also possible, however, that the schools in the Western Cape Province offer education of a higher quality than schools elsewhere in South Africa, conditional on the independent variables. Indeed, for the period 1998 to 2004 the mean pass rate achieved by learn- ers writing the matriculation examination in the Western Cape Province was 84 % compared to a national mean pass rate of 62%.11 A dummy variable, equal to 1, is included for the Western Cape (WC).
Dummy variables, equal to 1, are also included for each of the following types of school: schools that formerly fell under the Department of Education and Training (DET); and schools that formerly fell under the Houses of Representatives and Delegates (HRD) (the base category includes private and model C schools). There is little evidence to suggest that students from former DET and HRD schools underperform their peers in economics courses, conditional on the other explanatory variables.10,16
Many advantages accrued to members of South Africa's white population under the apartheid system.36 These advantages make it likely that white children in South Africa have access to material resources that are unavailable to other children. They are more likely than other children to have parents who themselves have a tertiary qualification. Also, they are more likely than other children to come from family backgrounds where it is expected that they will go to university. Two studies report that white South African students exhibit a higher level of academic performance in first-year economics than do their peers.20,21 That said, contrary findings for this variable have also been reported as regards economics education.17,22 As regards chemistry education two studies report that African-American students achieved lower grades than their peers for college chemistry courses.34,37 A dummy variable WHITE, is included for those students who declared themselves as 'white' on university's application for admission form.
Dummy variables are also included for each of the six years 2000-2005 (2000, 2001, 2001, 2003, 2004, 2005) (the base category is 1999) to control for variations in course performance due to exogenous variables, for example, variations in the methods of assessment for the different years.
The second objective of this paper is to assess the effectiveness of the educational interventions included in the first-year AD chemistry courses on the academic performance of the AD students in the second-year first-semester chemistry course (CEM2007F). This relationship is identified through the use of a dummy variable AD, equal to 1, for AD students. To obtain the conditional impact of the first-year AD chemistry courses on learning outcomes the same variables as are used for the first-year estimations are included. There is, however, one additional variable. Some students take the course more than once before they finally pass, fail or are excluded. A continuous variable ATTEND indicates the number of times each student attended the course.
3.2. Specification Issues and Limitations
There are a number of specification issues that remain unre-solved.9 Unfortunately, it is difficult to find precise proxies for some of the variables that are believed to influence students' academic performance.11 In particular, variables measuring the students' level of academic and cultural capital, epistemological factors, students' learning, language, reading, writing and study skills, and non-cognitive states such as self-efficacy, alienation, stereotype threat, stress and anxiety, effort, attitude and motivation are omitted.
The omission of these variables may result in biased estimates of the coefficients of the variables that are included in the regression equation (omitted variable bias). In particular, if these omitted variables are correlated with the AD courses then their positive or negative effect on course performance may be erroneously attributed to the AD dummy variables.
There are two sample-selection issues that also remain unre-solved.9 Firstly, not all students who start the course go on to write the final examination and complete the course. The main reason is that they do not meet the requirements to do so. For example, students are generally required to write all the tests, hand in a certain number of tutorial assignments and attend a certain number of the tutorials. The exclusion of these students in the estimations may lead to sample-selection bias.38,39 This sample-selection problem applies to the AD and mainstream cohorts.
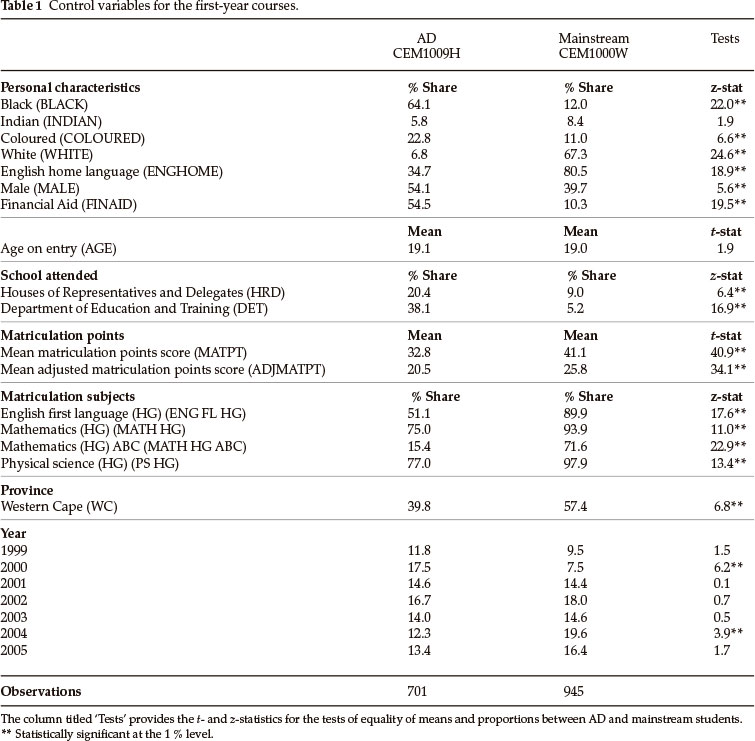
Secondly, the mainstream students can only act as a comparison group if they are drawn from the same population as the AD students. It may not be possible, however, to assume that students taking the AD and mainstream courses are drawn from the same population measured across a broad range of characteristics, which may result in omitted variable bias. To test for the extent of the similarity between the two groups, differences of means and proportions tests were conducted for each of the continuous and discrete variables, for each of the first- and second-year courses. The results of this analysis are presented in Tables 1 and 2.
It is clear from the data presented in Table 1 that the two groups differ markedly from one another. For example, a greater proportion of mainstream students have English as their home language, took English first language (HG), mathematics (HG) and physical science (HG). Mainstream students also achieved higher matriculation and adjusted matriculation points scores. A greater proportion of AD students, however, attended schools that formerly fell under the Houses of Representatives and Delegates, and received financial aid. All these differences are statistically significant (P < 0.01). Indeed, with the exception of the variables INDIAN and AGE, the null hypothesis of equal means and proportions can be rejected. These differences are unsurprising given the different criteria used for placing students into the mainstream and AD courses.
Turning to Table 2 it can be seen that the difference between the AD and mainstream cohorts remains significant for the second-year course. Indeed, with the exception of the variables INDIAN, COLOURED, MALE, and AGE, the null hypothesis of equal means and proportions can be rejected.
4. Results and Discussion
4.1. Analysis of the First-Year Data
In this section the academic performance of the AD and mainstream students is compared. The results for first-year AD (CEM1009H) and mainstream (CEM1000W) chemistry courses are presented in Table 3.
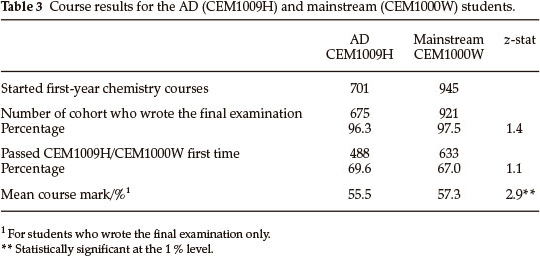
Of the AD cohorts, 96.3 % qualified to write the final examination. The corresponding figure for the mainstream cohorts is 97.5 %, and the difference is statistically insignificant (P > 0.10). This suggests that the bias that may arise from excluding the students who did not write the final examination is small.
The mainstream cohorts achieved a higher course mark than did the AD cohorts, on average (57.3 % versus 55.5 %), and the difference is statistically significant (P < 0.01). The AD cohorts achieved a higher pass rate (69.6 % versus 67.0 %), however, and the difference is statistically insignificant (P > 0.10). That said, it must be borne in mind that CEM1009H does not cover the content of the full first-year chemistry course and that the AD and mainstream students were not subject to identical means of assessment.
The results for the students completing the first-year AD and the mainstream chemistry courses are compared in Table 4. As was previously noted, AD and mainstream students did not write the same tests and examinations, although the tests and examinations were set to the same standard, and the examination was moderated by the same external examiner.
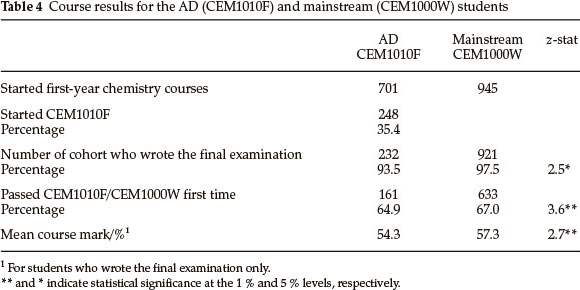
Only 35.4 % of the AD students who took CEM1009H went on to CEM1010F in the first semester of the following year. CEM1009H is a compulsory course for AD students and many of them decide not to continue with the subject even though they have passed the course. Also, some AD students do not take CEM1010F as they have been excluded, transferred to another faculty, or left the university. The relatively low proportion of continuing students suggests that their academic performance is probably driven by selection. Unfortunately, it is not possible to account for this selection bias.
Of the AD students, 93.5 % qualified to write the CEM1010F examination. The corresponding figure for mainstream students is 97.5 %, and the difference is statistically significant (P < 0.05). It follows that the bias that may arise from excluding the students who did not write the final examination is unlikely to be large. The pass rate achieved by the mainstream students exceeds that achieved by the AD students (67.0 % versus 64.9 %) and the difference is statistically significant (P < 0.01). The mean course mark achieved by the mainstream students exceeds that achieved by the AD students by 3.0 percentage points, and the difference is also statistically significant (P < 0.01).
The findings presented in Tables 3 and 4 are unsurprising given that AD students have a lower level of academic preparedness as measured by their average performance in the school-leaving examination.
4.1.1. First-year Estimation Results
In the following estimations the academic performance of the AD (CEM1010F) and mainstream students is compared as both groups have covered the first-year chemistry course by the time that they wrote their respective examinations.
Given that the AD and mainstream students were not subject to the same assessment regime, and given the role played by selection into CEM1010F, these estimations can act only as a guide as to the relative academic performance of the two groups of students, and to the effectiveness of the educational interventions included in the AD courses.
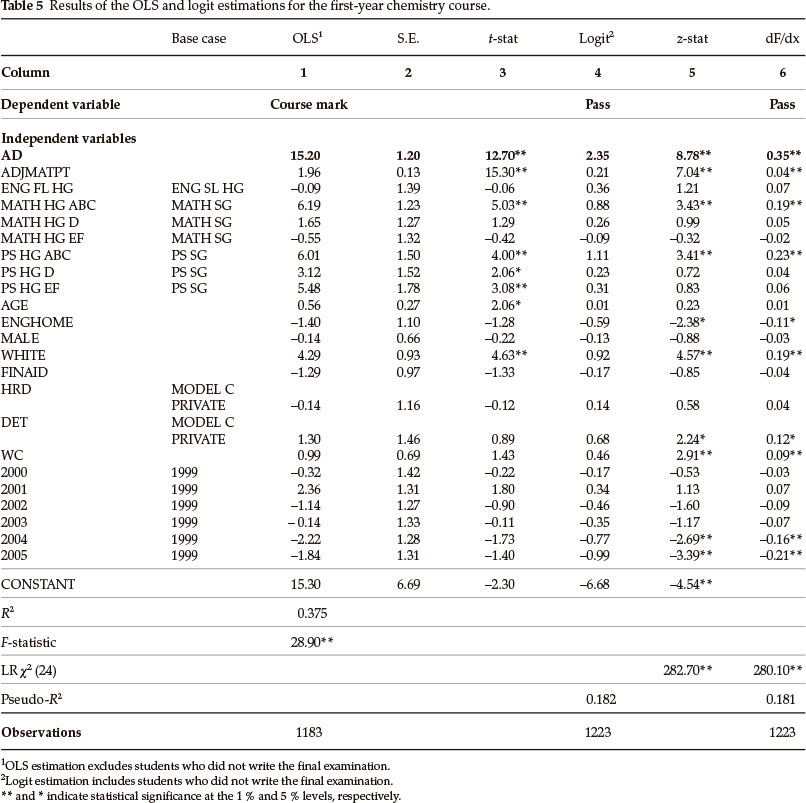
Table 5 shows the results of the ordinary least squares (OLS) and logit estimations. The OLS estimation has the final course mark as the dependent variable and excludes those students who did not write the final examination. The logit estimation, which is used to account for those students who did not write the final examination, has a dichotomous dependent variable; 1 if the student passed the first-year course and 0 if the student failed the first-year course.
Turning to the OLS estimation (column 1), the key finding is that the AD students outperform the mainstream students by 15.2 percentage points, on average, conditional on the explanatory variables (P < 0.01) (quantile estimations were run for the 20th, 40th, 50th, 60th and 80th percentiles. In all cases, the coefficient of the AD variable is positive, and with the exception of the 80th percentile estimation, statistically not significant (P >0.05) with reference to 15.2.).
The coefficients of the variables ADJMATPT, MATH HG ABC, PS HG ABC, PS HG D, PS HG EF, AGE and WHITE are all positive and statistically significant (P < 0.05).
The coefficient of the adjusted matriculation points score, ADJMATPT, is positive and statistically significant (P < 0.01). For example, a one unit increase in the adjusted matriculation points score increases the course mark by 1.96 percentage points, on average, conditional on the selected explanatory variables. Academic ability (preparedness) as measured by the student's performance in the school-leaving examination is reported to be an important determinant of success in first-year micro-economics9,16,17,22 and mathematics11 for students at South African universities, and for chemistry students in the United States.23-25
A background in mathematics (HG) also improves students' academic performance. For example, the average mark of students who achieved an A, B or C in mathematics (HG) (MATH HG ABC) is 6.19 percentage points higher than that achieved by students who took mathematics (SG) (P < 0.01). These findings are in line with those reported for South African students taking first-year microeconomics,10,17,20 and chemistry in the United States.29-31
These results indicate that mathematics (HG) grades ABC contribute positively towards academic achievement in first-year chemistry relative to mathematics (SG). That said, 15.4 % of the AD students compared to 71.6 % of the mainstream students did not achieve more than a D grade for mathematics (HG). AD students may well benefit from additional support when studying those sections of the chemistry syllabus that require a good understanding of mathematics at the higher level. Implementing such changes may yield positive returns in terms of improved academic performance.
The coefficients for physical science (HG) are positive and statistically significant (P < 0.05). This positive finding is not surprising given that physical science (HG) includes physics and chemistry, in equal measure. Similar findings have also been reported for students taking first year economics courses,9,16,17,22 and first-year chemistry courses in the United States.40
White students enjoy a premium of 4.29 percentage points, conditional on the control variables. As was previously noted, this finding may be a function of the many advantages accruing to white people under the system of apartheid.
The type of school attended and whether the student is on financial aid do not seem to be an important factor in determining subsequent academic performance; the relatively poor quality of the DET and HRD schools, and the poor socioeconomic backgrounds they represent, may well be reflected in the relatively poor academic performance of students who attended these two types of school in the matriculation examination.
None of the dummy variables for each of the years is statistically significant (P < 0.10), which implies that there is little variation in students' results from year to year, relative to the base year (1999). This finding suggests that the quality of the assessment did not vary much over the seven-year period. Finally, the R2 is 0.375, which implies that at least 37.5 % of the variation in the course mark is explained by the independent variables included in the estimation.
As regards the logit estimation (column 4), the coefficient of AD is positive and statistically significant (P < 0.01). This result suggests that omitting the students who did not write the final examination from the OLS estimation does not result in a biased coefficient for the AD variable. The coefficients for the variables ADJMATPT, MATH HG ABC, PSHG ABC, WHITE, DET and WC are all positive and statistically significant (P < 0.05).
The marginal effects for each of the independent variables are shown in column 6 of Table 5 (in interpreting the dF/dx of the logits, it is for the hypothetical student with average values for all the covariates, and not for all students. This is due to the non-linear nature of the logit function.). For example, the probability of a student's passing first-year chemistry increases by 35.0 percentage points for AD relative to mainstream students. For each one-point increase in the adjusted matriculation points score, the probability of a student's passing increases by 4.0 percentage points, on average. Also, the probability of passing for students who achieved an A, B or C grade for mathematics (HG) is increased by 19.0 percentage points, on average. All three coefficients are statistically significant (P < 0.01).
In sum, these findings suggest that the educational interventions designed to improve the academic performance of the AD students in first-year chemistry were successful, relative to the academic performance of the mainstream students. These findings must, however, be interpreted with considerable caution given the selection problem referred to above and the fact that the AD and mainstream students were subject to similar, though not identical, means of assessment. That said, these findings are supported by the results of similar studies designed to estimate the effect of AD courses in first-year microeconomics and mathe-matics.11
This study also highlights the fact that academic preparedness, as measured by the adjusted matriculation points score and the grades achieved for mathematics (HG) and physical science (HG), plays an important role in determining whether students succeed in the first-year chemistry course. The other key variable in explaining students' academic performance is whether a student declared himself/herself as 'white' when applying to study at the university. These results mirror those reported for South African students taking psychology, engineering, commerce, and economics courses.9,16,26-28,41
4.2. Analysis of the Second-Year Data
The course mark and throughput rates for the AD and mainstream cohorts who took CEM2007F are presented in Table 6. The student's best course mark is used to calculate the pass rate; the students' subsequent performance in the supplementary examination is not taken into account as this information is not available for all the cohorts that are the subject of this analysis.
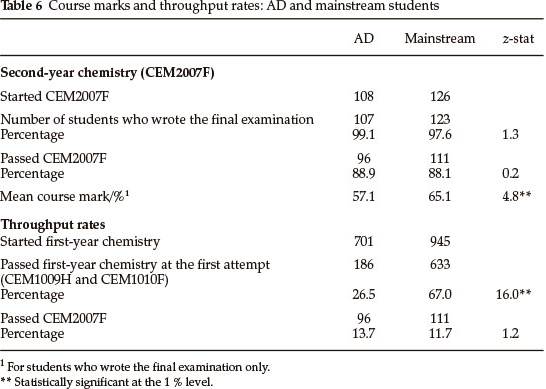
Turning to Table 6 a greater percentage of the AD students wrote the final examination (99.1 % versus 97.6 %) and passed the course (88.9 % versus 88.1 %). The differences are, however, statistically insignificant (P > 0.10). These findings suggest that the bias that results from omitting the students who did not write the examination may not be large. Mainstream students achieved a higher mean course mark, however, and the difference is statistically significant (P < 0.01).
Considering the throughput rates, a greater proportion of the AD students who took chemistry in their first year went on to pass CEM2007S, relative to mainstream students (13.7 % versus 11.7 %), even though a much smaller proportion of AD students passed the two first-year AD courses (26.5 %) compared to the proportion of students who passed the first-year mainstream course (67.0 %).
4.2.1. Second-Year Estimation Results
An additional variable is included in the second-year estimations: the number of times the student took the second-year chemistry course (ATTEND).
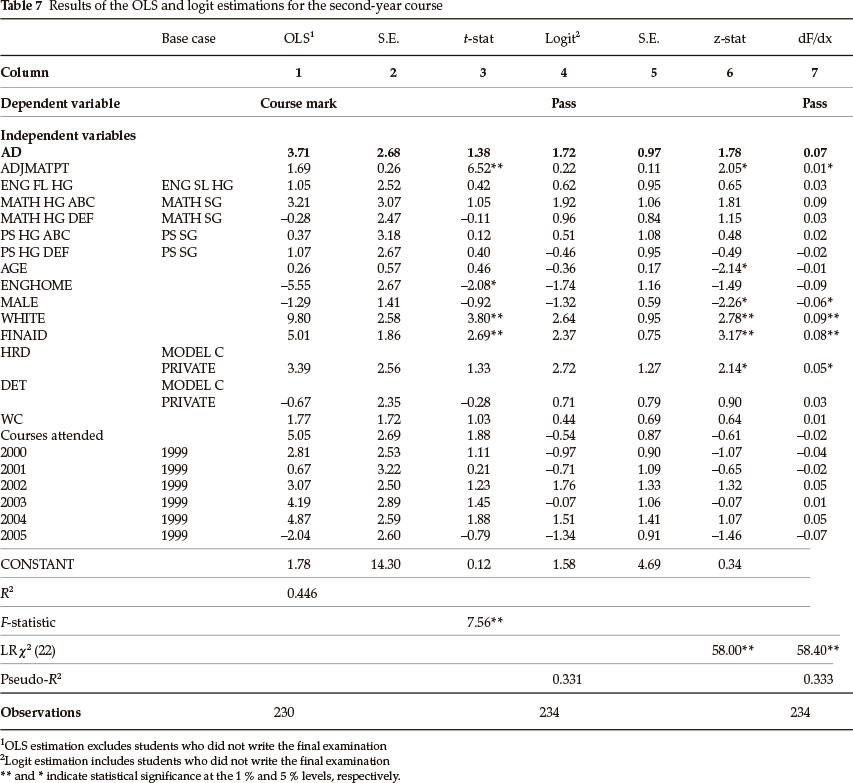
Table 7 shows the results of the OLS and logit estimations for second-year first-semester chemistry course (CEM2007F). The OLS estimation has a continuous (course mark) dependent variable and the logit estimation has a binary (pass/fail) dependent variable. The latter estimation makes it possible to account for all the students who took the course, including those who did not write the final examination.
As regards the OLS estimation (column 1) the coefficient of the variable AD is 3.71, but is statistically insignificant (P > 0.10). In general, the standard errors are relatively large for small-sample estimations (column 5) and thus it is unlikely that the coefficient for any given variable is statistically significant (P < 0.05) (small-sample problem).42 That said, the coefficients of the variables ADJMATPT, WHITE and FINAID are positive and statistically significant (P < 0.01).
The coefficient for the variable ENGHOME is, however, negative and statistically significant (P < 0.05) as it was in the first-year logit estimation.
Turning to the logit estimation (column 4), the coefficient of AD is positive and statistically insignificant (P > 0.05). The coefficients of ADJMATPT and WHITE are positive and statistically significant (P < 0.01) for both the standard OLS and logit estimations, as they are for students taking the first-year chemistry course as shown in Table 5. Also, the coefficient for the variable HRD is positive and the coefficients of the variables AGE and MALE are negative, and all three coefficients are statistically significant (P < 0.05).
The marginal effects for each of the independent variables are shown in column 7. For example, for each one-point increase in the adjusted matriculation points score, the probability of a student's passing CEM2007F increases by 1.0 percentage point, on average. The probability of passing for students who received financial aid is increased by 8.0 percentage points, on average. Both coefficients are statistically significant at, at least, the 5 % level.
In summary these results imply, bearing in mind the small sample size, that the first-year AD courses had a positive, though muted, impact on the academic performance of the AD students in the second-year chemistry course, conditional on the selected independent variables.
Further, students' academic preparedness as measured by their adjusted matriculation points score has a positive effect on their academic performance. White students also achieved higher course marks and pass rates, conditional on the selected control variables. However, students who declared English to be their home language achieved a lower course mark, conditional on the control variables. This phenomenon warrants further research.
4.3. Effect of the AD Courses on the Pass Rate
To calculate the effect of the educational interventions included in the AD courses in first-year chemistry on the course pass rate, relative to the mainstream pass rate, it is necessary to identify the course premium. The course premium for the AD students who took CEM1010F is 15.2 percentage points (Table 5). The effect of this premium on the pass rate achieved by the AD students is shown in Table 8.
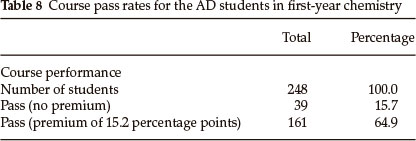
The mean pass rate for the seven-year period is 64.9 %. If it is assumed that these same students had attended the mainstream course they would not, however, have enjoyed the premium of 15.2 percentage points and the pass rate for the 248 students who started the course would have fallen to 15.7 %. In other words, 122 students may be said to have passed the course they otherwise would not have passed. This represents 49.2 % of the cohorts.
The effect of the premium on the pass rate achieved by the AD students suggests that the AD courses in first-year chemistry contributed positively towards AD students' academic performance, bearing in mind the different methods of assessment and the selection problem discussed above.
The effect of the premium going to AD students on the pass rate in CEM2007F is not shown as it was statistically insignificant, conditional on the control variables. Suffice to say that the result imply that the AD first-year courses had a positive, though relatively weak, impact on students' academic performance relative to the performance of mainstream students for the seven-year period.
5. Implications for Education Policy and Research in South Africa
A variety of academic support initiatives are offered to students from academically disadvantaged backgrounds at tertiary institutions in South Africa. The findings of this study suggest that appropriate educational interventions in AD students' first year has a positive impact on their academic performance relative to their peers on the mainstream. The educational interventions described here were designed to improve students' understanding of chemistry through the use of lectures, tutorials and laboratory sessions. Time was given to cover the basic concepts as well as to develop writing and data interpretation skills. Students were introduced to problem-solving strategies where applicable, and they were encouraged to interact with models and other materials, which were designed to enhance their understanding of the key concepts. The skill sets acquired by the students may enable them to achieve greater success in subsequent higher-level courses.
That said, this study does not clarify the importance of each of the interventions in improving students' academic performance. It only suggests that the interventions, in some combination, had the effect of improving AD students' pass rates, relative to mainstream students. Further investigations are required to tease out the effects of the various interventions on students' academic performance through to graduation.
The findings of this study have implications for higher education policy in South Africa. Graduation rates across the tertiary sector are a grave cause for concern.1 The lowest gross participation rates and graduation rates are those exhibited by black people, who make up the major portion of South Africa's population. It is not unreasonable to assume that many mainstream students would benefit from a similar array of educational interventions, given that many of them have barely qualified for mainstream courses.10
Research is required to establish the types of educational interventions that are effective in improving students' academic performance in other courses, and the key determinants of academic performance across the curriculum. Further, it is important to establish whether AD courses are effective in improving students' academic performance in other courses, and at other tertiary institutions in South Africa.
Research of the type described in this article is a first step in identifying the key characteristics of a successful AD course. Such research can contribute to a better understanding of the principles that underlie successful AD courses and programmes, which will ultimately enable secondary and tertiary educationists to improve the academic performance ofstudents throughout South Africa.
6. Conclusion
This study investigates the effectiveness of first-year AD courses on students' academic performance in first- and second-year chemistry courses relative to mainstream students. To the extent that the AD students outperformed mainstream students, conditional on the selected control variables, it is possible to draw the following conclusions.
The educational interventions incorporated in the AD courses had a positive impact on AD students' academic performance for the seven-year period. That said, the findings are qualified, given that AD and mainstream students were subject to different, though similar, forms of assessment and that there is the unaccounted for selection problem that arises as the majority of the AD students do not go on to complete the second of the two first-year AD courses in chemistry.
The findings reported in this paper suggest a rich line of further research. Firstly, it is necessary to determine whether AD interventions are successful in improving students' academic performance in other chemistry courses and at other tertiary institutions. Secondly, it is important to identify the key characteristics of a successful AD chemistry course. Thirdly, it is important to identify the key determinants of academic performance for AD and mainstream students across a variety of chemistry courses offered by tertiary institutions in South Africa, so as to improve the delivery of chemistry courses to AD and mainstream students.
Given the relatively poor graduation rates achieved by students from educationally disadvantaged backgrounds, it is important that every effort is made to develop AD and mainstream courses designed to improve the academic performance of educationally disadvantaged students, and so enable a greater proportion of these students to achieve a degree.
Acknowledgements
I thank Fiona Gibbons for her patience in meeting my numerous requests for data. Any errors are, of course, my responsibility.
References
1 I. Scott, N. Yeld, and J. Hendry, HE Monitor, 2007, 6. [ Links ]
2 N. Yeld, Assessment, Equity And Language Of Learning: Key Issues For Higher Education Selection in South Africa, Ph.D. thesis, University of Cape Town, Cape Town, South Africa, 2001. [ Links ]
3 M. Cross and C. Carpentier, Perspectives Educ., 2009, 27(1), 6-18. [ Links ]
4 I. Scott, Academic Development in South Africa, in Higher Education in South Africa: A Scholarly Look Behind the Scenes, (E. Blitzer, ed.), Stellenbosch University Press, Stellenbosch, South Africa, 2009, pp. 21-49. [ Links ]
5 B. Kloot, J.M. Case and D. Marshall, S. Afr. J. Higher Educ., 2008, 22(4), 799-816. [ Links ]
6 D. Pinto, Directory of Science, Engineering and Technology Foundation Programmes and Proceedings of the Indaba of Science, Engineering and Technology Foundation Programmes, Central Printing Unit, University of the Witwatersrand, Johannesburg, South Africa, 2001. [ Links ]
7 S. Allie, The University of Cape Town Science ADP Review, University of Cape Town, Cape Town, South Africa, 2009. [ Links ]
8 M. Rollnick, Identifying Potential for Equitable Access to Tertiary Level Science, Springer, London, U.K., 2010. [ Links ]
9 L.C. Smith and L. Edwards, S. Afr. J. Econ, 2007, 75(1), 99-117. [ Links ]
10 L.C. Smith, S. Afr. J. Econ, 2009, 77(1), 162-178. [ Links ]
11 L.C. Smith, The Effect of Selected Academic Development Programmes on the Academic Performance of Academic Development Students at a South African University: An Empirical Analysis, Ph.D. thesis, University of Cape Town, Cape Town, South Africa, 2012. [ Links ]
12 N.P. Grove, J.W. Herschberger and S.L. Bretz, Chem. Educ. Res. Prac, 2008, 9, 157-162. [ Links ]
13 B. Davidowitz, M. Rollnick and C. Fakudze, S. Afr. J. Chem, 2003, 56, 47-53. [ Links ]
14 G.S. Becker, Human Capital: A Theoretical and Empirical Analysis, with Special Reference to Education, University of Chicago, Chicago, U.S.A., 1964. [ Links ]
15 E.A. Hanushek and F. Welch, Handbook of the Economics of Education, North-Holland Press, Amsterdam, 2006. [ Links ]
16 L. Edwards, S. Afr. J. Econ., 2000, 68(3), 455-483. [ Links ]
17 C. van Walbeek, S. Afr. J. Econ., 2004, 72(3), 11-32. [ Links ]
18 W. Fraser and R. Killen, Perspectives Educ, 2005, 23(1), 25-40. [ Links ]
19 K.M. Parker, S. Afr. J. Econ., 2006, 74(1), 137-149. [ Links ]
20 A. van der Merwe, S. Afr. J. Econ, 2006, 74(1), 150-159. [ Links ]
21 P.M. Horn and A.I. Jansen, S. Afr. J. Econ., 2009, 77(1), 179-189. [ Links ]
22 Z. Dlomo, A. Jansen, M. Moses and D. Yu, S. Afr. J. Higher Educ, 2011, 25(4), 696-709. [ Links ]
23 E.P. Wagner, H. Sasser and W.J. DiBiase, J. Chem. Educ., 2002, 79(6), 749-755. [ Links ]
24 R.H. Tai, P.M. Sadler and J.F. Loehr, J. Chem. Educ., 2007, 84(6), 1040-1046. [ Links ]
25 D.C. Easter, J. Chem. Educ., 2010, 87(5), 535-540. [ Links ]
26 F.D. Bokhorst, D. Foster, and S. Lea, S. Afr. J. Higher Educ, 1990, 4(1), 39-45. [ Links ]
27 P.J.D. Curtis andJ. deVilliers, Develop. Southern Afr, 1992, 9, 457-470. [ Links ]
28 J. de Villiers and H. Rwigema, S. Afr. J. Higher Educ, 1998, 12(1), 103-108. [ Links ]
29 D.M. Bunce and K.D. Hutchinson, J. Chem. Educ., 1993, 70(3), 183-187. [ Links ]
30 D.G. Leopold and B. Edgar, J. Chem. Educ., 2008, 85(5), 724-735. [ Links ]
31 A.B. Bentley and G.I. Gellene, J. Chem. Educ., 2005, 82(1), 125-130. [ Links ]
32 V. Webb, World Englishes, 2002, 21(1), 49-61. [ Links ]
33 B. Davidowitz, Af. J. Res. Math. Sci. Tech. Educ., 2004, 8(2), 127-139. [ Links ]
34 R.H. Tai, P.M. Sadler and J.F. Loehr, J. Res. Sci. Teach., 2005, 42(9), 987-1012. [ Links ]
35 C. McConnell, J. Econ. Educ., 1980, 12(1), 15-22. [ Links ]
36 S. Terreblanche, A History of Inequality in South Africa 1652-2002, University of Natal Press, Scottsville, South Africa, 2002. [ Links ]
37 P.M. Sadler and R.H. Tai, J. Chem. Educ., 2007, 84(6), 1040-1046. [ Links ]
38 S. Douglas and J. Sulock, J. Econ. Educ., 1995, 26(2), 101-112. [ Links ]
39 K. Parker, S. Afr. J. Econ., 2007, 75(1), 118-124. [ Links ]
40 J.C.F. De Winter and D. Dodou, Int. J. of Eng. Educ. 27(6), 1343-1351. [ Links ]
41 J. Jawitz, The Performance of ASPECT Students in First-year Mathematics and Applied Mathematics Courses at the University of Cape Town,Pro-ceedings of the Second HSRC Seminar on Academic Support and Bridging Courses in Mathematics, Science and Engineering, 37-48, Pretoria, South Africa, 1992. [ Links ]
42 B. Goldacre, Bad Science, Fourth Estate, London, U.K., 2009. [ Links ]
Received 30 May 2013
Revised 25 June 2013
Accepted 28 June 2013

