


![Polyaniline/SiO2 catalyzed one-pot synthesis of tetrahydrobenzo[b]pyran derivatives](/img/en/next.gif)


Services on Demand
Article
 English (pdf)
 Article in xml format
 Article references
Indicators

Related links
-
 Cited by Google
 -
 Similars in Google
Share

 Permalink
South African Journal of Chemistry
On-line version ISSN 1996-840X
Print version ISSN 0379-4350
S.Afr.j.chem. (Online) vol.66 Durban Aug. 2013
RESEARCH ARTICLE
Extraction of pesticides from plants using solid phase microextraction and QuEChERS
Veronica C. ObusengI, *; Beauty M. MookantsaI; Harriet OkatchI; Ketlhatlogile MosepeleII ; NelsonTortoIII
IDepartment of Chemistry. University of Botswana, Private Bag UB 00704, Gaborone, Botswana
IIUniversity of Botswana,Okavango Research Institute, Private Bag 285, Maun, Botswana
IIIDepartment of Chemistry, Rhodes University, P.O. Box 94, Grahamstown, 6140 South Africa
ABSTRACT
A study employing dispersive solid phase extraction in the form of the quick, easy, cheap, effective, rugged and safe (QuEChERS) method and solid phase microextraction (SPME) for the cleanup of pesticides in plant samples from the Okavango Delta (Botswana) is presented. Concentration levels of aldrin, 1,1-dichloro-2,4-bis[chlorophenyl]ethane (DDD), 1,1-dichloro-2,2-bis[p-chlorophenyl]ethylene(DDE), 1,1,1-trichloro-2,2-bis[p-chlorophenyl]ethane (DDT), dieldrin, endosulfan and endrin were investigated using gas chromatography with electron capture detection (GC-ECD) and confirmed with gas chromatography with high resolution time of flight mass spectrometry (GC-TOFMS). Parameters affecting the extraction efficiencies of both techniques were optimized. In the absence of CRMs for the plants under investigation, method validation and evaluation of the extraction efficiencies were achieved through spiking of Nymphaea nouchali (Tswii) leaves at two concentration levels with trichlorobenzene as an internal standard. Recoveries for both SPME and QuEChERS were in the range 61-95 %. The calibration plots were reproducible and linear (R2 > 0.995) with limits of detection ranging from 0.102 to 1.693 µg L-1 for all the pesticides. The optimal conditions for QuEChERS and SPME were applied to the extraction of pesticides residues from the edible parts (leaves, roots and/ or stems) of Asparagus africanus, Cleome hirta and Nymphaea nouchali plants. No pesticides were detected in the leaves and stems of all the plants studied. Aldrin and endosulfan were detected in the Nymphaea nouchali roots at concentrations of 3-21 µg kg-1 and 5-3 µg kg-1, respectively. Pentachlorobenzene (PCB) and hexachlorobenzene (HCB) were also detected but were not quantified.
Keywords: Gas chromatography, mass spectrometry, pesticide, plant sample, green techniques.
1. Introduction
Persistent organic pollutants (POPs) have been observed to persist in the environment1 and have been shown to travel vast distances from their original source due to their semi-volatility. Their modes of transport include attachment to particulate matter, and through the food chain.2 Some of these POPs have been used as pesticides3,4 whilst others are used in industrial processes as well as in the production of a range of goods such as solvents, and pharmaceuticals.1,2 POPs are of particular concern as they are toxic and can bioaccumulate in human and animal tissue5,6 and can negatively affect plants, animal species, humans and natural ecosystems.7,8
In Botswana, the application of POPs for the eradication and control of Tsetse fly and mosquito has varied since 1964.9 Studies show that these pesticides are still present in the environment due to their persistence.10,11 POPs residues in fruits, vegetables, and other foodstuffs need to be determined to ensure that they do not exceed maximum recommended levels (MRLs). In particular, there have not been any studies that have profiled plants in the Okavango Delta as possible indicators of contaminant levels. Plant and environmental samples present complex matrices that may render trace analysis of pesticide residues almost impossible. Thus good extraction and highly sensitive detection techniques are required to isolate and quantify pesticides in these matrices.
The most common techniques used for sample cleanup in the determination of pesticides residues from solid samples are homogenization with solvents, sonication extraction and Soxhlet extraction.11 Frequently, these traditional sample preparation methods for pesticide residue analysis are complicated, tedious and may require large quantities of solvents some of which are carcinogenic and present waste disposal challenges.12 Simple procedures are being developed for the multiclass, multiresidue analysis of pesticides in various matrices, including fruits and vegetables. These techniques include solid phase extraction (SPE),13 solid phase microextraction (SPME)14 and the so-called quick, easy, cheap, effective, rugged and safe (QuEChERS) dispersive solid phase extraction method.15
SPME is a solvent-free extraction technique that enables simultaneous extraction and pre-concentration of analytes from gaseous, liquid and solid samples.16 SPME-gas chromatography is increasingly being used for analysis of volatile, semi volatile and non polar compounds in various matrices, particularly in the area of food quality and environment.17-20 It is an attractive technique for the pretreatment of complex sample matrices prior to chromatographic processes because they enable rapid analysis at low operating costs and with no environmental pollution.
QuEChERS is a sample preparation approach entailing solvent extraction of high-moisture content samples with water-miscible solvents and partitioning with high amounts of salts followed by cleanup using dispersive SPE. This technique was developed by Anastassides et al.,15 primarily for the simultaneous extraction of pesticides of varying chemical properties. The QuEChERS extraction technique is gaining popularity due to its simplicity, use of minimal volumes of non-chlorinated organic solvents and its applicability to a wide range of pesticides of differing polarities, volatilities and matrices.21-26 In addition, the technique has shown good extraction recoveries in the range of 70-120 %.27
The main objective of this work was to develop simple and rapid extraction procedures employing SPME and QuEChERS for the determination of pesticides in edible plant samples. The two techniques were compared in terms of their extraction efficiencies and simplicity. It should be noted that side-by-side comparisons were not possible due to the differences in extraction mechanisms and matrix effects. The applicability of the techniques was established by extracting pesticides from plant samples from the Okavango Delta, Botswana.
2. Experimental
2.1. Standards, Reagents and Instrumentation
Dieldrin (98.5 %), aldrin (98.8 %), 1,1-dichloro-2,2-bis[p-chlorophenyl]ethylene (PP'DDE) (99.5 %) and 1,1,1-trichloro-2,2-bis[p-chlorophenyl]ethane (p.p'-DDT) (98.5 %) were obtained from ChemService (West Chester, PA, USA). 1,1-Dichloro-2,4-bis[chlorophenyl]ethane (2,4'DDD) (99.7 %), endrin (99.1 %), trichloro benzene (99.1 %; internal standard) and endosulfan (98 %) were obtained from Riedel-de-Haen (Seelze, Germany). Analytical reagent grade acetone and GC/HPLC grade acetonitrile were purchased from Ultrafine Limited (London, England).
A Salton Elite blender from Amalgamated Appliances Limited (Cape Town, South Africa) was used for homogenizing the sample. An ALC centrifugette from ALC International Srl (Milan, Italy) was used for centrifuging the samples. Buffered QuEChERS extraction tubes (containing 50 mg primary and secondary amines (PSA) and 150 mg magnesium sulphate (MgSO4) were purchased from Agilent Technologies (USA). 15 mL SPME sampling vials, the sampling stand, SPME fibres (70 µm divinylbenzene/polydimethylsiloxane (DVB/PDMS)100 µm polydimethylsiloxane (PDMS), and 85 µm polyacrylate (PA) and fibre holders were bought from Supelco (Bellefonte, PA, USA).
Gas Chromatography was performed on a 6290 Autosystem XL gas Chromatograph manufactured by Perkin Elmer (Norwalk, Connecticut, USA) equipped with a split/splitless injector and a 63Ni electron capture detector (ECD). A DB-5 ms (5 % phenyl, 95 % methylpolysiloxane) fused silica capillary column 25 m x 0.25 mm x 0.25 µm (film thickness) manufactured by J&W Scientific (Torrence, CA, USA) was employed in the separation of analytes. Ultra-high-purity nitrogen gas was used as a carrier gas at a column head pressure of 96.5 Kpa producing a flow rate of 1 mL min-1. The injector and detector temperatures were set at 250 and 300 °C, respectively. The oven temperature was programmed from an initial value of 50 °C (held for 1 min), ramped to 200 °C at a rate of 40 °C min-1 (held for 2 min), ramped to 240 °C at a rate of 4 °C min-1 (held for 2 min)and finally ramped to 300 °C at a rate of 4 °C min-1 (held for 5 min). The injection volume was 2 µL in the splitless mode.
The analytes were confirmed on a 6890N gas chromatography equipped with 7683 autosampler (Agilent Technologies, Shanghai, China) connected to a GCT Premier time of flight (TOF) mass spectrometer (Waters, Manchester, England). The GC column and conditions were the same as for GC-ECD analyses. Full scan (m/z 50-650) GC/MS acquisition was performed at 1 scan sec-1.
Electron ionization (70 eV) was used with a filament emission current of 400 µA. The injector and transfer temperatures were maintained at 250 °C and the ion source was maintained at 300 °C. Helium was used as a carrier gas at a flow rate of 1 mL min-1. The electron ionization (EI) source was set in the positive mode. The mass spectra received were compared to the NIST/ EPA/NIH Mass spectral library, Version 2005 (Newfield NT, USA) through the Automated Mass Spectral Deconvolution and Identification System (AMDIS) developed by the National Institute for Standards and Technology (NIST). The identities of compounds were also confirmed by comparing their mass spectra and retention times with those obtained for the respective standards.
2.2. Optimization of the SPME Parameters
During the SPME experiments, samples were continuously stirred at a constant speed of 500 rpm. Fibre type, extraction temperature, extraction time and phase ratios were optimized as described below:
Three fibres, 100 µm PDMS, 70 µm DVB/PDMS) and 85 µm PA were preconditioned in the injection port of the gas chromato-graph (Agilent Technologies, Shanghai, China) at 250 °C for 30 min (according to the instructions provided by the supplier). Each fibre was then exposed in the headspace above 10 mL of 100 µg L-1 standard and internal standard mixture for 20 min at 60 °C to adsorb the volatiles of interest. The adsorbed analytes were thermally desorbed in the injector port of the GC. The results were used to evaluate the best fibre to use for subsequent experiments.
In order to study the effect of temperature on the extraction process, the study was carried out by varying the temperature in the range from 25.3 °C (room temperature) to 90 °C for 30 min which was the optimal extraction time. 10 mL standard and the internal standard mixture (100 µg L-1) was added to the headspace sampling vial, then the PDMS fibre was exposed in the headspace above the mixture and the analytes were adsorbed on to the fibre. The above procedure was repeated for extracting at 10 °C interval from 40 to 90 °C.
Ten millilitres of the standard and the internal standard mixture (100 µg L-1) was added to the headspace sampling vial, and then the PDMS fibre was exposed in headspace above the mixture for 10 min at 60 °C to adsorb the analytes. The above procedure was repeated for extracting at 10-min intervals from 20 to 60 min in order to determine the optimum extraction time.
2.5 mL of the standard and the internal standard mixture (100 µg L-1) was added to the headspace sampling vial, and then the analytes were adsorbed on to the PDMS fibre for 30 min at 60 °C and then desorbed into the GC column. The above procedure was repeated for extraction at 2.5 mL intervals from 2.5 to 12.5 mL of the standard mixture to evaluate the optimum phase ratio.
2.3. Optimization of the QuEChERS Parameters
QuEChERS extraction method was optimized in terms of extraction time, phase ratio and the best extracting solvent.
7.5 g of the homogenized plant sample was added to a 20-mL centrifuge tube. Then 5 mL acetonitrile, 100 µL internal standard and 100 µL of 100 µg L-1 pesticide mixture was added to the centrifuge tube. The tube was capped and shaken thoroughly by hand. Then the extraction salts were added to the tube, and were centrifuged for 2 min. An aliquot of the acetonitrile phase was added to the cleanup salts, centrifuged further and the supernatant was then taken for analysis with GC-ECD. This proce- dure was repeated at different times; 5, 8, 11 and 15 min. The results were used to evaluate the optimum time after extraction.
To a 20 mL centrifuge tube, 2.5 g of the homogenized plant sample was added. This was followed by addition of 5 mL of acetonitrile, 10 ng internal standard and 100 µL of 100 µg L-1 pesticide mixture. The tube was capped and shaken thoroughly by hand. The salts were added accordingly for extraction and cleanup and then centrifuged. The final extract was taken for GC-ECD analysis. This procedure was repeated for phase ratios (sample mass: solvent volume ratio) 0.5 to 2.5 to obtain the optimum phase ratio.
5 mL of acetone and 10 ng internal standard were added to 5 g of the sample homogenate in the centrifuge tube. Then 100 µL of 100 µg L-1 pesticide mixture was added to the centrifuge. The tube was capped and shaken thoroughly by hand. Then the extraction and cleanup salts were added to the tube, and then the tube was centrifuged for 5 min. The final extract was taken for GC-ECD analysis. The above procedure was repeated using acetonitrile and ethyl acetate, and the best extracting solvent selected for subsequent analysis.
2.4. Analytical Parameters
100 µg L-1stock solutions of each pesticide standard and the internal standard were prepared in acetonitrile.
Five point calibration curves using the internal standard calibration modes were prepared using concentration ranges of 2.0 to 20.0 µg L-1 prepared by diluting the stock solution to the desired concentrations and vortexing to ensure complete mixing. 100 µL of the internal standard stock solution was added to each mixture. The detection limits were calculated as the concentration of the analyte giving a signal equal to the blank signal plus three standard deviations of the blank. In the absence of certified reference material (CRM) for Tswii and other plant matrices, percentage recoveries were obtained by comparing the responses from spiked blank Tswii root samples with those of the standard solutions. Recovery studies of pesticides were investigated in triplicates at two different concentrations; 2.0 µg L-1 and 20 µg L-1 for SPME and 2.5 µg L-1 and 20 µg L-1 for QuEChERS using a mixture of pesticides standards.
2.5. Application of the Optimized Conditions to Extract Pesticides from Plant Samples
The leaves, roots and stem samples of Nymphaea nouchali (Tswii), leaves and stems of Cleome hirta (Cyprus), and fruits and leaves of Asparagus africanus (Mochaba) were collected in February, 2010 along the Thamalakane and Boro Rivers. The samples were wrapped in aluminium foil, which had previously been rinsed with acetone and dried. The samples were stored in ice until arrival in the laboratory, where they were preserved in a cold room at 4 °C. Prior to analysis, samples were cut into small pieces and placed in the freezer overnight to facilitate subsequent processing. Approximately 50 g of the sample was homogenized employing cryogenic milling.
2.5.1.Extraction of Pesticides from Plant Samples by HS-SPME
Pesticide residues were extracted from plant homogenates using the optimized SPME parameters. Briefly, slurry was prepared by adding 2 mL of water to8gofthehomogenized plant samples in a vial. The vial was capped and shaken for 5 min. The vial was heated to 70 °C and the PDMS fibre was exposed in the headspace above the sample with phase ratio of 2.0 for 30 min. The analytes were desorbed into the inlet of the gas chromato-graph.
2.5.2. Extraction of Pesticides from Plant Samples by QuEChERS
Pesticide residues were extracted from plant homogenates according to the modified AOAC QuEChERS Method (2007.01).28 Briefly, 7.5 g of the homogenized plant sample was added to the centrifuge tube followed by 5 mL acetonitrile and10 ng of internal standard. The tube was capped and shaken vigorously for 1 min by hand. A buffer salt mixture containing magnesium sulphate and disodium acetate was added to the suspension derived from the first extraction. The tube was then closed, shaken by hand for 1 min and centrifuged for 8 min at 3000 rpm. The cleanup was carried out by transferring an aliquot of the acetonitrile phase to a centrifuge tube containing PSA and magnesium sulphate. The tube was closed, shaken by hand for 1 min and then centrifuged for 8 min at 3000 rpm. The supernatant was then ready for injection into the GC chromato-graphic system.
3. Results and Discussion
3.1. Optimization of Experimental Conditions
Various parameters for the extraction of pesticides using SPME and QuEChERS were optimized and employed for combination of GC-MS or GC-ECD for the qualitative and quantitative determination of pesticides in selected plant samples.
3.2. Analytical Parameters
The correlation coefficients were above 0.995 for all the analytes, indicating good linearity. All pesticides were easily detected at low concentrations; 0.546 to 1.809 µg L-1. The methods developed demonstrated adequate sensitivity for trace analysis. A small range of % RSD observed, 2.032 to 3.212, indicated good repeatability. The recoveries of all the pesticides ranged from 61 to 89 % for SPME and 75 to 95 % for QuEChERS. These recoveries are consistent with those reported by other researchers.21,29 Generally, the less polar pesticides gave the highest recoveries. DDT and endosulfan gave the highest recoveries; 85 to 89 % for SPME and 91 to 95 % for QuEChERS. The recoveries obtained for SPME were lower and this could be a result of sample losses incurred during sampling and transfer into the GC. For the two spiking concentrations levels, higher recoveries were obtained for the higher spiking concentration.
3.3. Optimization of Experimental Conditions
3.3.1. Fibre Selection
Of the three fibres, the results showed that the fibres could be ranked in order of exhibiting high to low extraction efficiencies as follows: PDMS-100 µm > DVB/PDMS-70 µm > PA-85 µm for dieldrin, endrin, endosulfan and aldrin. Compounds with lower partition ratio such as dieldrin, endosulfan and endrin were more extensively adsorbed on the PDMS fibre and gave higher recoveries. Since PDMS gave better extraction efficiencies, it was preferred for the rest of the study.
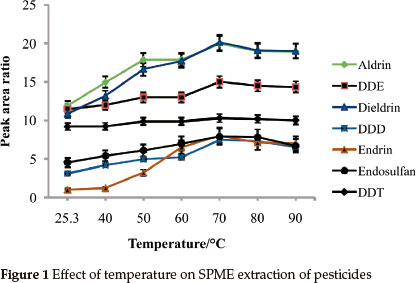
3.1.2. Extraction Temperature
Effect of temperature on adsorptivity of analytes was studied in the range of 25.3 °C (room temp) to 90 °C (Fig. 1). Generally, the extraction efficiency markedly improved with the increase in temperature up to 70 °C. For all of the analytes under study, maximum adsorptivity was observed at 70 °C. At temperatures above 70 °C the ability of the SPME fibre to adsorb the pesticides was observed to drop. This can also be explained thermodynamically because high temperatures decrease the partition coefficient between the analytes and the fibre. Also adsorption is an exo- thermic process and therefore is not favourable at high temperatures. All of the pesticides under study showed appreciable recoveries when the extraction temperature was 70 °C. This temperature was selected as the optimal temperature and used for the rest of the study.
3.1.3.Extraction Time
SPME: The extraction time was studied in the range of 10 to 50 min and the results are shown in Fig. 2A.

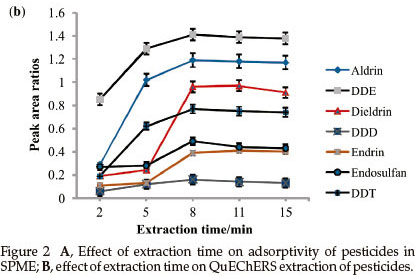
Endosulfan, endrin and dieldrin reached equilibrium faster (20 min) than aldrin, DDE, DDD and DDT. This phenomenon has also been observed by Chen and co workers.13 DDD, aldrin and DDE showed a decrease in response after 30 min. The decrease may be attributed to reverse diffusion to maintain partition equilibrium. 30 min was chosen to perform the rest of the analysis as it gave maximum adsorption capacity for all analytes.
QuEChERS: The effect of extraction time on the extraction efficiency of QuEChERS was examined over the range of 2 to 15 min and the results are shown in Fig. 2B.
For all the pesticides under study, increasing the extraction time from 2 to 8 min showed an increase in the recovery. Beyond 8 min, a slight decline in response was observed, probably due to the evaporation or dissolution of the organic solvent, which caused a decrease in the extraction efficiency of analyte. An extraction time of 8 min was selected for further experimental work.
3.1.4 Phase Ratio
SPME: The effect of phase ratio (Equation 1) on adsorptivity response was studied in the phase ratio range of 0.5 to 5 and the results are shown in Fig. 3A.


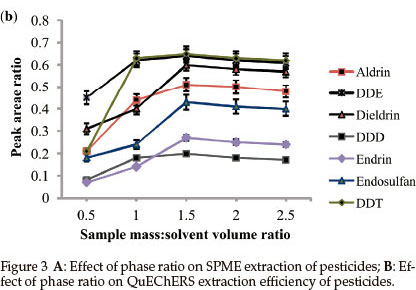
where V is the volume of the respective phase.
When the phase ratio was increased from 0.2 to 2, extraction efficiency for the analytes improved. At lower phase ratios, lower extraction efficiencies were obtained since a significant portion of the analytes has to be transported to the fibre from the sample and also mass transfer of analytes into the bulk of the fibre represents a slow step in the overall process.20 For DDD, endrin and endosulfan, a slight decrease in response was observed at phase ratios above 2. This could be due to reverse diffusion of analytes from the fibre to sample as a result of overload. Since phase ratio of 2 gave the highest recoveries of all the pesticides, it was used in the rest of the study.
QuEChERS: Phase ratio for QuEChERS is defined as the mass of sample to extraction solvent volume (m/v). The effect of the mass of the sample on extraction efficiency of QuEChERS extraction was performed by varying mass from 2.5 to 12.5 g while the volume of the organic phase, acetonitrile, remained constant (5 mL).
Figure 3B shows that the most polar pesticides (DDD, DDE and DDT) required a phase ratio of 1 to completely partition into the acetonitrile phase. The less polar pesticides needed a slightly higher phase ratio of 1.5 to completely partition into the organic phase. These results indicate that the use of a minimum quantity of the organic solvent for increased sensitivity will still yield good recovery values. So the sample phase ratio that gave the highest recoveries for all of the pesticides, 1.5, was selected and used for subsequent analyses.
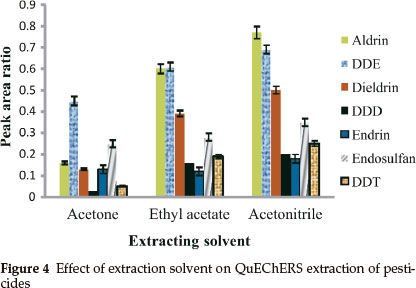
3.1.5. Effect of Solvent
Even though acetonitrile is the most used solvent in QuEChERS extraction, other solvents such as acetone24 and ethyl acetate23 have been used for pesticide extraction using QuEChERS extraction. Acetonitrile, acetone and ethyl acetate were selected and used to extract the pesticides from spiked samples. It was observed that extraction of pesticides with acetonitrile gave the highest recoveries when compared to acetone and ethyl acetate (see Fig. 4). Upon the addition of salts, acetonitrile is separated more easily from water than acetone.28 It also allows the better removal of residual water with magnesium sulphate.30 As acetonitrile gave the highest recoveries of analytes studied compared to the other two solvents, it was chosen as the optimal extraction solvent for this study.
3.2. Applications of the Extraction Techniques to Plant Samples
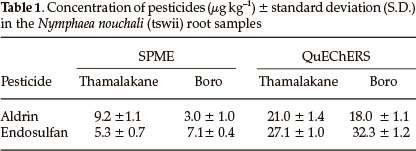
The optimized QuEChERS conditions were applied to the different parts of the three plant samples Nymphaea nouchali (Tswii), Asparagus africanus (Mochaba) and Cleome hirta (Cyprus) obtained from the Okavango Delta. Clean chromatograms were obtained by both methods. Pesticides were not detected in both Asparagus africanus and Cleome hirta samples but were detected only in the roots of Nymphaea nouchali. Trichlorobenzene (IS), aldrin and endosulfan were identified based on comparison of their retention times with those of the standards and confirmed with GC-MS. The amount of pesticides in Nymphaea nouchali root samples collected from Thamalakane River and Boro River are shown in the Table 1. The maximum recommended levels of aldrin and endosulfan are 100 to 500 µg kg-1 and 500 to 1000 µg kg-1 in fruits and vegetables, nuts and other foodstuffs, so the detected concentrations are below their MRLs.31 These pesticides are used in agricultural activities on farms, vegetable gardens and plantations in the vicinity of the sampling sites.32 Both the Boro and Thamalakane rivers are at the receiving ends of the delta and are rich in organic matter, hence accumulating considerable amounts of pesticides by adsorption.18
It was observed that SPME extracted less than 50 % of what QuEChERS was able to extract. The difference in recoveries could be due to matrix effects. SPME fibre adsorbs volatile compounds in the headspace whose polarity is favoured by the fibre leaving analytes which might be trapped in the matrix. The efficiency will then be decreased and hence lower concentrations are observed.
4. Conclusions
In this study, SPME and QuEChERS methods were modified and optimized for the extraction of pesticides in plant samples. GC-ECD and GC-MS were used to analyse selected pesticides in different parts of the three plant samples: Nymphaea nouchali (Tswii), Asparagus africanus (Mochaba) and Cleome hirta (Cyprus). Aldrin (3-21 µg kg-1), endosulfan (5-32 µg kg-1), penta-chlorobenzene and hexachlorobenzene were detected in the roots of Nymphaea nouchali.
The developed methods described are sensitive, reproducible, simple, rapid, and offer a cheap means of screening plants for trace amounts of pesticides. They could be used for quick screening for pesticides in plant samples suspected to be contaminated. Overall, the two methods use minimal or no solvents, and are therefore friendly to the environment (green techniques).
Acknowledgements
The authors appreciate financial support from the University of Botswana and United Nations Development Program - the Small Grant Programme (Global Environmental Fund).
References
1 M.S. El-Shahawi, A. Hamza, A.S. Bashammakh and WT. Al-Saggaf, Talanta, 2010, 80, 1587-1597. [ Links ]
2 L. RöhrigandH.U.Meisch, Fresenius J.Anal. Chem.,2000, 366, 106-111. [ Links ]
3 P. Zhang, J. Son and H. Juan, Environ. Int., 2009, 35, 632-646. [ Links ]
4 J. Sherma and T. Caines, Comprehensive Analytical Profiles of Important Pesticides, CRC Press, London, UK, 1993, 15. [ Links ]
5 D.H. Lee, I.K. Lee, K. Song, M. Steffes, W. Toscano, B.A. Baker and D.R. Jacobs, Jr, Diabetes Care, 2006, 29, 1638-1644. [ Links ]
6 A.L. Simplicio and L.V. Boas, J. Chromatogr. A, 2006, 833, 35-42. [ Links ]
7 H.N. Geisz, R.M. Dickhut, M.A. Cochran, W.R. Fraser and H.W Ducklow, Environ. Sci. Technol., 2008, 42, 3958-3962. [ Links ]
8 C. Manuela, D. M. Cristina and A. Arminda, J. Chromatog. A, 2000, 889, 59-67. [ Links ]
9 P.M. Kgori, S. Modo and S.J. Torr, Acta Tropica, 2006, 99, 184-199. [ Links ]
10 P.S. Daka, V.C. Obuseng, N. Torto and P. Huntsman-Mapila, Water SA, 2006, 32, 483-488. [ Links ]
11 B. Mbongwe, M. Legrand, J.M. Blais, L.E. Kimpe, J.J. Ridal and D.R.S. Lean, Environ. Toxicol. Chem., 22, 7-19. [ Links ]
12 M.B. Pareira, M.J.G. Castro, S.M. Lorenzo, L.P. Mahia, D.P. Rodriguez and E.F. Fernandez, 2007, Talanta, 2007, 15, 1345-1351. [ Links ]
13 S. Chen, X. Yu, X. Te, D. Xie, Y. Fan and J. Peng, Food Chem., 2007, 113, 1297-1300. [ Links ]
14 C.L. Arthur and J. Pawliszyn, Anal. Chem., 1990, 62, 2145-2148. [ Links ]
15 M. Annastassides, S.J. Lehotay, D. Stajnbaher and F.J. Schenck, J. AOAC Int., 2003, 86, 412-431. [ Links ]
16 C. Bicchi, S. Drigo and P. Rubiolo, J. Chromatogr. A, 2000, 892, 469-485. [ Links ]
17 A. Menezes-Filho, F.N. dos Santos and P.A. Pereira, Microchem. J., 2010, 84, 134-145. [ Links ]
18 L.C. Mmualefe, N. Torto, P. Huntsman-Mapila and B. Mbongwe, Microchem. J., 2009, 91, 239-244. [ Links ]
19 F.M. Fernandez-Alvarez, M. Llompart, J.P. Lamas, M. Lores, C. Garcia-Jares, R. Cela and T. Dagnac, J. Chromatogr. A, 2008, 1188, 154-163. [ Links ]
20 A. Achouri, J.I. Boye and Y. Zamani, Food Chem, 2006, 99, 759-766. [ Links ]
21 E. Cieslike, A. Sadowska-Rociek, J.M.M. Ruiz and M. Surma-Zadora, Food Chem., 2011, 125, 773-778. [ Links ]
22 G. Chen, P. Cao and R. Liu. R., Food Chem., 2011, 125, 1406-1411. [ Links ]
23 S.J. Lehotay, K.A. Son, H. Kwon, U. Koesukwiwat, W. Fu, K. Matsovska, E. Hoh and N. Leepipatpiboon, J. Chromatogr. A., 2010, 1217, 2548-2560. [ Links ]
24 J. Wong, C. Hao, K. Zhang, P. Yang, K. Banerjee, D. Hayward, I. Iftakhar, A. Schreiber, K. Tech, C. Sack, M. Smoker, X. Chen, S.C. Utture and D.P. Oulkar, J. Agric. Food Chem., 2010, 58, 5897-5903. [ Links ]
25 T.D. Nguyen, J.E. Yu, D.M Lee and G. Lee, Food Chem, 2008, 110, 207-213. [ Links ]
26 S.J. Lehotay, J. AOAC Int., 2007, 90, 485-520. [ Links ]
27 S.J. Lehotay, K. Mastovska and S.J. Yun, J. AOAC Int., 2005, 88, 630-638. [ Links ]
28 R.E. Majors,2008, QuEChERS, A New Technique for Multiresidue Analysis of Pesticides Foods and Agricultural Samples. Agilent Technologies, Wilmington DC, USA. [ Links ]
29 C. Dong, Z. Zeng and M. Yang, Talanta, 2005, 66, 721-727. [ Links ]
30 D. Steiniger, J. Butler and E. Phillips, 2008, Multiresidue analysis in onion by a modified QuEChERS extraction and ion trap GC/MS analysis. Thermo Fischer Scientific, Waltham, MA, U.S.A. [ Links ]
31 Codex Alimentarius, 2010, Pesticide Residues in Food and Feed. Joint FAO/WHO Food Standards Programme, Food and Agriculture Organization of the United Nations. [ Links ]
32 M.L.H. Mabaso, B. Sharp and C. Lengeller, Trop. Med. Int. Health, 2004, 9, 846-856. [ Links ]
Received 31 October 2012
Revised 17 May 2013
Accepted 20 May 2013
* To whom correspondence should be addressed. E-mail: obusengv@mopipi.ub.bw

