


![Synthesis and characterization of new bis-symmetrical adipoyl, terepthaloyl, chiral diimido-di-L-alanine diesters and chiral phthaloyl-L-alanine ester of tripropoxy p-tert-butyl calix[4]arene and study of their hosting ability for alanine and Na+](/img/es/prev.gif)


Servicios Personalizados
Articulo
 Inglés (pdf)
 Articulo en XML
 Referencias del artículo
Indicadores

Links relacionados
-
 Citado por Google
 -
 Similares en Google
Compartir

 Permalink
South African Journal of Chemistry
versión On-line ISSN 1996-840X
versión impresa ISSN 0379-4350
S.Afr.j.chem. (Online) vol.66 Durban ago. 2013
RESEARCH ARTICLE
Adsorptive removal of malachite green with activated carbon prepared from oil palm fruit fibre by KOH activation and CO2 gasification
Olugbenga Solomon Bello
Department of Pure and Applied Chemistry, Ladoke Akintola University of Technology, P.M.B 4000, Ogbomoso, Oyo State, Nigeria. School of Chemical Engineering, Engineering Campus, Universiti Sains Malaysia, 14300 Nibong Tebal, Penang, Malaysia. E-mail: osbello@yahoo.com
ABSTRACT
The adsorptive potential of activated carbon prepared by chemical activation from oil palm fruit fibre (OPFAC) to remove malachite green (MG) dye from its aqueous solution was investigated in this study. The OPFAC prepared was characterized by means of BET, TGA, FTIR, pHpzc, elemental analysis and Boehm titration. Operational parameters such as pH, adsorbent dose, contact time, initial dye concentration and temperature were studied in batch process. It was found that OPFAC has a larger surface area and total pore volume than commercially activated carbon. The adsorption process attained equilibrium in 45 minutes. Equilibrium data were tested by using two isotherm models: Langmuir and Freundlich. It was found that adsorption of MG on OPFAC correlated well with the Langmuir isotherm model with a maximum monolayer adsorption capacity of 356.27 mg g-1. The kinetics of the adsorption process was tested by means of pseudo-first-order, pseudo-second-order and intraparticle diffusion models. The pseudo-second-order kinetic model provided the best correlation for the experimental data studied. The adsorption process is controlled by both the boundary layer and intraparticle diffusion mechanisms. The thermodynamic study showed that the process is endothermic, spontaneous and feasible. Cost analysis revealed that OPFAC is 20 times cheaper than commercially available activated carbon.
Keywords: Oil palm fruit fibre, dye, adsorption, spontaneous, endothermic, activated carbon.
1. Introduction
Colour is a visible pollutant and one of the most important hazardous species found in industrial effluents. The presence of dyes and pigments in water, even at very low concentrations, is highly undesirable.1 More than 10 000 dyes are extensively used in industrial processes producing items such as textiles, paper, plastics, leather, pharmaceuticals, food, cosmetics, solvents, etc.2-4. As a result, a considerable amount of coloured wastewater is generated. The discharge of dye-coloured wastewaters into the aquatic ecosystem causes both environmental and public health risks because of the negative eco-toxicological effects and bioaccumulation in wildlife. Most importantly, dyes in waste-waters decompose into carcinogenic compounds under aerobic conditions thereby causing serious health problems to humans and animals.5,6 Also, dyes can cause allergy, dermatitis, skin irritation and cancer in humans.7 Additionally, colour in surface water may affect photosynthesis by preventing light penetration, thereby destroying aquatic life.8
Malachite green (MG), an N-methylated diaminotriphenylmethane dye, which is also referred to as Basic Green 4, is the most widely used dye for colouring purposes among all other dyes of its category.9 It is extensively used as a biocide in the aquaculture industry worldwide due to its effectiveness against parasitic treatment, fungal and bacterial infections in fish and fish eggs.10. It is also used as a food colouring agent, food additive, a medical disinfectant and anthelminthic as well as a dye in the silk, wool, jute, leather, cotton, paper and acrylic industries.11,12 However, there are several reports describing its hazardous and carcinogenic effects.13 It is highly cytotoxic and carcinogenic to mammalian cells and acts as a liver tumor promoter. It decreases food intake capacity, growth and fertility rates; causes damage to the liver, spleen, kidney and heart; and inflicts lesions on the skin, eyes, lungs and bones.14. MG is also environmentally persistent and acutely toxic to a wide range of aquatic and terrestrial animals. Therefore, the treatment of effluents containing this dye is of prime importance due to its harmful impacts on receiving waters. The disposal of dye wastewater without proper treatment is a big challenge to both man and aquatic organisms.
The use of agricultural residues presents significant advantages, because they are cheap and are obtained from renewable sources. As a result, several works have been reported involving the production of activated carbon by using agricultural residues, such as apricot and/or cherry pits, wheat straw, bean and rice husks, nut husks, corn husks and many others.15-22 In the south western part of Nigeria, oil palm cultivation has reached a staggering two million hectares and produces over six million tonnes of oil annually. The oil palm industries generate a large volume of residual lignocellulosic material mainly in the form of fibres that can be readily turned into useful value-added products. Hence, in this study an attempt was made to develop an inexpensive adsorbent for the removal of MG dye from aqueous solutions by using activated carbon produced from oil palm fruit fibre (OPFAC). Other factors such as the adsorbent dose, initial MG dye concentration, temperature, pH, contact time, and thermodynamic parameters were also investigated.
2. Materials and Methods
2.1. Preparation of Adsorbate Solutions
The dye, malachite green oxalate, C.I. Basic Green 4, Classification Number 42 000, with the chemical formula C52H54N4O12, and molar mass of 927.00 g mol-1, λmax = 618 nm (measured value) was supplied by Sigma-Aldrich and used as received. Stock solutions were prepared by dissolving accurately weighed samples of MG dye in distilled water to give a concentration of 1000 mg L-1. This stock solution was then diluted to the required concentration by serial dilution.
2.2. Preparation of OPFAC
Oil palm fruit fibre (OPF) was obtained from a local oil palm mill in Ogbomoso, Oyo State, Nigeria. The fibre collected was de-oiled by soaking it in hot deionized water for 24 hours. It was rinsed thoroughly in hot deionized water several times to remove all debris and then air-dried. The air dried oil palm fruit fibre was ground by using a medium size mortar and pestle. The pretreated material was then carbonized at 700 °C under nitrogen atmosphere for 1 h (first pyrolysis). A certain amount of the char produced was then soaked with 10 % potassium hydroxide (KOH) at an impregnation ratio of 1:1 (KOH pellets: char). The mixture was dehydrated in an oven overnight at 105 °C; then pyrolyzed in a stainless steel vertical tubular reactor placed in a tube furnace under high-purity nitrogen (99.995%) flow of 150 cm3 min-1 (second pyrolysis) to a final temperature of 850 °C and activated for 2 h. Once the final temperature was reached, the gas flow was switched to CO2 and activation was continued for 2 h. The activated product referred to as OPFAC was then cooled to room temperature under nitrogen flow and washed with deionized water to remove any remaining chemicals. Subsequently, the sample was transferred to a beakercontaining a 250 mL solution of 0.1 M hydrochloric acid and stirred for 1 h. It was then washed with hot deionized water until the pH of the washing solution reached 6.5-7.
2.3. Characterization of OPFAC
Textural characterization of the OPFAC was carried out by N2 adsorption at 77 K with an Autosorb I, supplied by Quantachrome Corporation, USA. FTIR spectra of these samples were obtained on a JASCO FTIR-3500 spectrometer. Proximate analysis was carried out by using a thermo-gravimetric analyzer (TGA) (Model Perkin Elmer TGA7, USA) and elemental analysis was performed with an elemental analyzer (Perkin Elmer series II 2400, USA). pHpzc was determined by pipetting 50 mL of 0.01 M NaCl solution in a series of closed Erlenmeyer flasks. The pH of these solutions was adjusted to a value between 2 and 12by adding either 0.1 M HCl or0.1M NaOH solution. Then 0.15 g of OPFAC sample was added to each flask and agitated at 150 rpm for 48 h under atmospheric conditions. The final pH was measured. The results were plotted with ApH (Initial pH - Final pH) against final pH. The pH at which the curve crosses the pHinitial -pHfinal line is taken as pHpzc.23 The total surface basicity and acidity of the samples was determined by titration with NaOH and HCl by means of the Boehm titration method.24 A mass of 0.15 g of OPFAC was mixed with 50 mL of 0.05 M NaOH or HCl solutions for 48 h with continuous stirring. An aliquot of 10 mL of each filtrate was then titrated against 0.05 M HCl or NaOH, by using phenolphthalein as indicator. The capacities for H+ and OH- were then calculated.
2.4. Batch Equilibrium Studies
Batch equilibrium tests were carried out for the adsorption of MG dye on OPFAC. The effects of adsorbent dose, initial dye concentration, contact time, temperature and solution pH on the adsorption uptake were investigated. Sample solutions were withdrawn at equilibrium to determine the residual dye concentrations. The solutions were filtered prior to analysis in order to minimize interference of the carbon fine with the analysis. For equilibrium studies, the experiment was carried out for 120 min to ensure that equilibrium was reached. The concentration of MG dye solution before and after adsorption was determined by using a double UV-vis spectrophotometer (UV-1800 Shimadzu, Japan) at a maximum wavelength of 618 nm. The dye concentrations were determined from a linear calibration line of absorbance against concentration of dye solution. The amount of MG dye adsorbed at equilibrium, qe (mg g-1) was calculated according to Eq. (1):

where Co and Ce (mg L-1) are the initial and equilibrium liquid-phase concentrations ofMG dye,respectively,V(l) is the volume of the solution and W (g) is the mass of dry OPFAC used.
Experiments were replicated three times and the blanks were run in parallel to establish accuracy, reliability and reproducibility.
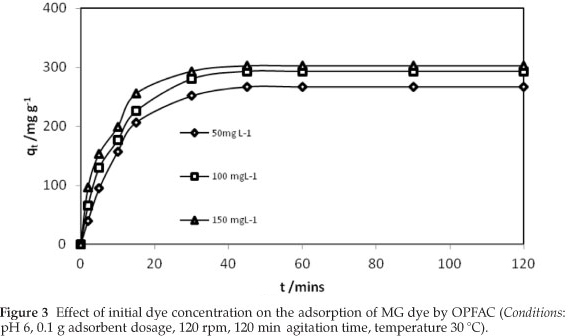
2.4.1. Effect of Initial MG Dye Concentration
In order to study the effect of initial concentration on the MG dye uptake, 100 mL of MG dye solution with initial concentrations of 50-150 mg L-1 were prepared in a series of 250 mL Erlenmeyer flasks. An equal mass of 0.10 g of the OPFAC was added into each flask covered with a glass stopper and the flasks were then placed in an isothermal water bath shaker at a temperature of 30 °C with rotation speed of 120 rpm, until equilibrium point was reached.
2.4.2. Effect of Solution Temperature and pH
The effect of solution temperature on the MG dye adsorption process was examined by varying the adsorption temperature at 30, 45 and 60 oC by adjusting the temperature controller of the water bath shaker, while other operating parameters such as volume of MG dye and rotation speed were kept constant. The initial MG concentration was varied ranging from 50-150 mg L-1 of MG dye initial concentration. The effect of solution pH on the MG dye adsorption process was studied by varying the initial pH of the solution from 3 to 10. The pH was adjusted by adding 0.1 M hydrochloric acid and/or 0.1 M sodium hydroxide, and was measured by using a pH meter (Model Delta 320, Mettler Toledo, China). The MG dye initial concentration was fixed at 100 mg L-1 with adsorbent dosage of 0.1 g at a volume of 100 mL. The solution temperature was maintained at 30 °C. The percentage of MG dye removed was calculated by using Eq. (2).

3. Results and Discussion
3.1. Characterization of Adsorbent
It was found that the BET surface area, total pore volume and average pore diameter of the OPFAC were 1254 m2 g-1, 1.115 cm3 g-1and 2.54 nm, respectively. The porosity of OPFAC is well developed with higher surface area, total pore volume and larger average pore diameter, thereby favouring MG dye adsorption. This indicated that OPFAC was mesoporous, with a relatively large surface area and total pore volume when compared to commercially available activated carbons such as BDH, F100 and BPL from Calgon Corporation with BET surface area of 1118, 957 and 972 m2 g-1 as well as total pore volume of 0.618, 0.526 and 0.525 cm3 g-1, respectively.25 Stavropoulos and Zabaniotou25 stated that KOH is dehydrated to K2O, which reacts with the CO2 produced by the water-shift reaction, to give K2CO3. Intercalation of metallic potassium appeared to be responsible for the drastic expansion of the carbon material and hence the creation of a large specific surface area and high pore volume. A similar observation was reported by Tseng et al.26 where CO2 gasification was found to promote the formation of mesopores and enhance the surface area of the activated carbon. This shows that KOH and CO2 are effective in creating well-developed pores on the surface of the precursor, leading to OPFAC with a large surface area and porous structure.27,28 These pores allowed a good surface for MG dye to be trapped and adsorbed into.29,30
The FTIR spectra of OPFAC before and after adsorption are shown in Fig. 1. The wide band at 3413 cm-1 shown in the spectrum of OPFAC (Fig. 1(a)) is attributed to the stretching vibration of the hydroxyl group of OPFAC. This band was shifted to 3391 cm-1 when MG dye was adsorbed (Fig. 1(b)). It may indicate a hydrogen bond between the MG dye and OH groups of OPFAC. The band at 2919 cm-1 shown in Fig. 1(a) is assigned to the C-H stretching vibration of OPFAC. There was no significant decrease for this band in the spectrum of OPFAC-MG (Fig. 1(b)) as it was shifted from 2919 to 2920 cm-1. The bands at 1451 cm-1 and 1369 cm-1 in the spectrum of OPFAC-MG are due to aliphatic and aromatic C-H bending in the spectrum of OPFAC before adsorption. The band observed at 1631 cm-1 in the OPFAC spectrum corresponds to N-H bending vibrations. This band shifted from 1631 cm-1 to 1635 cm-1 when the adsorption of the MG dye occured. In the spectrum of OPFAC there are two bands, one at 1161 cm-1 and another at 1067 cm-1, these bands indicate stretching vibrations of C-O groups. The first band did not demonstrate any change upon adsorption of MG. On the other hand, a remarkable shift was observed for the other band which shifted to 1033 cm-1. This can be considered as further evidence for the interaction between OPFAC and the MG dye cation.

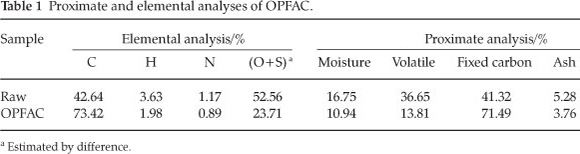
The proximate and elemental analyses of OPFAC are presented in Table 1. The volatile matter and ash contents in the OPFAC were 13.81 % and 3.76 %, respectively. The fixed carbon content was satisfactory enough in OPFAC, having a value of 71.49 % indicating that the precursor was suitable for activated carbon preparation. Moisture content was 10.94 %. Elemental analyses of the raw OPF and OPFAC gave the percentage of C, H, N and otherstobe42.64%,3.63%,1.17% and52.56% and73.42%,1.98%, 0.89% and 23.71%, respectively. The fixed carbon improved after activation, this is also noted in the elemental analysis. Both samples have low nitrogen content, less than 2 %.
3.2. Effect of Contact Time and Adsorbent Dosage
It is essential to evaluate the effect of contact time required to reach equilibrium for designing batch adsorption experiments. Therefore the effect of contact time on adsorption of MG dye was investigated. The uptake of MG dye as a function of contact time is shown in Fig. 2. As illustrated in Fig. 2, adsorption of MG dye increased with increase in contact time up to 30 min. Further increase in contact time did not enhance the MG dye adsorption process. The adsorption process attained equilibrium at 45 min. The fast adsorption rate at the initial stage may be explained by the availability in the number of active binding sites on the OPFAC surface. Similar findings for MG dye adsorption onto other natural adsorbents have been reported by other investigators.31-33

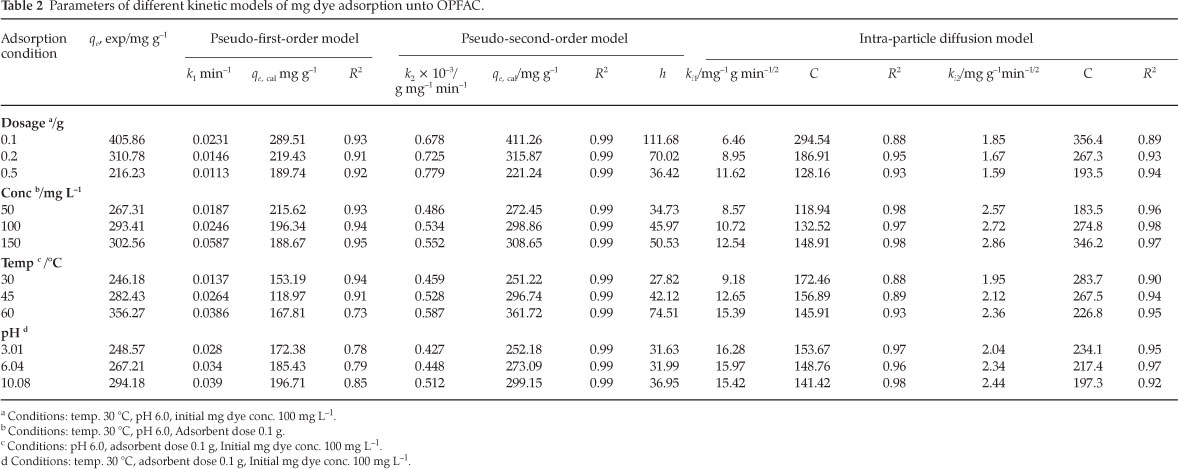
The effect of contact time on the amount of MG dye adsorbed at different adsorbent dosage is also shown in Fig. 2. It is obvious that there was a rapid uptake of MG dye within the first 30 min. Thereafter, the adsorption rate slows down gradually and no further adsorption was observed beyond 45 minutes. The initial rate of sorption h is reduced from 111.68 to 36.42 mg g-1 min-1 when adsorbent dosage is increased from 0.1 to 0.5 g (Table 2)Table 2).
3.3. Effect of Initial MG Dye Concentration and Solution Temperature on Adsorption
The rate of adsorption is a function of the initial concentration of the adsorbate, which makes it an important factor to be considered for effective adsorption. The effect of adsorption at different initial concentrations of MG dye onto OPFAC is presented in Fig. 3. The result indicates that the actual amount of MG dye adsorbed per unit mass of OPFAC increased with increase in the initial MG dye concentration. This is due to the increased driving force of the concentration gradient as the initial dye concentration increases. The unit adsorption for MG dye increased from 267.31 to 302.56 mg g-1 as the MG concentration increased from 50-150 mg l-1.
The effect of temperature on MG dye adsorption uptake, qe (mg g-1) by OPFAC was investigated at various initial concentrations (50-150 mg L-1) and the results obtained are shown in Fig. 4. The MG dye adsorption uptake was found to increase with increasing solution temperature from 30 to 60 °C at all initial concentrations, indicating the endothermic nature of the adsorption reaction (Table 2). Likewise, the initial rate of sorption, h,isin-creased from 27.82 to 74.51 mg g-1 min-1 when the temperature is increased from 30 to 60 °C (Table 2). This may be as a result of increase in the mobility of the MG dye with increasing temperature whereby a larger number of MG dye molecules acquire sufficient energy to undergo interaction with active sites at the surface. Besides, it might also be due to the increase in chemical interactions between the adsorbate and surface functional groups of OPFAC.34 A similar trend was reported for the adsorption of MG dye on treated ginger waste and Tuncbilek lignite-based activated carbon.33,35

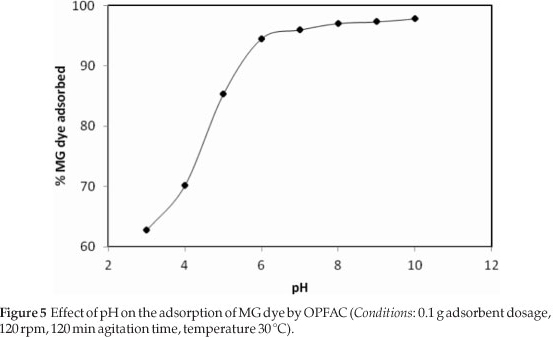
3.4. Effect of pH on MG Dye Adsorption
The pH of an aqueous solution is an important monitoring parameter in dye adsorption, as it affects the surface charge of the adsorbent material and the degree of ionization of the dye molecule.36,37 The effect of pH on the adsorption of MG dye onto OPFAC was studied in the pH range of 3.0-10.0. The percentage removal of the MG dye molecule as a function of pH is shown in Fig. 5. The removal of MG dye by OPFAC was noted to increase with an increase in pH of the dye solution, appreciably up to pH 6.0. A further increase in dye sorption between pH 6.0 and 10 was negligible. MG is a cationic dye, which exists in aqueous solution in the form of positively charged ions. As a charged species, the degree of its adsorption onto the OPFAC surface is primarily influenced by the surface charge on OPFAC, which in turn is influenced by the solution pH. The zero point charge was found to occur at pH 2.4, meaning that the OPFAC surface has a positive charge in solution up to pH 2.4 and a negative charge above this pH (Fig. 6). Oxygen functional groups are important characteristics of activated carbon because they determine the surface properties of such carbons and hence their quality as ion exchangers, adsorbents, catalysts, and catalyst supports.38 The oxygen-containing functional group content with various acidic groups (carboxyl, lactonic, and phenolic) as well as, the total amount of the basic groups determined by Boehm titration are presented in Table 3. The content of acidic groups is much higher than those of basic groups. This is consistent with a value of pHpzc 2.4 showing dominance of acidic groups. At low pH values, the protonation of the functional groups present on OPFAC surface easily takes place thereby restricting the approach of positively charged MG dye cations to the surface of OPFAC resulting in low adsorption of MG dye in acidic solution. With decrease in acidity of the solution as pH increases, the functional groups on the adsorbent surface become de-protonated resulting in an increase in the negative charge density on the adsorbent surface facilitating the binding of MG dye cations causing an increase in dye uptake. Similar observations have been reported for sorption of MG onto degreased coffee bean.39


3.5. Adsorption Kinetics
3.5.1. The Pseudo-first-order Kinetic Model

where qe and qt are the adsorption capacities at equilibrium and at time t, respectively (mg g-1). ki is the rate constant for pseudo-first-order adsorption (min-1). A plot of ln (qe -qt) against t at various concentrations and temperatures resulted in linear graphs with negative slopes at all temperature. k1 and qe are calculated from the slopes and intercepts, respectively (figure not shown). Although, the correlation coefficients (R2) were high but comparison of the qe, cat. to the qe, exp., the values do not agree (Table 2). Therefore the adsorption of MG dye onto OPFAC does not follow the pseudo-first-order kinetics.
3.5.2. The Pseudo-second-order Kinetic Model
The pseudo-second-order kinetic equation is expressed as41:

where k2 is the rate constant of pseudo-second-order adsorption (gmg-1 min-1). Forthe boundaryconditions t =0tot = t and qt =0toqt = qt, the integrated form of the equation becomes

Rearranging this equation, we have a linear form:

If the initial adsorption rate, h (mg g–1 min–1) is

Plots of t/qt vs. t gave linear graphs from which qe and k2 were estimated from the slopes and intercepts of the plot (figure not shown) for temperatures 30-60 °C. The R2 values were as high as 0.99 and there was good agreement between qe cal and qe exp data obtained (Table 2). The good agreement shows that the pseudo-second-order kinetic equation fits the adsorption data well.
3.6. Adsorption Isotherms
3.6.1. Langmuir Isotherm Model The linearized form of the Langmuir adsorption model is expressed as42:

where Ce is the dye concentration in the solution at equilibrium (mg L-1), qe is the dye concentration on the adsorbent at equilib- rium (mg g-1), qo is the monolayer adsorption capacity of adsorbent (mg g-1) and b is the Langmuir adsorption constant (L mg4). A plot of Ce/qe against Ce gave a straight line with slope 1/qo and an intercept of 1/qob (figure not shown). The R2 values of Langmuir isotherm when compared with Freundlich isotherm indicate that the adsorption of the MG dye onto OPFAC fits the Langmuir isotherm well. Values of qo and b are calculated and reported in Table 4. The value of qo obtained was compared with those from other adsorbents (Table 5). To confirm the favourableness of the process, the dimensionless equilibrium parameter (RL) defined by equation (9) was used


where Co is the highest initial dye concentration in solution, is used to confirm the favourableness of the adsorption process, that is, (0 < RL< 1) favourable, RL = 1 linear, RL = 0 irreversible or RL > 1 unfavourable.42 The values of RL reported in Table 4 obtained at various temperatures were less than one, indicating that the adsorption of MG dye onto OPFAC is favourable.
3.6.2. Freundlich Isotherm Model
This assumes heterogeneous surface energies, in which the energy term in the Langmuir isotherm varies as a function ofthe surface coverage. The linearized form of the Freundlich model is represented by:43

where qe is the amount of MG dye adsorbed at equilibrium (mg g-1), Ce is the equilibrium concentration of the adsorbate (mg L-1); kf and n are constants incorporating the factors affecting the adsorption capacity and the degree of non-linearity between the solute concentration in the solution and the amount adsorbed at equilibrium, respectively. Plots of log qe vs. log Ce gave linear graphs (figure not shown) with high R2. Comparing the R2 values with the ones obtained from Langmuir Isotherms, the adsorption data does not fits the Freundlich isotherm well (Table 4). Values of kf and n obtained from the slopes and intercepts of the graph are reported in Table 4, it shows the heterogeneity of the material as well the possibility of multilayer adsorption of MG dye through the percolation process, the values of n greater than one indicates that the adsorption is favourable.
3.7. Intra-particle Diffusion Model
Adsorption is a multi-step process involving transport of solute molecules from the aqueous phase to the surface of the solid particles. This is followed by the diffusion of the solute molecules into the interior part of the pores, which is likely to be a slow process; therefore, it is called the rate determining step.44 The possibility of intraparticle diffusion of MG dye onto the OPFAC was investigated by using the intraparticle diffusion model, which is commonly expressed as Eq. (11):

where qt is the amount of dye adsorbed (mg g-1) at time t, and kip (mg g-1)mgg-1 min1/2 is the rate constant for intraparticle diffusion. The values ofqtcorrelated linearly with values of t1/2 (Fig. 7) and the rate constant kip was evaluated from the slope of regression line. The value of C gives an idea of the thickness of boundary layer, the larger the intercept the greater the boundary layer effect. From the plots of qt against t1/2 at various initial MG dye concentrations, multi-linear profiles were observed (Fig. 7) indicatingthat intra-particle diffusion plays a significantrole but is not the only rate-controlling step. The first and sharper portion is attributed to the boundary layer diffusion of MG dye molecules while the second portion corresponds to the gradual adsorption stage, where intra-particle diffusion was the rate-limiting step. The slope of the second linear portion of the plotwas defined as the intra-particle diffusion parameter ki2. The corresponding model fitting parameters under different conditions are reported in Table 2. The observed values of ki2are lower than ki1, indicating that intra-particle diffusion controls the adsorption rate mainly. However, external mass transfer resistance cannot be neglected although this resistance is only significant at the initial period of time.

3.8. Thermodynamic Studies
Thermodynamic parameters; ΔG°, ΔΗ°, and ΔS°, were also determined to investigate the feasibility, spontaneity and the nature of the reaction. This was achieved by using the following equations.
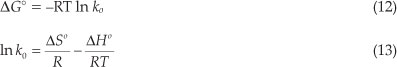
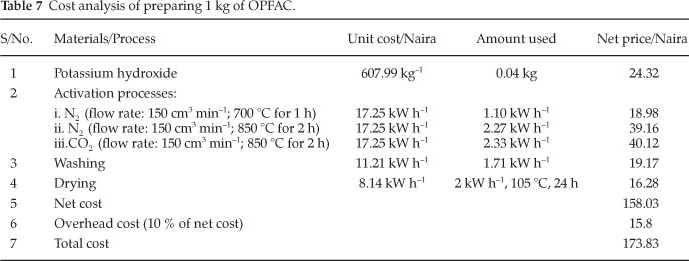
where ko is the standard thermodynamic equilibrium constant, T is the temperature in Kelvin and R is the gas constant. A plot of ln ko against 1/T gave linear plots (Fig. 8) from which ΔΗ ° and ΔS° values were obtained from the slopes and intercepts, respectively. Thermodynamic parameters at various temperatures are reported in Table 6. The negative values of ΔG° indicate that the adsorption of MG dye onto OPFAC is spontaneous and thermo-dynamically favourable. Moreover, when the temperature increases from 30 to 60 °C, ΔG° changes from -36.87 to -42.39 kJ mol-1, suggesting that adsorption is more spontaneous at higher temperature. The positive value of ΔH° (18.47 kJ mol1) indicates that the process is endothermic in nature, which is supported by the increase in the adsorption capacity of OPFAC for MG dye with increasing temperature as observed from Table 4. Moreover, the positive value of ΔS° (182.48 J K-1 mol-1) suggests that there was increased randomness at the solid-liquid interface during the adsorption of MG dye onto OPFAC.

The pseudo-second-order kinetic model fits well to the adsorption process of MG dye onto OPFAC. Accordingly, the rate constants (k2) of the pseudo-second-order model are adopted to calculate the activation energy of the adsorption process by using the Arrhenius equation:45

where, k2, A, Ea, R and T are the rate constant of the pseudo-second-order model, the Arrhenius factor, activation energy, gas constant and temperature, respectively. The activation energy was determined from the slope of the plot of lnk2 vs. 1/T (figure not shown). The activation energy (Ea) in this study is 24.83 kJ mol-1, further confirming that the adsorption process is mainly physical (Table 6). Therefore, ΔG°, ΔΗ° and Ea suggest that the adsorption of MG dye onto OPFAC is mainly a physisorption process.
3.9. Cost Analysis
Adsorbent cost is an important factor when it is to be used for industrial applications. The overall cost of the adsorbent material is governed by several factors which include its availability (natural, industrial/agricultural/domestic wastes or byproducts or synthesized products), the processing required and reuse.46 Oil palm fruit fibre is readily available in abundance as waste from oil palm mills at no cost. In this work, it was chemically activated with potassium hydroxide as stated in the experimental section. However, the activation process adds to the cost of preparing the adsorbent. An estimated cost analysis of preparing 1 kg of OPFAC in Nigeria is 174 Naira (1.16 USD) (Table 7). The most popular commercially available adsorbent nowadays for the removal of cationic, basic and reactive dyes is activated carbon. In Nigeria, the cheapest variety of activated carbon costs 3500 Naira per kg (23.33 USD). Comparing the cost, OPFAC is 20 times cheaper than the commercially available activated carbon.
4. Conclusions
Optimum adsorption of MG dye on OPFAC was observed in the pH range 6.0-9.0. The adsorption data fitted well into Langmuir isotherm adsorption equilibrium model with a maximum adsorption capacity of 356.27 mg g-1. The separation factor RL lies in between 0 and 1, indicating a favourable adsorption. Kinetic study shows that pseudo-second-order kinetic model fitted the adsorption process best. Both boundary layer diffusion and intraparticle diffusion mechanisms take place in the adsorption process with the latter controlling the process mainly. The negative value of aG° indicated the spontaneity of the process. The positive values of ΔΗ° and ΔS° indicates that the process is endothermic showing increased randomness of the adsorbate molecules on the adsorbent. Cost analysis of OPFAC revealed that it is cheaper than the commercially available activated carbon. This study has shown that OPFAC can be used as an effective and low-cost adsorbent in the removal of MG dye from wastewaters.
Acknowledgements
The one-year post-doctoral fellowship jointly awarded by USM-TWAS to the author (FR Number: 3240223483 in Year 2009) of the Department of Pure and Applied Chemistry, Ladoke Akintola University of Technology, P.M.B 4000, Ogbomoso, Oyo State. Nigeria and the 12-month study leave granted to him by his home institution to honour this fellowship are both acknowledged.
References
1 L. Wang, J. Zhang, R. Zhao, C. Li, Y. Li, and C. Zhang, Desal., 2010, 254, 68-74. [ Links ]
2 T. Akar, S. Celik and S.T. Akar, Chem. Eng. J., 2010, 160, 466472. [ Links ]
3 S.T. Akar and R. Uysal, Chem. Eng. J., 2010, 162, 591-598. [ Links ]
4 B.E. Tastan, S. Ertugrul and G. Donmez, Bioresour. Technol., 2010, 101, 870-876. [ Links ]
5 S.T. Akar, A.S. Özcan, T. Akar, A. Özcan and Z. Kaynak, Desal., 2009, 249, 757-761. [ Links ]
6 I. Kiran, S. Ilhan, N. Caner, C.F. Iscen and Z. Yildiz, Desal., 2009, 249, 273-278. [ Links ]
7 L.D. Fiorentina, D.E.G. Triguerosa, A.N. Módenes, F.R. Espinoza-Quinones, N.C., Pereiraa, S.T.D. Barrosa and O.A.A. Santosa, Chem. Eng. J., 2010, 163, 68-77. [ Links ]
8 H.B. Senturk, D. Ozdes and C. Duran, Desal., 2010, 252, 81-87. [ Links ]
9 G. Crini, H.N. Peindy, F. Gimbert and C. Robert, Sep. Purif. Technol., 2007, 53, 97-110. [ Links ]
10 W.T. Tsai and H.R. Chen, J. Hazard. Mater., 2010, 175, 844-849. [ Links ]
11 VK. Garg, R. Kumar and R. Gupta, Dyes Pigments, 2004, 62, 1-10. [ Links ]
12 P. Saha, S. Chowdhury, S. Gupta, I. Kumar and R. Kumar, Clean: Soil Air Water, 2010, 38, 437-445. [ Links ]
13 A. Srivastava, R. Sinha and D. Roy, Aquat. Toxicol., 2004, 66, 319-329. [ Links ]
14 S. Chowdhury and P. Saha, Chem. Eng. J., 2010, 164, 168-177. [ Links ]
15 Y. Guo and D.A. Rockstraw, Micropor. Mesopor. Mater., 2007, 100, 12-19. [ Links ]
16 D.C.S. Azevedo, J.C.S. Araújo, M.B. Neto, A.E.B. Torres, E.F. Jaguaribe and C.L. Cavalcante, Micropor. Mesopor. Mater., 2007, 100, 361-364. [ Links ]
17 F. Suárez-García, A. Martínez-Alonso and J.M.D. Tascon, J. Anal. Appl. Pyrol., 2002, 62, 93-109. [ Links ]
18 O.S. Bello, A.I. Adeogun, C.J. Ajaelu, and E.O. Fehintola. Chem. Ecol., 2008, 24, 285-295. [ Links ]
19 O.S. Bello, M.A. Oladipo, M. Abdul Hameed, and A.O. Popoola. Maced. J. Chem. Chem. Eng., 2010, 29, 77-85. [ Links ]
20 O.S. Bello, and M.A. Ahmad. Toxicol. & Environ. Chem., 2011, 93, 1298-1308. [ Links ]
21 O.S. Bello, A.T. Fatona, F.S. Falaye, O.M. Osuolale and V.O. Njoku, Environ. Eng. Sci., 2012, 29, 186-194. [ Links ]
22 O.S. Bello, and M.A. Ahmad, Chem. Ecol., 2011, 27, 481492. [ Links ]
23 H.P. Boehm, Carbon, 2002, 40, 145-149. [ Links ]
24 P. Nowicki, H. Wachowska and R. Pietrzak, J. Hazard. Mater., 2010, 181, 1088-1094. [ Links ]
25 G.G. Stavropoulos and A.A. Zabaniotou, Micropor. Mesopor. Mater., 2005, 82, 79-85. [ Links ]
26 R.L. Tseng, S.K. Tseng and F.C. Wu, Colloids Surf. A, 2006, 279, 69-78. [ Links ]
27 R.M. Suzuki, A.D. Andrade, J.C. Sousa and M.C. Rollemberg, Bioresour. Technol., 2007, 98, 1985-1991. [ Links ]
28 B.H. Hameed and F.B.M. Daud. Chem. Eng. J., 2008, 139, 48-55. [ Links ]
29 N.K. Amin. J. Hazard. Mater., 2008, 165, 52-62. [ Links ]
30 B.H. Hameed and A.A. Ahmad, J. Hazard. Mater., 2009, 164, 870-875. [ Links ]
31 O. Hamdaoui, F. Saoudi, M. Chiha and E. Naffrechoux, Chem. Eng. J., 2008, 143, 73-84. [ Links ]
32 V.K. Garg, R. Gupta, A.B. Yadav and R. Kumar, Bioresour. Technol., 2003, 89, 121-124. [ Links ]
33 R. Ahmad, and R Kumar, J. Environ. Manage., 2010, 91, 1032-1038. [ Links ]
34 V Marinovic, M. Ristic and M. Dostanic, J. Hazard. Mater. B, 2005, 117, 121-128. [ Links ]
35 Y. Onal, C. Akmil-Basar, D. Eren, C. Sanci-Ozdemir and T. Depci, J. Hazard. Mater. B, 2006, 128, 150-157. [ Links ]
36 VS. Mungapati, V. Yarramuthi, S.K. Nadavala, S.R. Alla and K. Abburi, Chem. Eng. J., 2010, 157, 357-365. [ Links ]
37 A. Saeed, M. Sharifand M. Iqbal, J. Hazard. Mater., 2010, 179, 564-572. [ Links ]
38 T. Budinova, E. Ekinci, F. Yardim, A. Grimm, E. Björnbom, V. Minkova and M. Goranova, Fuel Process. Technol., 2006, 87, 899- 905. [ Links ]
39 M.-H. Baek, C.O. Ijagbemi, O. Se-Jin and D.S. Kim, J. Hazard. Mater., 2010, 176, 820-828. [ Links ]
40 S. Lagergren and B. K. Svenska, Band., 1893, 24, 1-13. [ Links ]
41 Y.S. Ho and G. McKay, Proc. Biochem. 1999, 34, 451-465. [ Links ]
42 I. Langmuir, J. Amer. Chem. Soc., 1916, 38, 2221-2295. [ Links ]
43 H.M.F. Freundlich, Zeitchrift Phys. Chem., 1906, 57, 385-470. [ Links ]
44 W.J. Weber and J.C. Morris, J. Sanity Eng. Div. Am. Soc. Civil Eng., 1963, 89, 31-59. [ Links ]
45 M. Dŏgan and M. Alkan. Chemosphere, 2003, 50, 517-528. [ Links ]
46 S. Chowdhury, R. Mishra, P. Saha and P. Kushwaha, Desal., 2010, 265, 159-168. [ Links ]
47 K.V. Kumar, Dyes Pigments, 2007, 74, 595-597. [ Links ]
48 S. Wang and E. Ariyanto, J. Colloid Interface Sci., 2007, 314, 25-31. [ Links ]
49 S.S. Tahir and N. Rauf, Chemosphere, 2006, 63, 1842-1848. [ Links ]
50 G. Crini, H.N. Peindy, F. Gimbert and C. Robert, Sep. Purif. Technol. 2007, 53, 97-110. [ Links ]
51 K. Porkodi, K. and Vasanth Kumar, J. Hazard. Mater., 2007, 143, 311-327. [ Links ]
52 J. Zhang, Y. Li, C. Zhang and Y. Jing, J. Hazard. Mater., 2008, 150, 774-782. [ Links ]
53 VK. Gupta, S.K. Srivastava and D. Mohan, Ind. Eng. Chem. Res. 1997, 36, 2207-2218. [ Links ]
54 A. Mittal, J. Hazard. Mater. 2006, 133, 196-202. [ Links ]
55 I.D. Mall, VC. Srivastava, N.K. Agarwal and I.M. Mishra, Colloid. Surf. A, 2005, 264, 17-28. [ Links ]
Received 23 January 2012
Revised 22 November 2012
Accepted 14 December 2012

