


Services on Demand
Article
 English (pdf)
 Article in xml format
 Article references
Indicators

Related links
-
 Cited by Google
 -
 Similars in Google
Share

 Permalink
South African Journal of Animal Science
On-line version ISSN 2221-4062
Print version ISSN 0375-1589
S. Afr. j. anim. sci. vol.53 n.1 Pretoria 2023
http://dx.doi.org/10.4314/sajas.v53i1.04
Principal Component Analysis of morphometric traits and body indices in South African Kalahari Red goats
T.L. Tyasi#; O. Tada
School of Agricultural and Environmental Sciences, Department of Agricultural Economics and Animal Production, University of Limpopo, Private Bag X1106, Sovenga 0727, Limpopo, South Africa
ABSTRACT
Principal component analysis (PCA) is a vital statistical technique for defining the morphological structure of livestock but has not been used in South African Kalahari Red goats. Thirteen morphometric traits and eleven body indices from two hundred and ninety-six (296) South African Kalahari Red goats (269 does and 27 bucks) aged 2-3 years were used to define morphological structure using PCA. The coefficient of determination (R2), root mean square error (RMSE), Akaike's information criterion (AIC), Mallows' Cp-statistic (Cp), and coefficient of variation (CV) were used to select the best fit model. Body weight was correlated with all morphometric traits in both sexes. The first two principal components explained 87.31% of the variation in measurements from male goats and 62.32% of the trait variation in the females. The inclusion of head length, body length, canon circumference, rump length, rump width, body condition score, wither height, and rump height increased the accuracy to 98% with smaller RMSE (2.42), AIC (55.35), Cp (10.00), and CV (3.98), and the use of PC1 and PC2 included 94% of the variation (RMSE, 3.62; AIC, 72.26; Cp, 3.00; CV, 5.94 in males). In females, the inclusion of all morphometric traits included 87% of the variation (RMSE, 2.93; AIC, 590.63; Cp, 13.00; CV 5.87). The use of PC1 and PC2 included 82% of the variation (RMSE, 3.41; AIC, 663.60; Cp, 3.00; CV, 6.84). PCA can therefore be used in breeding programs to define the morphological structure of South African Kalahari Red goats with a severe reduction in the number of morphometric traits to be recorded.
Keywords: Body weight, body indices, morphometric traits, principal component analysis
Introduction
South Africa contributes to almost 10% of the southern African goat population (Mohlatlole et al., 2015) with approximately 5.62 million goats distributed throughout nine provinces. The Limpopo province carries 17% of the national flock size and is ranked second after the Eastern Cape Province with 39% (DAFF, 2016). The commercial meat goat industry, consisting of the Boer, Savannah, and the Kalahari Red breeds makes up 1.3 million goats (23%) (Mataveia, 2021). The Kalahari Red is a meat-type goat breed that originated in South Africa through rigorous crossing of Landraces and Red Boer goats from the 1970s to mid-1990s (Pienaar, 2012). This hardy breed is characterized by unique disease and parasite-resistance traits, making it excel under diverse climates, predominantly hot subtropical environments. Several reports indicated these large-framed goats can breed throughout the year yielding a sizeable kidding of twins and triplets three times every two years. With a life expectancy of 8-15 years and an average wither height of 0.76 m, the mature doe, buck, and 6-month kid weigh 75 kg, 115 kg, and 30 kg, respectively (Pienaar, 2012; Snyman, 2014; Ames, 2020). There is a growing concern regarding the knowledge gap in stud Kalahari Red goats pertaining to morphometric traits. Therefore, the current work was undertaken to define the morphological structure of South African Kalahari Red goats using principal component analysis (PCA). The information from the current study can be used to inform conservation and sustainable utilization of the South African Kalahari Red goat genetic resources with the proper use of morphometric traits.
Materials and Methods
All procedures were performed following the standards and protocols set by the University of Limpopo Animal Research Ethics Committee (ULAREC) project number: AREC/09/2021: IR.
The study was conducted at Plaas Zuurfontein farm in Polokwane Local Municipality, Limpopo Province of South Africa. The area has a savannah biome with mixed grasslands, shrubs, and trees. This bushveld receives annual rainfall of more than 600 mm with a temperature range of 16-28.1 °C in summer and 7-21 °C in winter (Shabalala et al., 2019).
The observational study was conducted using 296 stud Kalahari Red goats (269 does and 27 bucks) aged 1 to 2 years. The does selected in the study were in first parity and non-pregnant. The Kalahari Red goat is an efficient breed because it feeds on plants and grass and requires low management and care (Omotosho et al., 2020). The animals were managed under an extensive farming system in which they were allowed to go out in the morning to graze and returned to their rotational camps in the afternoon. Winter mineral supplements were offered accordingly, and monthly dipping occurred. Goats were checked for health disorders twice a day, in the morning before they left for grazing and in the afternoon when they returned into their camps. Clean water was provided ad libitum at watering points in the camps. The animals were dosed and dewormed at least twice a year to controlling internal and external parasites, in addition to the standard husbandry practices of housing and vaccinations. A controlled mating at a ratio of 1:20 was implemented naturally with ear-tags used for identification.
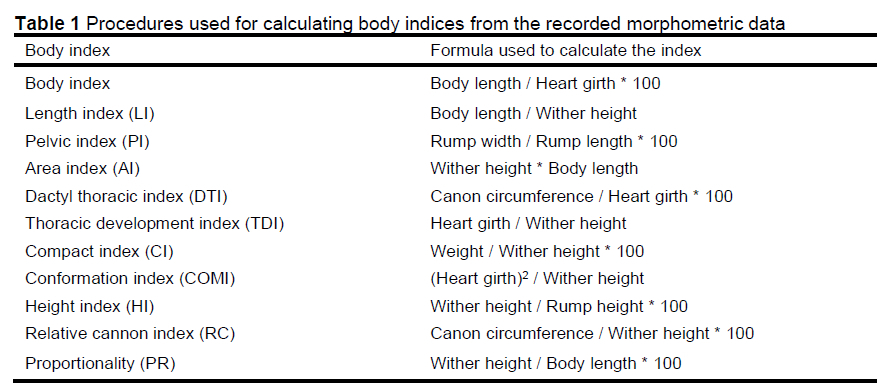
Body weight and morphometric traits were measured on 296 Kalahari Red goats as described by the FAO (2012). Body weight was measured in kilograms using a scale, while morphometric traits, including rump height (RH), body length (BL), rump width (RW), head width (HW), rump length (RL), heart girth (HG), ear length (EL), head length (HL), sternum height (SH), canon circumference (CC), and wither height (WH) were measured in centimetres using a tailor's measuring tape. Eleven body indices (Table 1) were computed from morphometric traits as described by Birara et al. (2021). Body condition score (BCS) was collected as described by Zewdu et al. (2009). Briefly, BCS was assessed using a five-point scale (1 = very thin, 2 = thin, 3 = average, 4 = fat and 5 = very fat).
Statistical Package for the Social Sciences (IBM SPSS, IBM Corp., Armonk, New York, USA; 2019, version 26) was used for data analysis, with a probability measure of 5% used for significance. Arithmetic means and standard errors were estimated for the recorded morphometric traits and body indices. A t-test was used to test the difference between males and females at P =0.05. Pearson's correlation among the morphometric traits and the body indices were estimated. These analyses were followed by a principal component analysis to reduce the dimensionality of the morphometric data. Finally, stepwise regression was used to develop equations to predict LW from the morphometric traits and from the principal components. Goodness-of-fit of the regression models was assessed using the coefficient of determination (R2), mean root square error (RMSE), Akaike's information criterion (AIC), Mallows' Cp-statistic (Cp), and the residual coefficient of variation (CV), as described by Mathapo et al. (2022). The statistical analyses were conducted separately using the data from males and from females.
Results
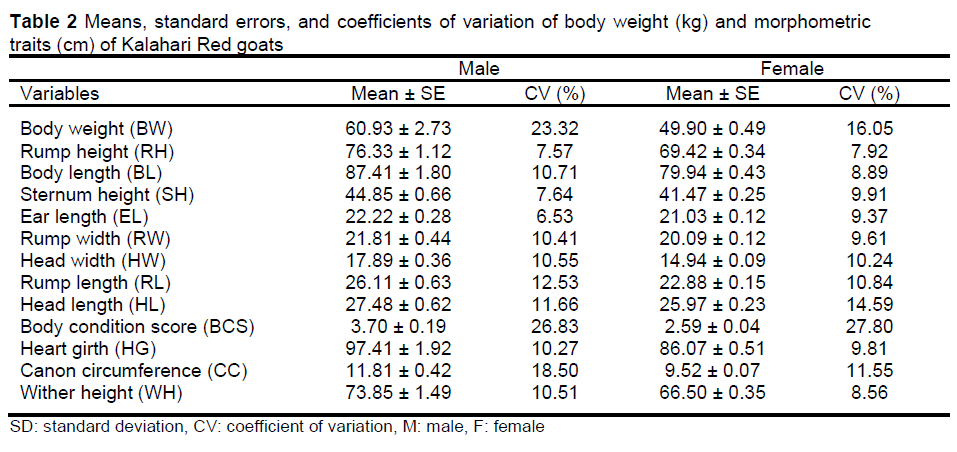
Descriptive statistics for the measured morphometric traits are presented in Table 2. Bucks were consistently larger than the does and had higher mean values than the does (P <0.05). The CV ranged from 6.53% to 26.83% in bucks and from 7.92% to 27.80% in does.
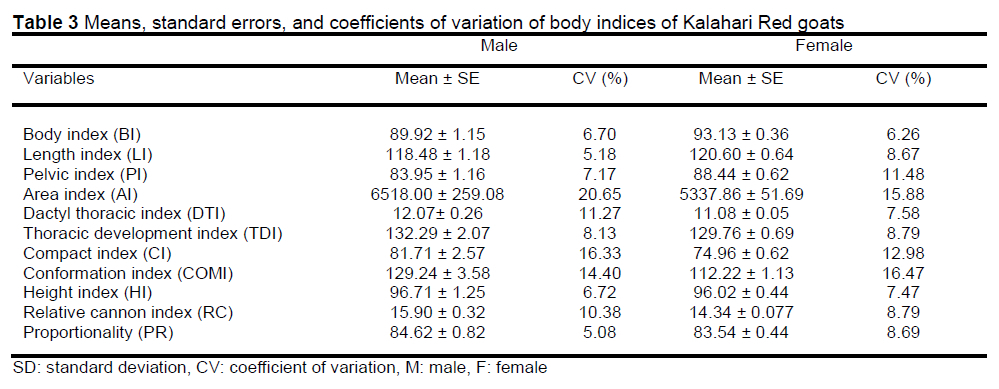
Bucks had higher mean values in area, dactyl thoracic, conformation, relative cannon, and compact indices compared to does (P <0.05) (Table 3). Females had higher mean values of body and pelvic indices compared to bucks (P <0.05). Finally, there were no differences between the sexes for the length index, proportionality, height, and thoracic development indices (P >0.05).
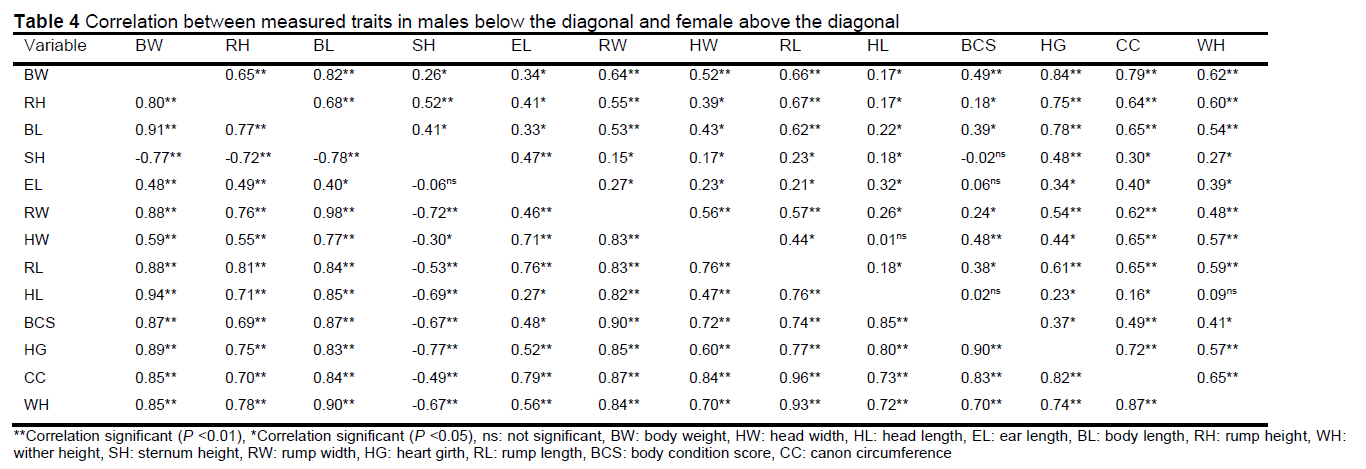
Phenotypic correlations between body weight and morphometric traits are presented in Table 4. The results indicate that BW had a strong, positive correlation (P <0.01) with all the morphometric traits except SH, which was negatively correlated (P <0.01) with BW in bucks. In does, BW had a strong, positive correlation (P <0.01) with RH, BL, RW, HW, RL, BCS, HG, CC, and WH with a positive correlation (P <0.05) with SH, EL, and HL.
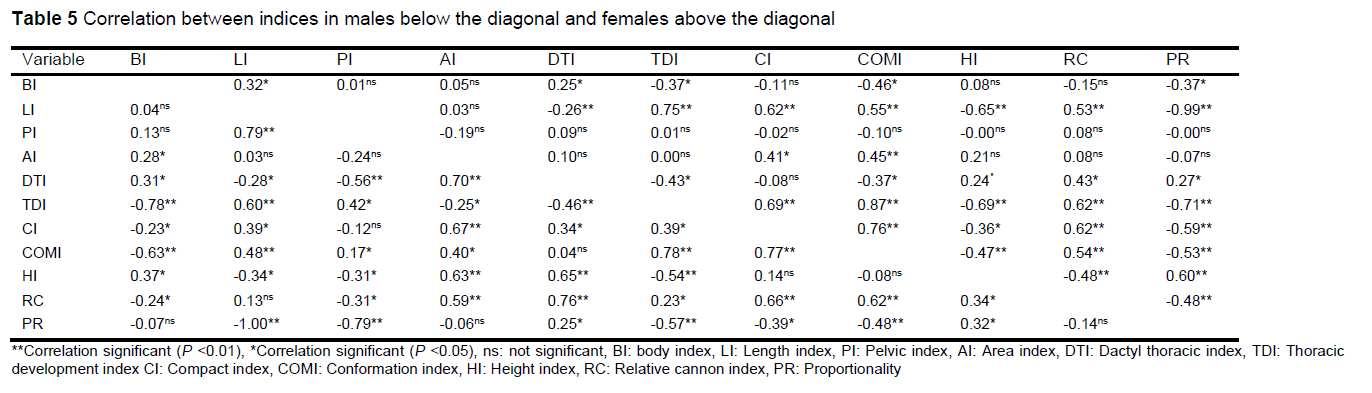
Correlations between the calculated body indices in the current study are presented in Table 5. In bucks, the results showed that BI had a strong negative correlation (P <0.01) with TDI and COMI; a positive correlation (P <0.05) with AI, DTI, and HI; and no correlation (P >0.05) with LI, PI, and PR. In does, the findings indicated that BI had a positive correlation (P <0.05) with LI, DTI, TDI, COMI, and PR but no correlation (P >0.05) with PI, AI, CI, HI, and RC.
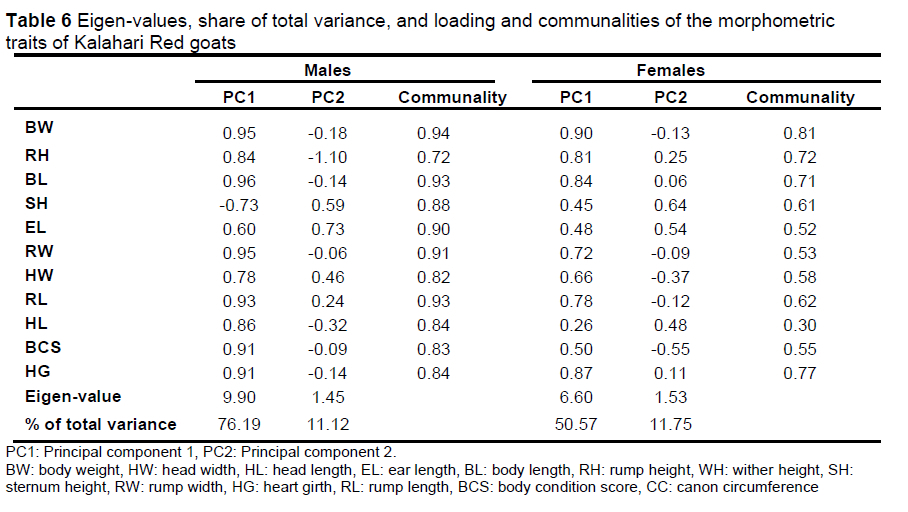
The predicted factor loading extracted by factor analysis, Eigen-values and variation explained by each factor are presented in Table 6. The PCA results extracted only two components in both sexes (males and females) Kalahari Red goats. The extracted two components in the case of male Kalahari Red goats accounted 87.31% of the variance. The first component explained 76.19% of variance and was presented by high loadings for BW, BL, RW, RL, BCS and HG. While, in the second factor accounted 11.12% of variance presenting high positive loadings for EL. In female Kalahari Red goats, the two extracted principal components contributed 62.32% of the variance in the data, thereby; the first component was enough to explain 50.57% of the total variance. Moreover, the second component explained 11.75% of variance and presented high positive loading for SH. The communality for male Kalahari Red goats ranged from 0.72 for RH to 0.94 for BW. In female Kalahari Red goats, the communality ranged from 0.30 for HL to 0.81 for BW. The communality after extraction gives the common variance that is shared amongst variables.
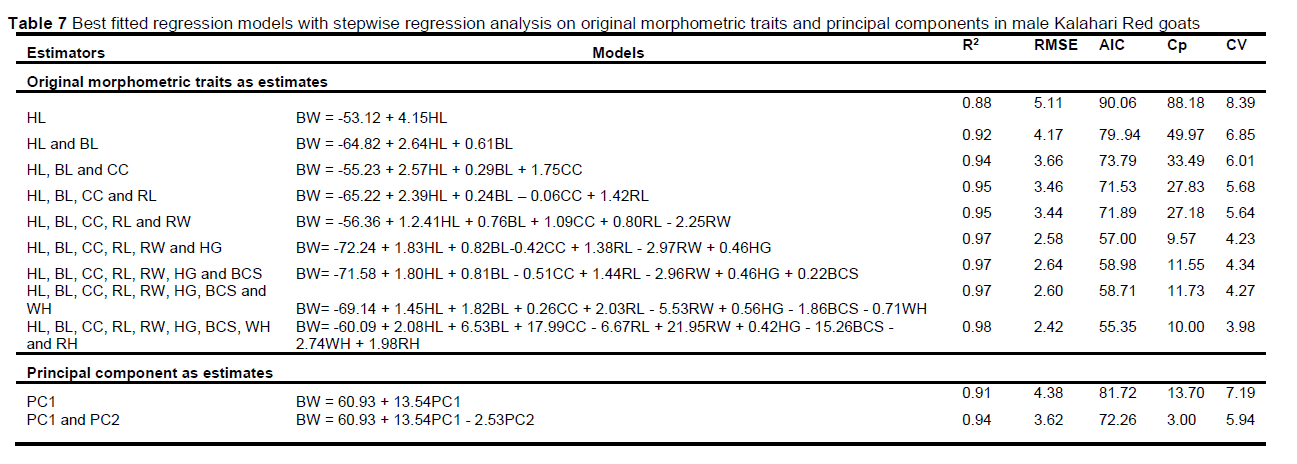
A stepwise regression was conducted to fit the best models for estimation of body weight in case of male Kalahari red goats (Table 7). The results indicated that 88% of the variation in body weight of bucks was accounted for by HL. The inclusion of HL, BL, CC, RL, RW, HG, BCS, WH, and RH increased the accuracy to 98% with a smaller RMSE (2.42), AIC (55.35), and CV (3.98). The use of PC1 as a single predictor explained 91% of the variation; inclusion of PC2 improved the accuracy to include 94% of the variation with a RMSE of 3.62, AIC of 72.26, and CV of 5.94.
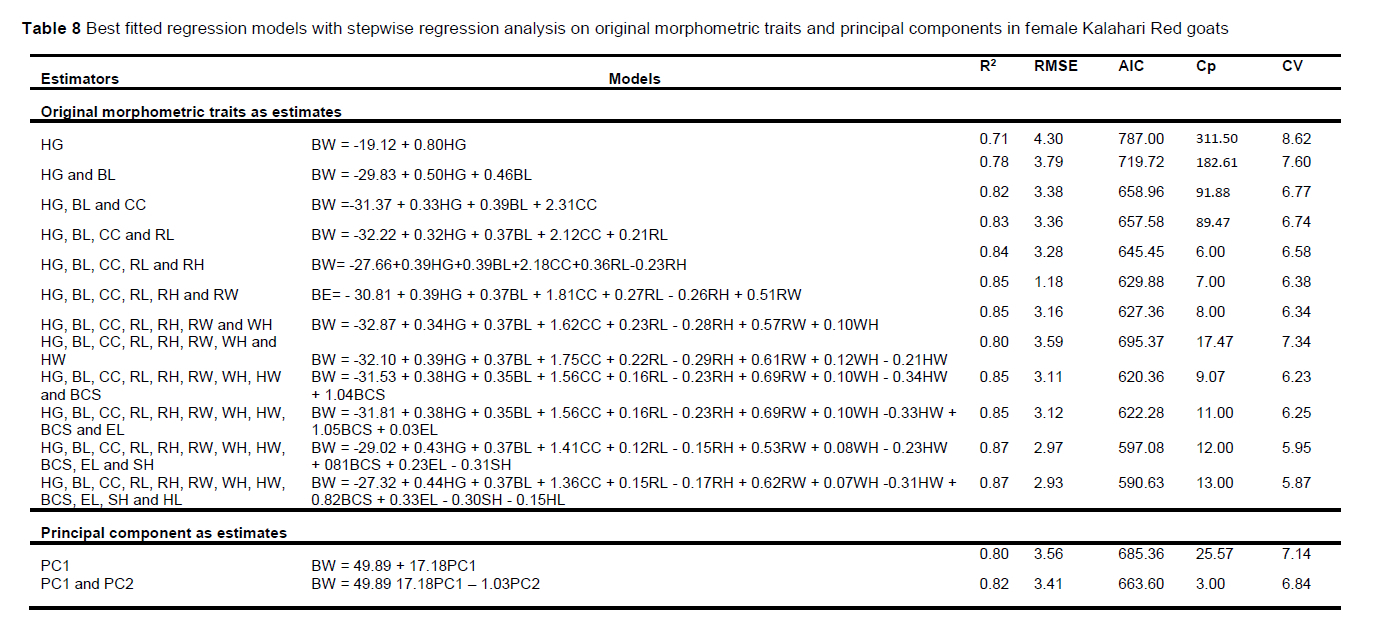
A stepwise regression was conducted to fit the best models for estimation of body weight in female Kalahari Red goats (Table 8). The findings indicated that 71% of the variation in body weight of does was accounted for by the HG. The inclusion of all morphometric traits increased the accuracy of variation to 87% with a smaller RMSE of 2.93, AIC of 590.63, and CV of 5.87. The use of PC1 as a single estimator explained 80% of the variation and addition of PC2 enhanced the accuracy to include 82% of the variation with the lowest RMSE (3.41), AIC (663.60), and CV (6.84).
Discussion
Morphometric traits are important in expanding the understanding of unidentified populations and are vital in the identification and classification of breeds (Adamu et al., 2020; Herrera-Cáceres & Hernández-Corredor, 2022). The current study firstly determined the association between body weight and morphometric traits using Pearson's correlation coefficients. The outcomes showed that body weight had a strong positive association with all the measured traits, except with SH, which had a negative correlation with body weight in bucks; in does, body weight had a strong, positive correlation with rump height, body length, rump width, head width, rump length, body condition score, heart girth, canon circumference, and wither height, while showed the positive significant association with sternum height, ear length, and head length. The findings of the study concur with those of Adamu et al. (2020) in Red Sokoto and Sahel goats in Maigatari Local Government Area of Jigawa State and Rashijane et al. (2021) in Boer goats in Limpopo Province, South Africa. However, the findings differ with those of Mathapo et al. (2022) in South African, non-descript indigenous goats of Lepelle-Nkumbi Local Municipality, which showed no remarkable association between body weight and heart girth, wither height, rump height, and rump length in both sexes. The differences may be due to variation in breeds. The results of the current study recommend that all the morphometric traits used in the study might be used for improvement of body weight in both male and female Kalahari Red goats, except for sternum height in males. When traits are positively associated, it means that those traits are controlled by a similar gene (Mathapo et al., 2022) The correlation results reveal that all measured morphometric trait can be useful to predict body weight of Kalahari Red goats.
The relationships between body indices revealed that thoracic development index and conformation index had a strong, negative association with body index, a positive association with area index, dactyl thoracic index and height index, and no remarkable correlation with length index, pelvic index, and proportionality in bucks. In does, the discoveries showed that body index had a positive association with all the body indices except for the pelvic, area, compact, height, and relative cannon indices. Similarly, Putra and Ilham (2019) also reported a negative association between body index and proportionality, and no significant association between body and area indices in Katjang does of Indonesia. Depison et al. (2021) discovered a positive correlation between body and dactyl thoracic and length indices, and no significant correlation with height index in Thin-Tail sheep. The findings of the current study suggest that body index can be improved effectively using body indices.
Bila and Tyasi (2022) reported that the morphological correlations did not consider the influence between the traits or how much each trait contributed to the variation in body weight. Hence, the PCA and stepwise regression were used to evaluate related morphological traits and their contribution to body weight, and to establish the best models for estimation of body weight in Kalahari Red goats, respectively. The PCA extracted two significant components for male Kalahari Red goats with a variance of 87.31%, while female Kalahari Red goats also extracted two significant components which accounted for 62.32% of the variance. Akbar et al. (2021) described two PCs in Thalli female sheep that explained a variance of 66% and Magaço and Felimone (2020) discovered that three PCs described 63% of the variation in Landim goats. The study conducted by Mokoena and Tyasi (2021) in Boer goats revealed two PCs in females with a cumulative variance of 78.31% and one PC in males with a variance of 56.83%. The regression findings revealed that the models including all the morphometric traits showed a higher accuracy of prediction and smaller RMSE, AIC, and CV in both male and female Kalahari Red goats. Therefore, the model including head length, body length, canon circumference, rump length, rump width, heart girth, body condition score, wither height, and rump height was considered to be the best-fitting regression model for the prediction of body weight in both male and female Kalahari Red goats. The use of PC1 alone as a predictor of body weight showed small accuracy of prediction, while the inclusion of PC2 increased the accuracy in both male and female Kalahari Red goats. The models involving PC1 and PC2 revealed a high accuracy of prediction and low RMSE, AIC, and CV in both male and female Kalahari Red goats. Studies conducted in Katjang does in Indonesia (Putra and Ilham, 2019), Lamdin goats in Mozambique (Mishra et al., 2017), and Burhair sheep (Sankhyan et al., 2018) reported that the use of morphological traits and principal components as predictors was effective in the prediction of body weight. The principal components identified in this study can be used in the selection process as a selection criterion for the improvement of body weight in Kalahari Red goats.
Conclusion
Correlation results in the current study indicate that body weight has a significant correlation with all morphometric traits in both sexes. Morphometric traits and body indices were used to define the morphological structure of Kalahari Red goats using principal component analysis (PCA). The extracted principal components from different morphometric traits represent the general body size and shape of the Kalahari Red goat population. It is recommended that measured morphometric traits might be used to improve body weight of the Kalahari Red goats. The study suggests that principal components might be used effectively for selection of animals based on a group of variables that are related to one another.
Acknowledgements
The authors greatly acknowledge the South African National Research Foundation (NRF) Thuthuka for financial support. The authors are also highly grateful to the Kalahari Red goat stud breeder who spared the animals for data collection.
Author's contributions
Conceptualization, TLT and OT; methodology, TLT; manuscript preparation, TLT and OT; Both authors have read and agreed to the final version of the manuscript.
Conflict of interest
The authors declare no conflict of interest for this manuscript.
References
Adamu, H., Ma'aruf, B.S., Shuaibu, A., Umar, H.A. & Maigado, A.I., 2020. Morphometric characteristics of Red Sokoto and Sahel goats in Maigatari Local Government Area of Jigawa State. Nig. J. Anim. Prod. 47(4), 15-23. http://dx.doi.org/10.51791/njap.v47i4.62 [ Links ]
Akbar, M.A., Javed, K., Faraz, A. & Waheed, A., 2021. Principal component analysis of morphometric traits explain the morphological structure of Thalli Sheep. Pak. J. Zool. 1-6. https://dx.doi.org/10.17582/journal.pjz/20200220060257 [ Links ]
Ames, M., 2020. Breed profile: Kalahari Red Goats. Backyard Goats. Available at https://backyardgoats.iamcountryside.com/magazine-previews/goat-journal-july-august-2020/ (Accessed 30 May 2022). [ Links ]
Bila, L. & Tyasi, T.L., 2022. Multivariate principal component analysis of morphological traits in Ross308 broiler chicken breed. Asian J. Agric. Biol. DOI: 10.35495/ajab.2021.03.132 [ Links ]
Birara, T., Aberra, M., Simret, B., 2021. Characterization of the indigenous goat populations of south Gonder based on their morphometric traits and body indices. Ethiop. J. Agric. Sci. 31(4), 71-87. [ Links ]
DAFF, 2016. National Livestock Statistics. Newsletter. Directorate: Statistics and Economic Analysis, Pretoria, South Africa. [ Links ]
Depison, N., Putra, W.P.B., Gushairiyantoa, G., Alwia, Y. & Suryania, H., 2021. Morphometrics characterization of Thin-Tail sheep in lowland and highland areas. Trop. Anim. Sci. J. 44(4), 386-398. https://doi.org/10.5398/tasj.2021.44.4.386 [ Links ]
FAO Food & Agricultural Organization, 2012. Phenotypic characterization of animal genetic resources. Animal Production and Health Guidelines No. 11. Rome. Accessed on August 20, 2012.http://www.gmi-mr.com/resources/sample. [ Links ]
Herrera-Cáceres, W. & Hernández-Corredor, L., 2022. Morphological characterization of the Motilona goat from Norte de Santander, Colombia. Rev. MVZ Cordoba. 27(1), e2149. https://doi.org/10.21897/rmvz.2149 [ Links ]
Magaco, F.S. & Felimone, D.E.T., 2020. Body conformation of Mozambican local goats explained by principal components analysis. Rev. Cient. Prod. Anim. 22(2), 91-95. http://dx.doi.org/10.5935/2176-4158/rcpa.v22n2p81-89 [ Links ]
Mataveia, G.A., Visser, C. & Sitoe, A., 2021, 'Smallholder Goat Production in Southern Africa: A Review', in S. Kukovics (ed.), Goat Science - Environment, Health and Economy [Working Title], Intech Open, London. 10.5772/intechopen.97792. [ Links ]
Mathapo, M.C., Mugwabana, T.J. & Tyasi, T.L., 2022. Prediction of body weight from morphological traits of South African non-descript indigenous goats of Lepelle-Nkumbi Local Municipality using different data mining algorithms. Trop. Anim. Health Prod. 54, 102. https://doi.org/10.1007/s11250-022-03096-9 [ Links ]
Mishra, A.K., Vohra, V., Raja, K.N., Singh, S. & Singh, Y., 2017.Principal component analysis of biometric traits to explain body conformation in Kajali sheep of Punjab, India. Indian J. Anim. Sci. 87(1), 93-8. [ Links ]
Mohlatlole, R.P., Dzomba, E.F. & Muchadeyi, F.C., 2015. Addressing production challenges in goat production systems of South Africa: The genomics approach. Small Rumin. Res. 131, 43-49. http://dx.doi.org/10.1016/j.smallrumres.2015.08.003 [ Links ]
Mokoena, K. & Tyasi, T.L., 2021. Morphological structure of South African Boer goats explained by Principal Component Analysis. Veterinaria. 70(3), 325-334. doi.org/10.51607/22331360.2021.70.3.325 [ Links ]
Omotosho, B.O., Bemji, M.N., Bamisile, K., Ozoje, M.O., Oluwatosin, B.O., Sowande, O.S., Wheto, M., James, I.J., Lawal, A.M. & Osinowo, O.A., 2020. Comparative study of growth patterns of Kalahari Red goats and West African dwarf goats reared in Southwest Nigeria. Nig. J. Anim. 47(5), 213-226. http://dx.doi.org/10.51791/njap.v47i5.1334 [ Links ]
Pienaar, A., 2012. The origin and history of the Kalahari Red. Available at https://kalaharired.co.za/wp-content/uploads/2014/07/The-origin-and-history-of-the-Kalahari-Red.pdf (Accessed 30 May 2022) [ Links ]
Putra, W.P.B., Ilham, F., 2019. Principal component analysis of body measurements and body indices and their correlation with body weight in Katjang does of Indonesia. J. Dairy Vet. Anim. Res. 8(3), 124-34. [ Links ]
Rashijane, L.T., Mbazima, V.G. & Tyasi, T.L., 2021. Prediction of body weight from linear body measurement traits of Boer goats raised at farm Tivolie, Limpopo Province, South Africa. Am. J. Anim. Vet. Sci. 16(4), 278-288.http://dx.doi.org/10.3844/ajavsp.2021.278.288 [ Links ]
Sankhyan, V., Thakur, Y.P., Katoch, S., Dogra, P.K. & Thakur, R., 2018. Morphological structuring using principal component analysis of Rampur Bushair sheep under transhumance production in western Himalayan region, India. Indian J. Anim. Res. 52 (6), 917-22. http://dx.doi.org/10.18805/ijar.B-3296 [ Links ]
Shabalala, Z.P., Moeletsi, M.E., Tongwane, M.I. & Mazibuko, S.M., 2019. Evaluation of infilling methods for time series of daily temperature data: Case study of Limpopo province, South Africa. Climate. 7, 86.https://doi.org/10.3390/cli7070086 [ Links ]
Snyman, M.A., 2014. South African goat breeds: Kalahari Red. Info-pack ref. 2014/009. Grootfontein Agricultural Development Institute, RSA. [ Links ]
Zewdu, E., Aynalem, H., Markos, T., Sharma, A.K., Dejene A., Sölkner, J. & Wurzinger, M., 2009. Morphological characterization of Bonga and Horro indigenous sheep breeds under smallholder conditions in Ethiopia. Eth. J. Anim. Prod. 9(1), 117-133 [ Links ]
Submitted 12 June 2022
Accepted 4 November 2022
Published 5 April 2023
# Corresponding author: Email: louis.tyasi@ul.ac.za

