


Serviços Personalizados
Artigo
 Inglês (pdf)
 Artigo em XML
 Referências do artigo
Indicadores

Links relacionados
-
 Citado por Google
 -
 Similares em Google
Compartilhar

 Permalink
South African Journal of Animal Science
versão On-line ISSN 2221-4062
versão impressa ISSN 0375-1589
S. Afr. j. anim. sci. vol.52 no.3 Pretoria 2022
http://dx.doi.org/10.4314/sajas.v52i3.10
Enteric methane emission estimates for cattle in Ethiopia from 1994 to 2018
S. E. WassieI, #; A. WilkesI; M. TadesseII; B. AssefaIII; M. AbuIII; D. SolomonIV
IUnique Forestry and Land Use GmbH, Schnewlistrasse 10, Freiburg, 79098, Germany
IIEthiopian Institute of Agricultural Research, Holetta Research Centre, Ethiopia
IIIEnvironment and Climate Change Coordination Directorate, Ministry of Agriculture, Addis Ababa, Ethiopia
IVCGIAR Research Program on Climate Change, Agriculture and Food Security (CCAFS), International Livestock Research Institute (ILRI), Addis Ababa, Ethiopia
ABSTRACT
The objective of this study was to estimate enteric methane emissions of the Ethiopian cattle population using the Intergovernmental Panel on Climate Change (IPCC) Tier 2 approach. A comprehensive literature review was undertaken to obtain country-specific livestock activity data required to estimate emission factors using the Tier 2 method. Indigenous multi-purpose breeds in the mixed crop-livestock and pastoral/agro-pastoral production systems represent more than 96-97% of the cattle population, and the remainder are specialized dairy breeds. Mean enteric emissions factors from 1994 to 2018 for cattle sub-categories ranged from 3.4 kg to 74 kg methane/headgear for calves older than six months and adult cows in production systems, and from 5.2 kg to 57 kg methane/head/year and 6 kg to 64 methane/head/year for calves less than six months and adult cows in the mixed crop-livestock and pastoral/agro-pastoral production systems,. The national average emission factor for dairy and multi-purpose cows was 74 kg methane/head/year- and 60 kg methane/head/year, across the time series. The current study is the first of its kind for Ethiopia, relying on country-specific animal performance data. It is expected to contribute to an improved national greenhouse gas inventory and provide a basis for better quantification of mitigation targets. Uncertainty of enteric methane emission estimates could be further reduced in the future with more complete data on cattle populations, animal performance and feed characterization.
Keywords: emission factors, greenhouse gas, production systems
Introduction
Livestock rearing is an integral part of agricultural systems in sub-Saharan Africa. Livestock production contributes to 35% of the region's agricultural gross domestic product, mainly through animal source food, and supports the livelihoods of millions of people in sub-Saharan Africa, providing nutrient-dense food, income, manure for crop cultivation and other socio-cultural benefits (Herrero et al., 2013). On the other hand, livestock production has a significant impact on greenhouse gas (GHG) emissions, accounting for about 14.5% of global GHG emissions when emissions in upstream and downstream parts of livestock value chains are included (Gerber et al. 2013), which is a global concern.
The scale of livestock production in sub-Saharan Africa has been growing rapidly, with cattle populations increasing by almost 3% per annum in the last two decades (FAO, 2021). This is driven by an increase in demand for animal source food (meat, milk) because of population growth, urbanization, and higher incomes (Enahoro et al., 2019; Herrero et al., 2008). Tubiello et al. (2014) estimated that more than 70% of sub-Saharan African agricultural GHG emissions were caused by livestock production. These emissions are dominated by methane (CH4) emissions from enteric fermentation. Methane is produced as a by-product of the normal ruminant digestive process, in which microbes in the rumen ferment the feed consumed by the animal. Enteric CH4 emission is determined mainly by the level of feed intake, the type and quality of feed, and the amount of energy consumed. However, there are few studies of GHG emissions from livestock in sub-Saharan Africa. As a result, countries such as Ethiopia have been using the less accurate IPCC Tier 1 approach to estimate livestock emissions in their national GHG inventories. Tier 1 estimated emission factors given in IPCC (2006) were based largely on expert judgement, whereas those in the 2019 Refinement to the 2006 IPCC guidelines (IPCC, 2019) used a global model of livestock production (FAO, 2018), many parameters of which have not been validated against national research. The IPCC default emission factors are intended to be broadly applicable at continental level, but may not be accurate for particular countries because of differences in animal genetics, types and quality of feed and other country-specific factors. This hampers efforts to assess the climate impact of cattle production accurately and identify measures to mitigate the GHG effects of livestock production systems in sub-Saharan Africa.
Ethiopia has the largest cattle population in Africa (FAO, 2021). The livestock sector contributes 14% of Ethiopia's gross domestic product and is an important source of income and livelihood for the rural population. Ethiopia submitted its Second National Communication (SNC) to the United Nations Framework Convention on Climate Change (UNFCCC) in 2015 (Federal Democratic Republic of Ethiopia (FDRE), 2015). The National GHG Inventory included in the SNC reports livestock GHG emissions from 1994 and 2013 compiled according to the 1996 IPCC guidelines and Tier 1 approaches to enteric fermentation. According to Ethiopia's SNC, the livestock sector was responsible for 60% of agricultural emissions (69,335 Gg carbon dioxide equivalents) with enteric CH4, mainly from cattle, accounting for 90% of the emissions (FDRE, 2015). The livestock sector has thus been recognized as a key source of GHG emissions from the agricultural sector in Ethiopia. However, existing estimates of GHG emissions were calculated with the IPCC Tier 1 method, with an emission factor of 31 kg CH4 herd/year for all cattle. The use of default values enabled the GHG inventory to reflect change only in livestock population numbers, but it could not distinguish effectively between production systems and changes in animal performance, which led to inaccuracies in enteric CH4 emission estimates.
Studies in sub-Saharan Africa have shown substantial discrepancies between Tier 1 and Tier 2 emission estimates in livestock systems (Du Toit et al., 2014; Kouazounde et al., 2015; Goopy et al., 2018; Ndung'u et al., 2018). This highlighted the need to establish country-specific CH4 emission factors that reflected national conditions and more accurate enteric CH4 emission estimates. Improved GHG emission estimates would help a country to identify GHG mitigation priorities and measures, contribute to improved estimates of livestock sector GHG emissions at continental and global level, show the contributions of the livestock sector to the country's nationally determined contributions, and provide a basis for better quantification of mitigation targets. The present study, therefore, aims to estimate enteric CH4 emissions from cattle production systems in Ethiopia using a Tier 2 method.
Material and methods
Enteric CH4 emission factors for cattle in Ethiopia were estimated with the Tier 2 method following the IPCC (2006) guidelines with reference to the 2019 Refinement to the 2006 IPCC Guidelines for National GHG Inventories (IPCC, 2019). Dairy cattle were defined as cross-bred and pure-bred cattle with genetics of exotic specialized dairy breeds, whereas other cattle were defined as local and indigenous breeds, which were mostly dual-purpose breeds. Emissions were estimated for each year from 1994 to 2018. Input data to estimate cattle populations and characterize animal performance and diet by cattle sub-category were collected from country-specific data sources through systematic web searches using Google Scholar and bibliographic references. These included scientific publications, research reports, official government reports, and master's and doctoral theses (IPCC, 2006; 2019). Studies were used if they had been conducted on cattle from 1994 onwards (the base year for Ethiopia's national inventory) and reported parameter values related to one or more of these variables: herd structure, production system, breed, live weight (LW), mature weight, weight gain, feed type, diet digestibility (DE) and the nutritional composition of the overall diet. Data sources were preferred if they were nationally representative or based on large samples at national, agro-ecological zone or region level and if multi-year values were reported to support time series consistency. This study was implemented under a cooperation agreement approved by the Ministry of Agriculture and used only secondary data. Because national research policies were followed, ethical clearance was not required.
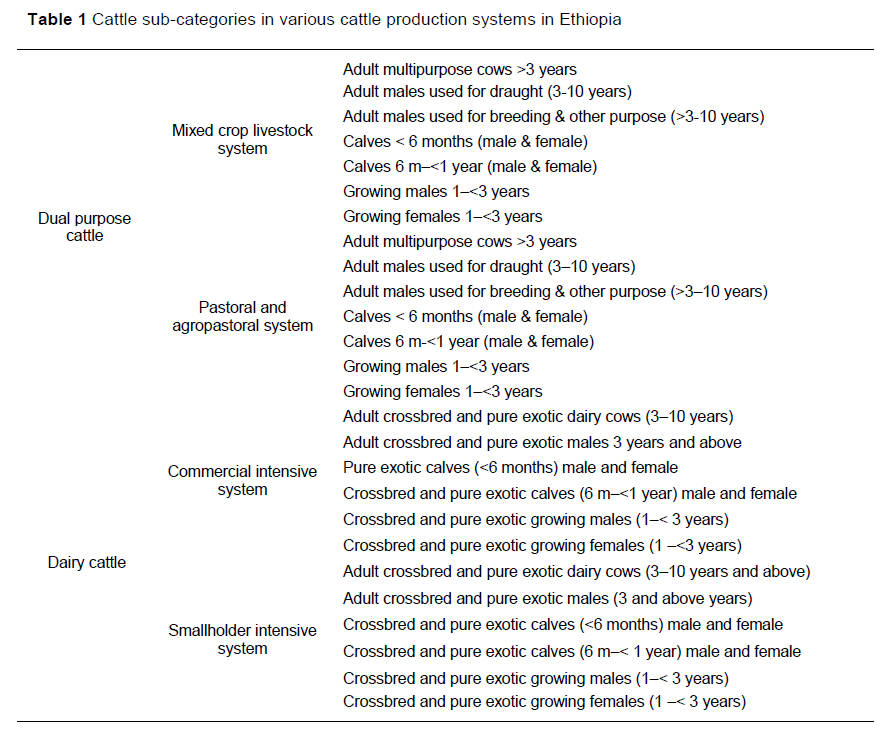
Cattle production systems vary in terms of population, breed type, feeding system, feed type, and productivity (Tegegne et al., 2007). In this study, four cattle systems were identified: mixed crop-livestock (MCL), pastoral/agro-pastoral (PAP), smallholder intensive (SID) and commercial intensive (CID) dairy systems. The CID population includes cattle raised in urban and peri-urban areas and on commercial farms. The SID dairy cattle population is located mostly in rural areas characterized by mixed crop-livestock production. Mixed crop-livestock and PAP systems use multi-purpose cattle (indigenous breeds). The main data sources for cattle populations in MCL and PAP systems were the annual livestock sample survey reports of Ethiopia's Central Statistical Agency (CSA). The SID population was estimated from CSA reports of cross-bred and pure exotic cattle reported in these surveys. Large-scale surveys of CI populations were used to estimate populations in the dairy production system.
The IPCC (2006) recommends that cattle populations 'should be classified into at least three main subcategories: mature cows, other mature, and growing cattle'. Depending on the level of detail in the emission estimation method, subcategories could be further classified based on animal or feed characteristics. The classification in the present study reflected cattle type (dairy, dual-purpose), feed characteristics (production system) and animal characteristics (age, sex). Accordingly, six sub-categories of dairy cattle were identified in each of the SID and CI systems and seven sub-categories of dual-purpose cattle were identified for each of the MCL and PAP systems (Table 1).
A comprehensive literature review was undertaken to estimate the live weight (LW) of each sub-category in each production system. One hundred and four publications (6 in CID, 60 in MCL, and 38 in PAP production systems) reported estimates of cattle LW and growth rates at various ages (Wilkes et al., 2020). The review confirmed that there is no existing time series of nationally representative LW measurements. Therefore, available data on LW, weight gain and mature weight for each sub-category were estimated based on the average values of studies conducted over several years. The estimated LW values were then used consistently throughout the time series. For adult cattle, no report of weight gain was identified, and consistent with the IPCC (2006) guidelines, weight gain for adult cattle was assumed to be zero. The methodological approach and assumptions used to estimate cattle LW and weight gain were discussed in detail in Wilkes et al. (2020).
The proportions of dual-purpose cows giving birth (calving rate) in MCL and PAP systems were estimated using CSA data on the number of total calves born and the number of cows in milk in the reference year as proxy indicators. The proportion of cows giving birth (P) was estimated as:

where dead calves were estimated using calf mortality rates (21.3%) reported in the MCL and PAP agro-pastoral production systems (Fentie et al., 2016), which was then added to the CSA calf population. The number of cows in milk was taken from the CSA annual surveys.
The resulting estimates of the proportion of cows giving birth in the MCL system ranged from 33% to 57%. Because it was not possible to estimate numbers of cows in milk specifically for the PAP production system from the CSA annual livestock data, the proportions of cows giving birth in each year for MCL systems were applied to the PAP system. A cross-check against literature reports for the PAP system indicated that these proportions were within the range reported in the literature specific to the PAP system (Mukasa-Mugerwa & Tegegne, 1993; Galal et al., 1981; Lesnoff et al., 2002). The number of cows in milk, calves alive and calf deaths were used to calculate the proportion of dual-purpose cows giving birth (Supplementary Table S4).
For the proportion of dairy cows giving birth in the CID and SID systems, this equation was used:

where the reported calving interval (507 days) was obtained from a longitudinal study from 1987 to 2007 using 493 crossbred Holstein Friesian dairy cows (1750 observations) in urban and peri-urban dairy systems (Million et al., 2010). The resulting estimate for the proportion of cows giving birth was 72%. Since the dataset showed no significant trend over time, this estimate was used consistently throughout the times series.
A time series for average daily milk yield in the MCL and PAP systems was obtained from CSA surveys. The CSA reported daily milk yield was converted to annual average daily milk production (average over 365 days) by multiplying the reported daily milk yield by the average lactation length of milking cows (248 days) taken from published literature (Wilkes et al., 2020), and by the proportion of cows giving birth across the time series. This average daily milk yield in litres was converted to kg using a standard conversion of 1.031 kg per litre. Since the CSA daily milk did not consider the portion suckled by calves, calf milk consumption was estimated according to NRC (2001) and added to the adjusted CSA estimate. The resulting daily milk yields in MCL and PAP systems are presented in in Supplementary Table S5. A default value of 4% was used (IPCC, 2006) for milk fat content for all cows,.
Milk yield estimates for dairy cattle in CID and SID systems were obtained from studies conducted all over Ethiopia (Wilkes et al., 2020, Annex A3.1). These studies recorded milk off-take and did not include estimates of calf suckling. The average daily milk off-take per head in CID and SID systems was estimated to be 8.2 litres in 2013, which was converted to kilograms at a standard conversion of 1.031 kg per litre, and dairy cow milk off-take was estimated at 8.5 kg cow-1 day-1. The daily milk yield was converted to annual average daily milk production (average over 365 days) by multiplying the reported daily milk yield by the average lactation length of milking cows (325 days) taken from published literature (Wilkes et al., 2020), and by the proportion of cows giving birth (72%). Furthermore, Minten et al. (2018) reported that the average annual growth rate of milk yield in the CID and SID systems was 1.04% between 2009 and 2018. This growth rate was applied to the whole time series for milk off-take to extrapolate milk off-take for each year back to 1994. The estimated milk yield for 1994 compared well with literature reports from that period (Staal, 1996). The resulting daily milk yield was adjusted for calf suckling, which was calculated following the NRC (2001) method. The resulting milk yield estimates are presented in Supplementary Table S5. A default value of 4% was used (IPCC, 2006) for milk fat content in CID and SID systems,.
Only male cattle in the MCL and PAP systems are commonly used for draught power. Limited information was available on number of hours of work per calendar day in Ethiopia. Holeta Agricultural Research Centre (unpublished, 2019) reported an estimate of 1.28 hours per calendar day based on the assumption that oxen plough for two months of the year (not including Sundays) and six hours per day, making an annual daily average of 0.85 hours, and thresh for one month (not including Sundays) and six hours per day, making an annual daily average of 0.43 hours. Wilson (2003) reported that oxen plough 1.66 hours per calendar day using data from 1994. Work hours from 1995 to 2017 were interpolated linearly between these two values.
Diet composition for cattle in the MCL system was obtained from CSA annual sample surveys. The CSA data on livestock feed utilization was obtained by asking farmers to estimate the proportions of feed components in the total feed, which were grouped in six categories: i) natural pastures (grazing), ii) crop residues (straw and chaff of cereals), iii) improved feed crops (alfalfa), iv) hay (clover, cut and carry system), v) agro-industrial by-products (oil cakes, grain bran), and vi) other non-conventional feeds (CSA, 2009). The historical data on actual feed utilization revealed that natural pasture (55%-64%) and crop residue (26%-32%) made up most of the feed resources used by cattle (CSA, 2003-2018). Since CSA does not report feed utilization for the PAP, CID or SID systems, expert judgment was used to estimate diet composition in these systems. National experts suggested that the diet composition was natural pasture (98%) and crop residue (2%) in the PAP system, and industrial by-product (47%), hay cut and carry (38%), crop residue (12%), improved forage crops (1%) and other feed types (3%) for CI AND | SID systems. Expert judgment was also used to allocate specific feedstuffs to the six main feed components.
The list of feedstuffs with their chemical composition and nutritive values, including digestible energy (DE) and metabolizable energy (ME), was taken from the national feed database (Ethiopian Institute of Agricultural Research (EIAR), 2007), which contains more than 200 samples from six agro-ecological regions of the country. Gross energy was calculated using IPCC (2006) equations 10.14-10.16 for each cattle sub-category in each cattle production system. Feed energy digestibility as a percentage of gross energy values of each feedstuff was estimated using the following equations from CSIRO (2007):
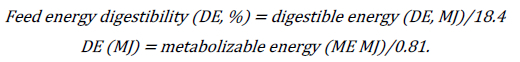
The DE (%) value of each feed component was calculated as the average of each feedstuff's DE value in the EIAR database. For crop residues, the DE value was calculated from the seven major cereal crops (teff, barley, wheat, sorghum, maize, millet, and oats), which are considered available as crop residues for livestock feed. The DE value of crop residue was calculated as described in Wilkes et al. (2020, Annex 4). The resulting DE (%) for the MCL system was from 53.9 to 53.5 in various years and was assumed to have constant values of 55% in the PAP system and 62% in the CID and SID systems.
Enteric CH4 emission factors were estimated for each cattle subcategory in each production system using the IPCC (2006) equation:

where, EF =the emission factor (kg CH4/head/year), GE = gross energy intake (MJ/head per day), Ym = CH4 conversion factor (%), 55.65 (MJ/kg CH4) = energy content of CH4, 365 days = number of days in the year. The value for Ym was the IPCC default of 6.5% (IPCC, 2006). The emission factors developed for each category of cattle were annual emission factors, except for calves younger than 6 months and calves between 6 months and 1 year old, for which a methane conversion factor of 3.3% was used, because these animals were not in each of these age classes for more than six months. For each production system, an average emission factor was estimated as a population-weighted mean of the emission factors of each subcategory in the production system. The population weighted mean emission factor is also referred to as an implied emission factor.
Uncertainty analysis for enteric CH4 emission was accomplished using Monte Carlo simulation implemented in Palisade @Risk software using the mean values, margins of error around the mean value, and assumed probability density functions for each input parameter. The assumptions are shown in Supplementary Tables S8 and S9 for the pastoral and agro-pastoral, and mixed crop-livestock systems. The contribution of each variable to total uncertainty was estimated using Spearman's ranked correlation coefficients (Milne et al., 2014).
Results and Discussion
Using the country-specific Tier 2 CH4 emission factors and the total cattle population from 1994 to 2018, enteric CH4 emission increased from 1454 Gg CH4 in 1994 to 3143 Gg CH4 in 2018 (Table 2). Non-dairy cattle in the MCL production system made the largest contribution to annual enteric CH4 emissions between 1994 and 2018, contributing 80% to 88% of the annual total, followed by non-dairy cattle in the PAP production system (11%-18%). Dairy cattle from commercial and smallholder dairy systems contributed 0.8% to 3.4% of annual enteric CH4 emissions between 1994 and 2018.
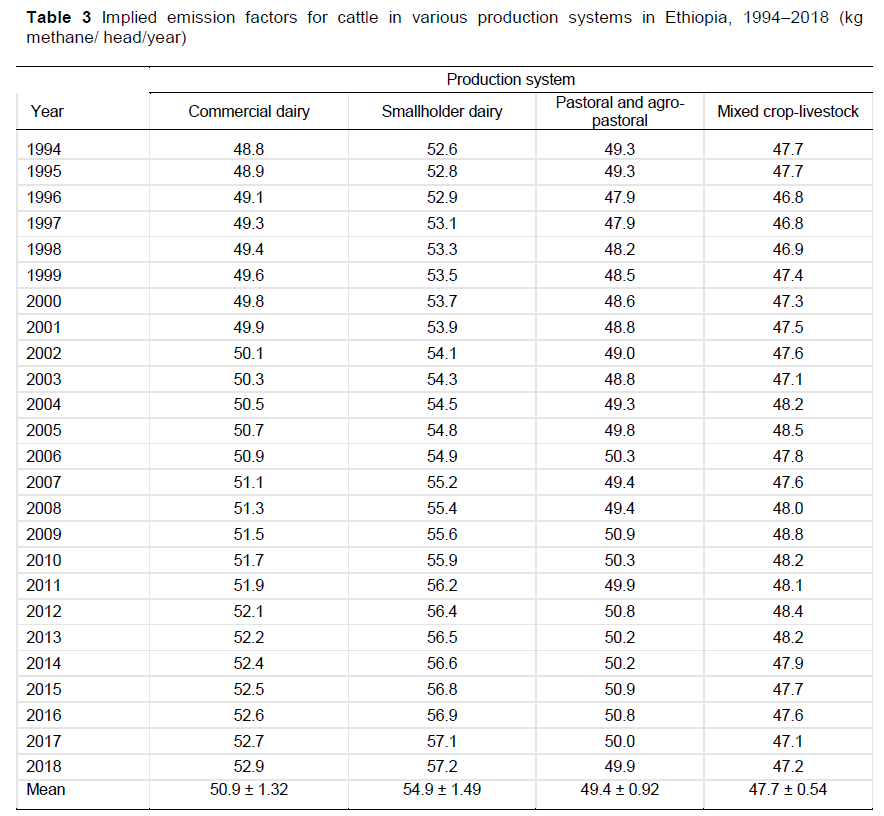
Implied CH4 emission factors for dairy cattle in the various production systems are presented in Table 3. The implied CH4 emission factors for dairy cattle in the CID and SID systems increased by an annual average rate of 0.34% and 0.35%, respectively, from 1994 to 2018 (Table 3). The annual average change in implied CH4 emission factors for cattle in the MCL and PAP systems was 0.06% and -0.04%, respectively (Table 3).
Mean CH4 emission factors from 1994 to 2018 ranged from 3.4 kg CH4 herd/year for calves older than six months to 74 kg CH4 herd/year for dairy cows in the SID and CID systems (Supplementary Table S6). The implied emission factors (population-weighted average) for all subcategories of commercial dairy cattle ranged from 49 kg CH4 head/year in 1994 to 53 kg CH4 head/year in 2018, with an overall average of 51 kg CH4 herd/year across the time series (Table 3). Similarly, the population-weighted average for all sub-categories of smallholder dairy cattle ranged from 53 kg CH4 herd/year in 1994 to 57 kg CH4 head/year in 2018, with overall average of 55 kg CH4 herd/year (Table 3).
Implied CH4 emission factors for cattle in the MCL and PAP systems are shown in Table 3. Mean CH4 emission factors from 1994 to 2018 ranged from 5 kg CH4 herd/year for calves to 57 kg CH4 herd/year for cows in the MCL production system (Supplementary Table S7). The implied emission factors for all subcategories ranged from 46.76 kg CH4 herd/year in 1994 to 48.78 kg CH4 head/year in 2009, with average of 48 kg CH4 head/year across the time series (Table 3). Mean CH4 emission factors from 1994 to 2018 ranged from 6 kg CH4 head/year for calves to 64 kg CH4 head/year for cows in the PAP system (Supplementary Table S7). The implied emission factors ranged from 48 kg CH4 head/year in 1994 to 51 CH4 head/year in 2018, with an overall average of 50 kg CH4 head/year across the time series (Table 3).
The average uncertainty of CH4 emission factors was about ±18.7% in 1994 and ±18.0% in 2018. Feed digestibility and LW for cows and oxen in the MCL system, and the population of cows in the MCL and PAP systems were the parameters with the greatest influence on the uncertainty of enteric CH4 emission estimates.
This is the first time the Tier 2 method has been applied to estimate enteric fermentation emissions at national level in Ethiopia. This study found that the Ethiopian cattle population grew by 117% and enteric methane emissions by 116% between 1994 and 2018. Growth in the cattle population has been more rapid than growth in the cattle population globally (13%), in sub-Saharan Africa (76%) and in developing countries as a whole (80%) (FAO 2021). About four fifths of Ethiopia's cattle are kept by smallholders in the mixed crop-livestock system, and a further 15% in the pastoral/agropastoral system. The multifunctionality of cattle in these systems means that in general animal numbers are more important to livestock keepers than animal productivity (Descheemaeker et al., 2016). The authors' literature review found little evidence of change in animal productivity in these systems, apart from increasing calving rates, and no trend of improving feed quality. Thus, 75% of the total increase in cattle emissions between 1994 and 2018 was because of increasing cattle populations in the MCL system. This accorded with other global analyses suggesting that most of the increase in cattle GHG emissions in sub-Saharan Africa is because of increasing livestock populations, with change in productivity (Chang et al., 2021). This differed, however, from developing countries as a whole, where individual animal productivity and emission intensity have been increasing in recent decades (Caro et al., 2014). South Africa for example has a significant commercial cattle sector in which productivity increase has had a notable effect on the GHG emission intensity of cattle production (Tongwane & Moeletsi, 2020). Although cattle of specialized dairy breeds still accounted for less than 3% of Ethiopia's total national herd, their numbers increased more than eightfold between 1994 and 2018. Milk yields have increased and in 2018 average yields were similar to those in other East African countries where the dairy sector is also dominated by smallholders (SDL, 2019). Given their higher LW and milk yield than indigenous dual-purpose cattle, this illustrates that in addition to change in individual animal productivity, change in the structure of the livestock sector could be an important longer-term process affecting the level and intensity of GHG emissions from cattle production.
In this study, the implied emission factor for dairy cattle increased over time because of the assumption that milk yield increased by about 1% per year. The average implied emission factor obtained for dairy cattle in the SID system (55 kg CH4 head/year) is slightly higher than the IPCC 2006 Tier 1 value of 46 kg CH4 head/year for dairy cattle in Africa and the Middle East. However, the emission factors determined for dairy cows in this study was 23% lower than the IPCC (2019) default emission factor for dairy cows in low productivity systems (66 kg CH4 head/year) and 41% lower than the IPCC (2019) default emission factors for dairy cows in high productivity systems (86 kg CH4 head/year) in Africa. The differences between emission factors determined in the present study and default emission factors for Africa are partly because of higher estimated LW (428 kg), milk yield (4.5-6.5 kg/day) and feed digestibility (62%) in this study compared with the default LW (275 kg), milk yield (1.3 kg/day), and feed digestibility (60%) assumed in IPCC (2019), and partly because of different methods used to determine the CH4 conversion factor (Ym). Similarly, Du Toit et al. (2014) and SDL (2019) have reported higher Tier 2 emission factors for dairy cattle in South Africa (76 kg CH4 head/year) and Kenya (70 kg CH4 head/year), respectively, than the IPCC (2006) default emission factors for Africa (46 kg CH4 head/year). The values of the IPCC default emission factors largely depend on the values assumed for LW, feed energy digestibility, milk yield, and Ym (IPCC, 2006). Live weight differs between cattle genotypes, age, and sex, while feed energy digestibility is affected by feeding system and diet quality. The national average LW, feed energy digestibility and milk yield of dairy cows in Ethiopia were 59%, 21% and 315% higher, respectively, than the values assumed for dairy cattle in Africa (IPCC, 2006). Hence, using IPCC (2006) default values of emission factors for dairy cattle would underestimate, and using IPCC (2019) values would overestimate enteric CH4 emission when compared with emission factors developed using country specific information.
The national average emission factor for dairy cows from Ethiopia estimated in the present study was consistent with emission factors reported by Du Toit et al. (2014) for livestock systems in South Africa for dairy (76 kg CH4 head/year) and beef cattle (72 kg CH4 head/year). However, the emission factors derived in the present study are substantially higher for adult dairy cows (74 kg CH4 head/year) than the emission factors estimated for adult females in Western Kenya (28-51 CH4 head/year) (Goopy et al., 2018, Ndung'u et al., 2018), and for adult males in Western Kenya (36-46), Goopy et al., 2018, Ndung'u et al., 2018)). The higher emission factors in the current study compared with these studies might be expected given that the LW of cattle in the present study (428 kg) is approximately 40%-100% higher that of the cattle in the studies in Western Kenya (216-307 kg). The emission factors derived from the present study for calves in CID and ||||S systems were 14.6 and 18.3 kg CH4 head/year. These values were similar to results of Goopy et al. (2018) for calves in Kenya (15.6 kg CH4 head/year). However, enteric CH4 emission factors in the present study for dairy cattle were lower than the enteric CH4 emission factors of 99.37 kg/head/year (ranging from 84 to 112 kg/head/year) reported by Moeletsi et al. (2017) for dairy cattle in South Africa under total mixed ration, pasture-based system and a mixture of TMR and pasture systems. Compared with the present study, Du Toit et al. (2014) reported higher CH4 emission factors of 132, 127, 80, 67 and 63 kg/head/year years for lactating cows, lactating heifers, dry cows, pregnant heifers, and heifers greater than one year respectively. Du Toit et al. (2014) also reported a higher CH4 emission factor of 42, 23 and 22 kg/head/year for females 6 to 12 months, females 2-6 months and calves, for growing dairy cattle in South Africa, respectively. The higher CH4 emission factors in these studies compared with the present study are related to the higher LW of dairy cattle as compared with the LW estimates obtained in the present study. The LWs of lactating/dry cows, heifers older than one year and heifers 6 to 12 months were reported as 590, 322, 172 kg compared with LW of 480, 261 and 117.6 kg used in present study for similar sub-categories, respectively. Higher LW results in higher feed intake and hence higher emission factors compared with animals with lower LW (Frank et al., 2000). Differences in feed characteristics (Frank et al., 2000; Moss et al., 2000) and in breed (Kouazounde et al., 2015) contribute to variations in the emission factor.
The implied emission factors obtained for dual-purpose cattle in the present study (48-50 kg CH4 head/year) are close the Tier 1 default emission factor of 52 kg CH4 herd/year for other cattle in Africa (IPCC, 2019). However, the results obtained using the Tier 2 methodology were 54-61% higher than default value of 31 kg CH4 herd/year for Africa and the Middle East (IPCC, 2006). Compared with IPCC (2006) default emission factors for Africa, higher Tier 2 emission factors were also reported for Benin (40 kg CH4 herd/year) (Kouazounde et al., 2014) and South Africa (62 kg CH4 herd/year, (Moeletsi et al., 2017). However, lower CH4 emission factors of 31 and 16 kg CH4 herd/year were reported for lactating and other cattle (Ndama breed) in Senegal (Ndao et al., 2020). These comparisons highlight the necessity for developing country-specific emission factors that reflect the national circumstances and actual animal management and performance in different production systems.
Application of the IPCC Tier 2 method requires disaggregation of activity data on animal populations and detailed data on animal performance. Uncertainty analysis can provide important information for prioritizing methodological and data improvements (IPCC, 2019). The average uncertainties of enteric fermentation emissions from cattle were between +18% and -16% in 2018. This compares well with the IPCC (2006) default uncertainty range for Tier 2 emission factors of ±20%. The main factors associated with uncertainty in enteric fermentation emissions were feed energy digestibility and LW for cows and oxen in the MCL production system. Due to lack of a time series for nationally representative LW and average daily weight gain for each cattle subcategory, this study used average values for LW, weight gain and mature weight of cows and oxen based on studies conducted in various years and locations, which contributes to the uncertainty of LW estimates used. Diet composition in the PAP and commercial and smallholder dairy systems were based on expert opinion, and expert opinion was also applied to characterize the specific feedstuffs used to estimate the feed digestibility of the main diet components reported in CSA annual sample survey data. Furthermore, the CSA data is not disaggregated by cattle sub-category, which introduces additional uncertainty associated with the emission factor estimates. Improving data quality for these key parameters is important because improved data quality can reduce the uncertainty of inventory estimates. The other priority improvement would be to obtain better estimates of the proportion of cows in the MCL and PAP production systems, indicating that improvements in national statistical data collection and reporting systems can also contribute to improved GHG inventories (Rosenstock & Wilkes, 2021).
Conclusions
This study used the IPCC Tier 2 method to estimate enteric fermentation emissions from cattle in Ethiopia. Enteric CH4 emissions are estimated to have increased by 116% between 1994 and 2018. Cattle in the MCL production system had the greatest contribution to total enteric emissions and accounted for 75% of the increase in enteric CH4 emissions over this period. Emission factors developed on the basis of a thorough literature review found no evidence of increased animal productivity in the main production systems in Ethiopia, indicating that increased animal populations are the key driver of enteric CH4 emissions from cattle. Although still a very small part of the cattle sector, there has been rapid growth in specialized dairy breed populations and milk yields, suggesting that change in the structure of the sector could affect the level and intensity of GHG emissions from cattle production in the future. The country-specific estimates of enteric CH4 emissions using the IPCC Tier 2 method had comparable results with values reported in the literature for sub-Saharan Africa, but differences highlighted the importance of using country-specific information on production parameters and feed characteristics to derive more accurate emission factors. Uncertainty analysis indicated that uncertainty can be reduced with better estimates of the proportions of cows in the cattle populations in the MCL and PAP systems, and with more accurate data on LW and digestibility of the diet of cows and oxen in the MCL system. In addition, proxies were used to estimate cattle sub-category populations in the commercial and subsistence dairy production systems, and better activity data for these systems would also reduce overall uncertainty. This study contributes to an improved national GHG inventory for Ethiopia and provides a basis for better quantification of mitigation targets and effects of policies and measures in Ethiopia's livestock sector.
Acknowledgements
This research was implemented in partnership with the CGIAR Research Program on Climate Change, Agriculture and Food Security (CCAFS) and Ethiopia's Ministry of Agriculture. The authors gratefully acknowledge most useful advice provided by the inventory advisory team and national experts from Ethiopia's Ministry of Agriculture and Ethiopia Institute of Agricultural Research. The financial support by the CGIAR Research Program on Climate Change, Agriculture and Food Security (CCAFS), carried out with support from CGIAR Fund Donors and through bilateral funding agreements is also appreciated. For details, please visit https://ccafs.cgiar.org/donors.
Author contributions
SEW: conceptualization, methodology, data curation, formal analysis, original draft preparation, review & editing. AW: investigation, software, methodology, formal analysis, review & editing. MT: methodology, original draft preparation. BA: review & editing. MA: methodology, review & editing, data curation. DS: review & editing, project administration.
Declaration of interests
The authors declare the following financial interests/personal relationships which may be considered potential competing interests: Authors AW and SEW are employed by UNIQUE forestry and land use GmbH, a consulting company.
References
Caro, D., Davis, S.J., Bastianoni, S. & Caldeira, K., 2014. Global and regional trends in greenhouse gas emissions from livestock. Climatic Change 126(1), 203-216. DOI: 10.1007/s10584-014-1197-x [ Links ]
Chang, J., Peng, S., Yin, Y., Ciais, P., Havlik, P. & Herrero, M., 2021. The key role of production efficiency changes in livestock methane emission mitigation. AGU Advances 2(2), p.e2021AV000391. DOI: 10.1029/2021AV000391 [ Links ]
CSA, 2009. Agricultural Sample Survey II. Report on livestock and livestock characteristics. Statistical Bulletin. Addis Ababa, Ethiopia. [ Links ]
CSA., 2019. Agricultural Sample Survey II. Report on Livestock and Livestock Characteristics. Statistical Bulletin. Addis Ababa, Ethiopia. [ Links ]
CID}RO, 2007. Nutrient requirements of domesticated ruminants. CID}RO, Clayton, Australia. [ Links ]
Descheemaeker, K., Oosting, S.J., Tui, S.H.K., Masikati, P., Falconnier, G.N. & Giller, K.E., 2016. Climate change adaptation and mitigation in smallholder crop-livestock systems in sub-Saharan Africa: A call for integrated impact assessments. Reg. Environ. Change 16(8), 2331-2343. DOI: 10.1007/s10113-016-0957-8 [ Links ]
Du Toit, C., Meissner, H. & Van Niekerk, W., 2014. Direct methane and nitrous oxide emissions of South African dairy and beef cattle. S. Afr. J. Anim. Sci. 43, 320-339. DOI: 10.4314/sajas.v43i3.7 [ Links ]
EIAR, 2007. Chemical composition and nutritive values of Ethiopian feeds. Edited by B. Seyoum, S. Zinas, & F. Dereje. EIAR, Addis Ababa, Ethiopia. [ Links ]
Enahoro, D., Mason-D'Croz, D., Mul, M., Rich, K.M., Robinson, T.P., Thornton, P. & Staal, S.S., 2019. Supporting sustainable expansion of livestock production in South Asia and sub-Saharan Africa: Scenario analysis of investment options. Glob. Food Secur. 20, 114-121. DOI:10.1016/j.gfs.2019.01.001 [ Links ]
FAO, 2018. Global livestock environmental assessment model 2.0 documentation. FAO, Rome, Italy. [ Links ]
FAO, 2021. FAOSTAT database. https://www.fao.org/faostat/en/#data. [ Links ]
FDRE, 2015. Ethiopia's Second National Communication to the United Nations Framework Convention on Climate Change (UNFCCC). Ministry of Environment and Forest, Addis Ababa, Ethiopia. [ Links ]
Fentie, T., Temesgen, W., Melaku, A., Assefa, G., Tesfaye, S., Fufa, F., Adane, Z., Niguse, A., Alemu, B., Wahild, F.Z., Hailu, B., Guta, S. & Mekonen, G., 2016. Feed the Future: Assessment of young stock mortality in major livestock production systems of Ethiopia. United States Agency for International Development, Washington DC, USA. [ Links ]
Frank, O.M., Michael, R., John, C., Pat, O., Owen, C., Lenehan, J., Dan, L., Bernard, H., Eddie, J. & Michael H., 2000. Climate change-Emissions of greenhouse gases from agriculture and strategies for their reduction (2000-LS- 5.1.1) Synthesis Report. Environmental Protection Agency, Wexford, Ireland. [ Links ]
Gerber, P.J., Steinfeld, H., Henderson, B., Mottet, A., Opio, C., Dijkman, J., Falcucci, A. & Tempio, G., 2013. Tackling Climate change through livestock: a global assessment of emissions and mitigation opportunities. FAO, Rome, Italy. [ Links ]
Goopy, J.P., Onyango, A.A., Dickhoefer, U. & Butterbach-Bahl, K., 2018. A new approach for im-proving emission factors for enteric methane emissions of cattle in smallholder systems of East Africa - Results for Nyando, Western Kenya. Agr. Sys. 161, 72-80. DOI: 10.1016/j.agsy.2017.12.004. [ Links ]
Herrero, M., Thornton P.K., Kruska R. & Reid, R.S., 2008. Systems dynamics and the spatial distribution of methane emissions from African domestic ruminants to 2030. Agr. Ecosys. Environ. 126, 122-137. DOI: 10.1016/j.agee.2008.01.017 [ Links ]
Herrero, M., Havlík, P., Valin, H., Notenbaert, A., Rufino, M.C. & Thornton, P.K., 2013. Biomass use, production, feed efficiencies, and greenhouse gas emissions from global livestock systems. PNAS 52, 20888-20893. DOI: 10.1073/pnas.1308149110 [ Links ]
IPCC, 2006. 2006 Guidelines for national greenhouse gas inventories. IGES, Kanagawa, Japan. [ Links ]
IPCC, 2019. Refinement to the 2006 IPCC Guidelines for National Greenhouse Gas Inventories. IGES, Kanagawa, Japan. [ Links ]
Kouazounde, J.B., Gbenou, J.D., Babatounde, S., Srivastava, N., Eggleston, S.H., Antwi, C., Baah, J. & McAllister, T.A., 2015. Development of methane emission factors for enteric fermentation in cattle from Benin using IPCC Tier 2 methodology. Animal 9, 526-533. DOI: 10.1017/S1751731114002626 [ Links ]
Lesnoff, M., Diedhiou, M., Laval, G., Bonnet, P., Workalemahu, A. & Kifle, D., 2002. Demographic parameters of a domestic cattle herd in a contagious-bovine-pleuropneumonia infected area of Ethiopian Highlands. Rev. Elev. Med. Vet. Pay. 55 (2), 139-147. [ Links ]
Migose, S.A., van der Linden, A., Bebe, B.O., de Boer, I.J.M. & Oosting, S.J., 2020. Accuracy of estimates of milk production per lactation from limited test-day and recall data collected at smallholder dairy farms. Livest. Sci. 232, 103911. DOI: 10.1016/j.livsci.2019.103911 [ Links ]
Million, T., Thiengtham, J., Pinyopummin, A. & Prasanpanich, S., 2010. Productive and reproductive performance of Holstein Friesian dairy cows in Ethiopia. Livestock Research for Rural Development 22, Article #34. http://www.lrrd.org/lrrd22/2/tade22034.htm [ Links ]
Milne, A.E., Glendining, M.J., Bellamy, P., Misselbrook, T., Gilhespy, S., Casado, M.R., Hulin, A., van Oijen, M. & Whitmore, A.P., 2014. Analysis of uncertainties in the estimates of nitrous oxide and methane emissions in the UK's greenhouse gas inventory for agriculture. Atmos. Environ. 82, 94-105. DOI: 10.1016/j.atmosenv.2013.10.012 [ Links ]
Minten, B., Yetimwork, H., Seneshaw, T. & Agajie, T., 2018. Transforming agri-food systems in Ethiopia: Evidence from the dairy sector. ESSP Working Paper 129. IFPRI, Washington D.C., USA [ Links ]
Moeletsi, M.E., Tongwane, M.I. & Tsubo, M., 2017. Enteric methane emissions estimate for livestock in South Africa for 1990-2014. Atmosphere 8, 69. DOI: 10.3390/atmos8050069 [ Links ]
Monni, S., Perälä, P. & Regina, K., 2007. Uncertainty in agricultural CH4 and N2O emissions from Finland: Possibilities toincrease accuracy in emission estimates. Mitig. Adapt. Strat. Glob. Chang. 12, 545-571. DOI: 10.1007/s11027-006-4584-4 [ Links ]
Moss, A., Jouany, J.P. & Newbold, J., 2000. Methane production by ruminants: its contribution to global warming. Ann. Zootech. 49, 231-253. DOI: 10.1051/animres:2000119. [ Links ]
Mukasa-Mugerwa, E. & Tegegne, A., 1993. Reproductive performance in Ethiopian Zebu (Bos indicus) cattle: Constraints and impact on production. In: ESAP, Proceedings of the Fourth National Livestock Improvement Conference, 1993, Addis Ababa, Ethiopia. Pp. 16-28. [ Links ]
Ndao, S., Traoré, E.H., Ickowicz, A. & Moulin, C.H., 2020. Estimation of enteric methane emission factors for Ndama cattle in the Sudanian zone of Senegal. Trop. Anim. Health Pro. 52, 2883-2895. DOI: 10.1007/s11250-020-02280-z [ Links ]
Ndung'u, P.W., Bebe, B.O., Ondiek, J.O., Butterbach-Bahl, K., Merbold, L. & Goopy, J.P., 2019. Improved region-specific emission factors for enteric methane emissions from cattle in smallholder mixed crop: livestock systems of Nandi County, Kenya. Anim. Prod. Sci. 59, 1136-1146. DOI: 10.1071/AN17809 [ Links ]
NRC, 2001. Nutrient requirements of dairy cattle. 7th revised edition. National Academy Press, Washington, DC, USA. [ Links ]
Rosenstock, T.S. & Wilkes, A., 2021. Reorienting emissions research to catalyse African agricultural development. Nat. Clim. Change 11, 463-465. DOI: 10.1038/s41558-021-01055-0 [ Links ]
SDL. 2019. Inventory of GHG emissions from dairy cattle in Kenya 1995-2017. State Department for Livestock, Nairobi, Kenya. [ Links ]
Staal, S.J., 1996. Peri-urban dairying and public policy in Ethiopia and Kenya: A comparative economic and institutional analysis. PhD dissertation, University of Florida, Gainesville, USA. [ Links ]
Tegegne, A., Gebremedhin, B., Hoekstra, D. & Alemayehu, N., 2007. Rural-urban linkage in market-oriented dairy development in Ethiopia: Lessons from the Ada'a District. In: G. Zeleke, P. Trutmann & A. Denekwe (eds). Fostering new development pathways: Harnessing rural-urban linkages (RUL) to reduce poverty and improve.environment in the highlands of Ethiopia. Global Mountain Program, Addis Ababa, Ethiopia. [ Links ]
Tongwane, M.I. & Moeletsi, M.E., 2020. Emission factors and carbon emissions of methane from enteric fermentation of cattle produced under different management systems in South Africa. J. Clean. Prod. 265, 121931. DOI: 10.1016/j.jclepro.2020.121931 [ Links ]
Tubiello, F., Salvatore, M., Cóndor Golec, R., Ferrara, A., Rossi, S., Biancalani, R., Federici, S., Jacobs, H. & Flammini, A., 2014. Agriculture, forestry and other land use emissions by sources and removals by sinks. FAO Statistics Division, Rome, Italy. [ Links ]
Wilkes, A., Wassie, S.E., Tadesse, M., Assefa, B., Abu, M., Ketema, A. Solomon, D., 2020. Inventory of greenhouse gas emissions from cattle, sheep and goats in Ethiopia (1994-2018) calculated using the IPCC Tier 2 approach. Environment and Climate Change Directorate of the Ministry of Agriculture, Addis Ababa, Ethiopia. [ Links ]
Wilson, R.T., 2003. The environmental ecology of oxen used for draught power. Agr. Ecosys. Environ. 97, 21-37. DOI: 10.1016/S0167-8809(03)00118-X [ Links ]
Zelalem, Y., 1999. Smallholder milk production systems and processing techniques in the Central Highlands of Ethiopia. MSc. thesis, Swedish University of Agricultural Sciences, Uppsala, Sweden. [ Links ]
Submitted 12 June 2021
Accepted 5 March 2022
Published 14 June 2022
# Corresponding author: Shimels.wassie@unique-landuse.de
Supplementary Data
The supplementary data is available in pdf: [Supplementary data]

